NCN vs ETH: Comparing the Future of Decentralized Finance
Introduction: NCN vs ETH Investment Comparison
In the cryptocurrency market, the comparison between NeurochainAI (NCN) and Ethereum (ETH) remains an unavoidable topic for investors. The two differ significantly in market cap ranking, application scenarios, and price performance, representing distinct positions in the crypto asset landscape.
NeurochainAI (NCN): Since its launch, it has gained market recognition for its one-stop platform for AI dApps and innovative approach to the AI compute market.
Ethereum (ETH): Introduced in 2015, it has been hailed as the foundation for decentralized applications and smart contracts, becoming one of the most traded and highest market cap cryptocurrencies globally.
This article will comprehensively analyze the investment value comparison between NCN and ETH, focusing on historical price trends, supply mechanisms, institutional adoption, technological ecosystems, and future predictions, attempting to answer the question investors care about most:
"Which is the better buy right now?"
I. Price History Comparison and Current Market Status
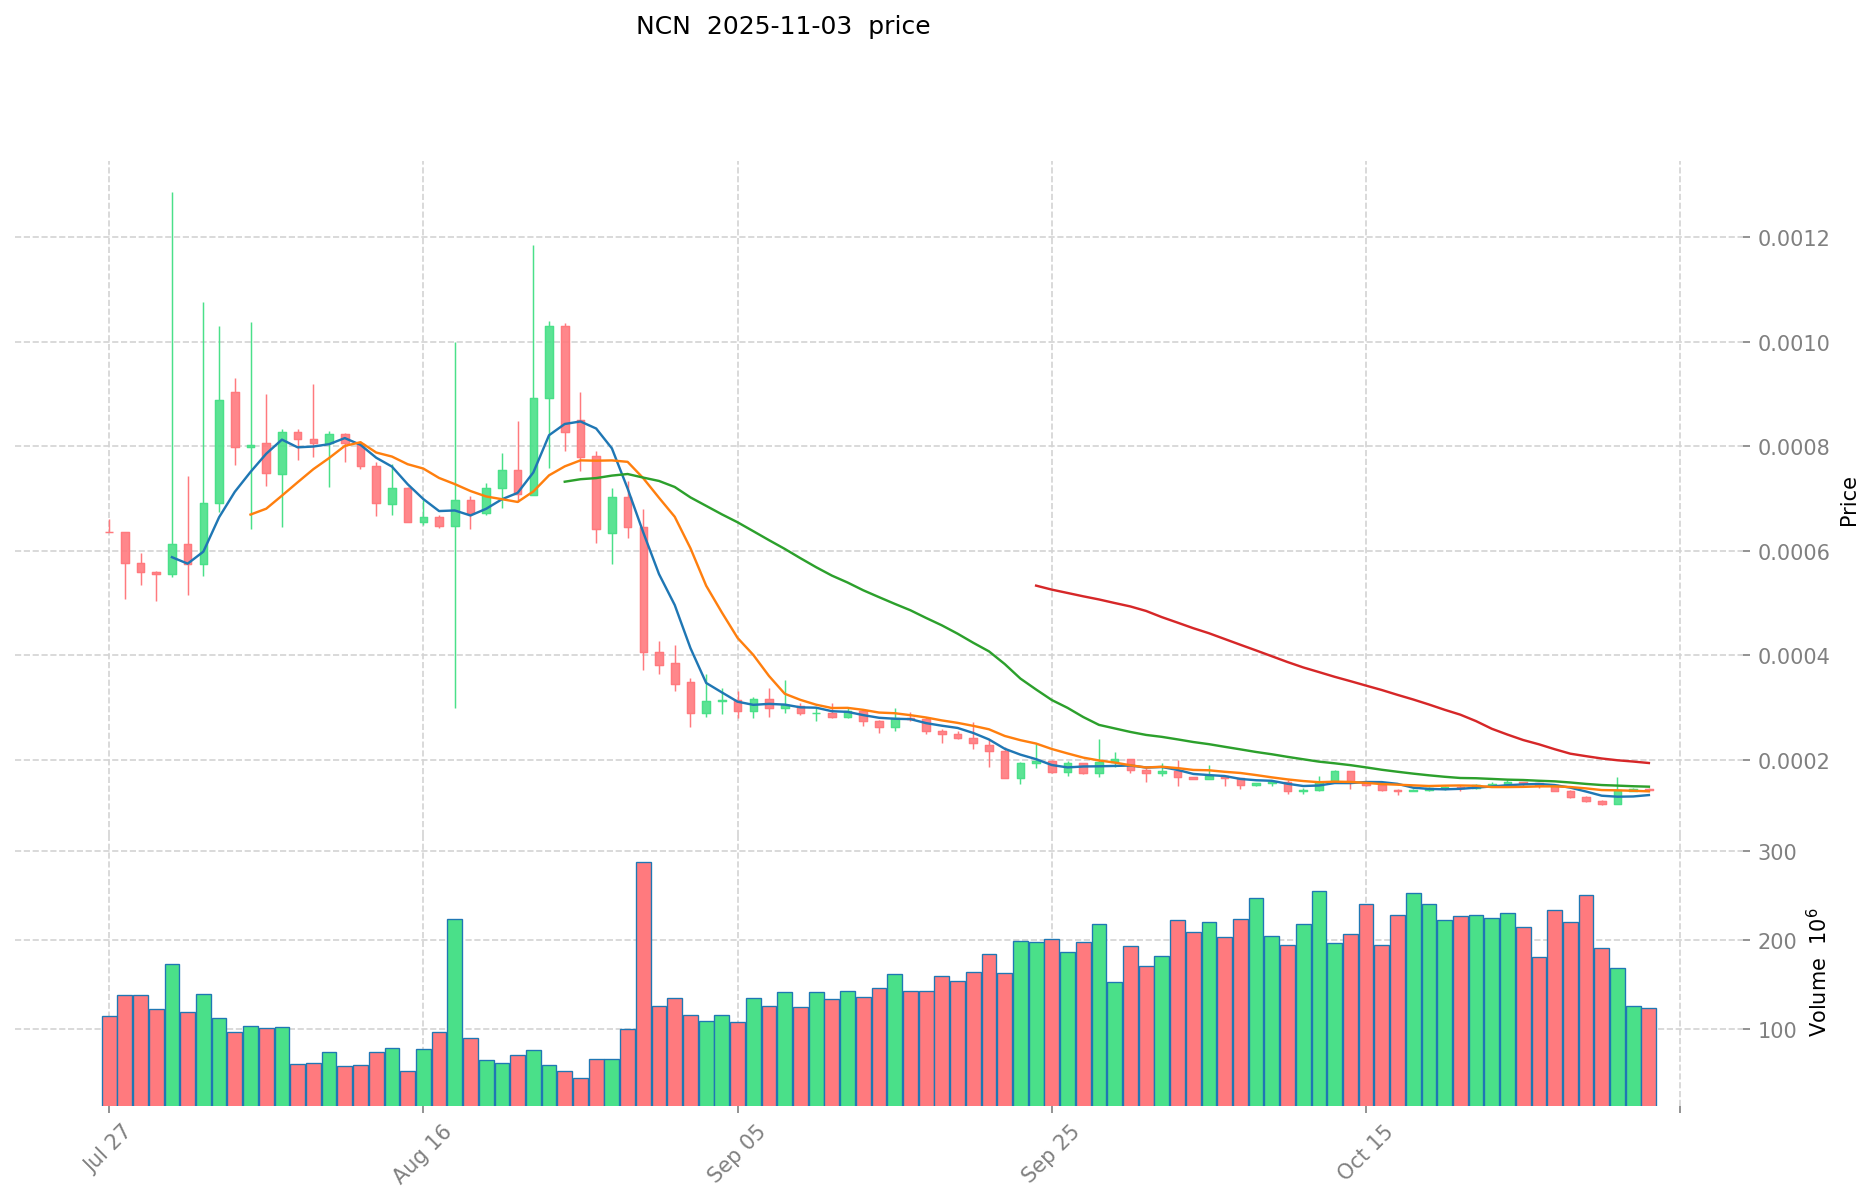
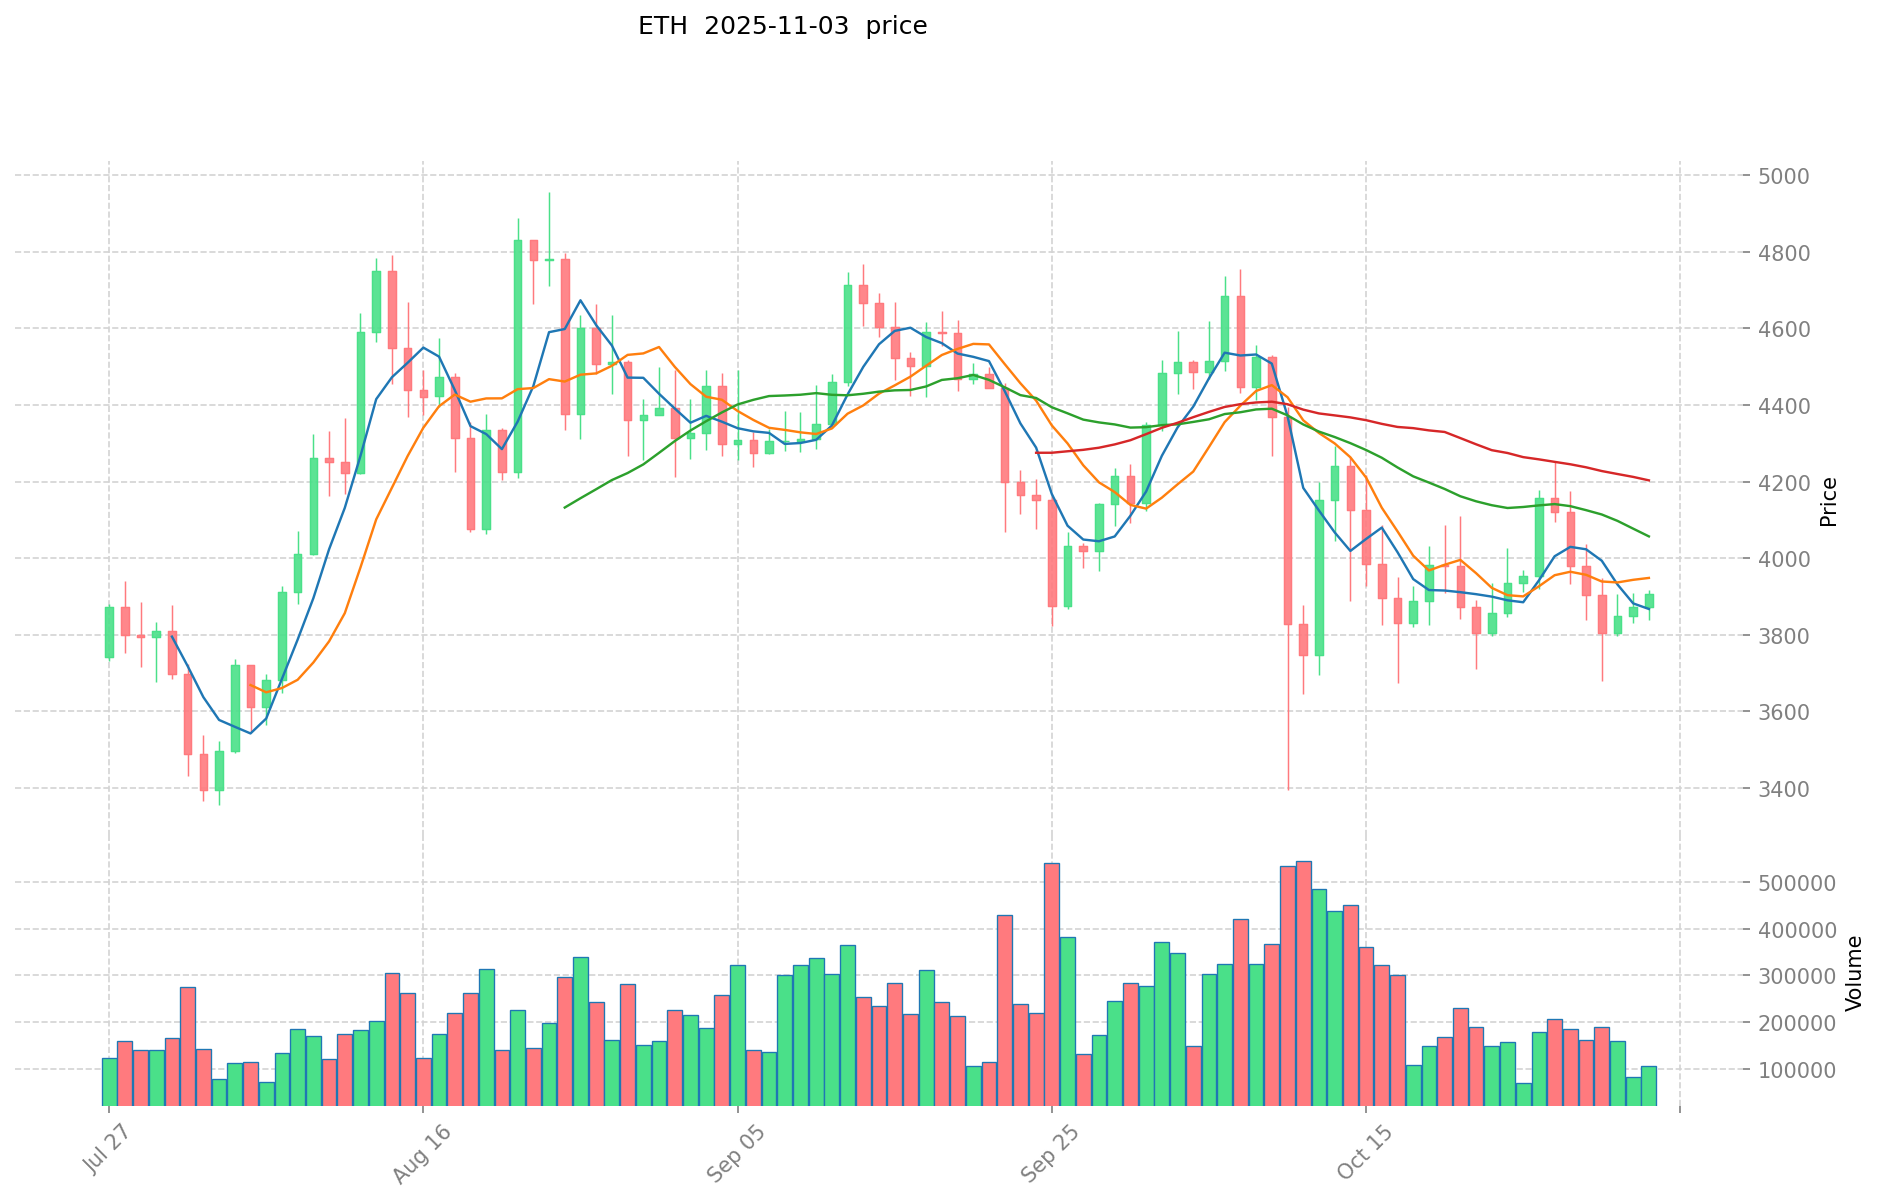
NeurochainAI (NCN) and Ethereum (ETH) Historical Price Trends
- 2024: NCN launched its platform, price fluctuated significantly during initial trading.
- 2025: ETH completed major network upgrades, price showed strong upward momentum.
- Comparative analysis: In the current market cycle, NCN dropped from its all-time high of $0.096643 to a low of $0.0001132, while ETH demonstrated more stability, maintaining a price above $3,500.
Current Market Situation (2025-11-04)
- NCN current price: $0.0001323
- ETH current price: $3,589.84
- 24-hour trading volume: NCN $17,160.77 vs ETH $822,378,757.42
- Market Sentiment Index (Fear & Greed Index): 42 (Fear)
Click to view real-time prices:
- Check NCN current price Market Price
- Check ETH current price Market Price
Key Factors Affecting ETH's Investment Value
Supply Mechanism (Tokenomics)
- ETH: Semi-deflationary model through EIP-1559 burn mechanism and PoS staking, with nearly 29% of supply currently staked
- ETH: No fixed supply cap, but reduced issuance through PoS and burning mechanism creates scarcity during high network usage
- 📌 Historical pattern: ETH's value increases following major protocol upgrades and increased network adoption
Institutional Adoption and Market Applications
- Institutional holdings: ETH ETFs have seen 14 consecutive weeks of net inflows totaling $19.2 billion, with BlackRock's ETHA fund alone holding approximately 1.5 million ETH
- Enterprise adoption: ETH serves as the foundation for stablecoins, DeFi protocols, and tokenized assets, processing trillions in transaction value annually
- Regulatory landscape: Increasing regulatory clarity around ETH, particularly with the GENIUS Stablecoin Act supporting Ethereum's role in the stablecoin ecosystem
Technical Development and Ecosystem Building
- ETH technical upgrades: The 2025 Pectra upgrade expanded validator limits and implemented account abstraction, while future upgrades will further improve scalability through rollups and danksharding
- Ecosystem comparison: Ethereum dominates DeFi with approximately $63 billion TVL, while also supporting NFTs, gaming, and decentralized applications with over 20 million monthly active users
- Layer-2 development: Significant progress in scaling solutions reducing gas fees by up to 75%, though this may also reduce main chain fee revenue
Macroeconomic Factors and Market Cycles
- Inflation hedge properties: ETH staking yields (4-6% annually) provide attractive returns in low interest rate environments
- Monetary policy impact: ETH typically outperforms during periods of monetary easing, with potential Fed rate cuts likely to support price growth
- Market sentiment: ETH's correlation with risk assets makes it susceptible to broader market volatility, though institutional adoption is providing greater stability
III. 2025-2030 Price Prediction: NCN vs ETH
Short-term Prediction (2025)
- NCN: Conservative $0.000074088 - $0.0001323 | Optimistic $0.0001323 - $0.000173313
- ETH: Conservative $2002.1064 - $3575.19 | Optimistic $3575.19 - $4790.7546
Mid-term Prediction (2027)
- NCN may enter a growth phase, with estimated price range $0.0000985296312 - $0.0002520084798
- ETH may enter a consolidation phase, with estimated price range $2283.48457857 - $5902.59221253
- Key drivers: Institutional capital inflow, ETF, ecosystem development
Long-term Prediction (2030)
- NCN: Base scenario $0.00028311556336 - $0.000317089430963 | Optimistic scenario $0.000317089430963+
- ETH: Base scenario $5924.9638987077825 - $8117.200541229662025 | Optimistic scenario $8117.200541229662025+
Disclaimer
NCN:
| 年份 | 预测最高价 | 预测平均价格 | 预测最低价 | 涨跌幅 |
|---|---|---|---|---|
| 2025 | 0.000173313 | 0.0001323 | 0.000074088 | 0 |
| 2026 | 0.00022615362 | 0.0001528065 | 0.000142110045 | 15 |
| 2027 | 0.0002520084798 | 0.00018948006 | 0.0000985296312 | 43 |
| 2028 | 0.000280345222773 | 0.0002207442699 | 0.000128031676542 | 66 |
| 2029 | 0.000315686380383 | 0.000250544746336 | 0.000147821400338 | 89 |
| 2030 | 0.000317089430963 | 0.00028311556336 | 0.000198180894352 | 113 |
ETH:
| 年份 | 预测最高价 | 预测平均价格 | 预测最低价 | 涨跌幅 |
|---|---|---|---|---|
| 2025 | 4790.7546 | 3575.19 | 2002.1064 | 0 |
| 2026 | 4433.950638 | 4182.9723 | 3471.867009 | 16 |
| 2027 | 5902.59221253 | 4308.461469 | 2283.48457857 | 20 |
| 2028 | 5667.13479324915 | 5105.526840765 | 2756.9844940131 | 42 |
| 2029 | 6463.59698040849 | 5386.330817007075 | 3554.9783392246695 | 50 |
| 2030 | 8117.200541229662025 | 5924.9638987077825 | 3673.47761719882515 | 65 |
IV. Investment Strategy Comparison: NCN vs ETH
Long-term vs Short-term Investment Strategies
- NCN: Suitable for investors focused on AI technology potential and emerging platforms
- ETH: Suitable for investors seeking established ecosystems, stability, and inflationary hedge properties
Risk Management and Asset Allocation
- Conservative investors: NCN: 5% vs ETH: 95%
- Aggressive investors: NCN: 20% vs ETH: 80%
- Hedging tools: Stablecoin allocation, options, cross-currency portfolios
V. Potential Risk Comparison
Market Risks
- NCN: High volatility, limited liquidity, and potential for rapid price swings
- ETH: Correlation with broader crypto market, susceptibility to macroeconomic factors
Technical Risks
- NCN: Scalability, network stability, and platform adoption
- ETH: Network congestion, gas fee fluctuations, potential smart contract vulnerabilities
Regulatory Risks
- Global regulatory policies may impact both differently, with ETH potentially facing more scrutiny due to its larger market presence
VI. Conclusion: Which Is the Better Buy?
📌 Investment Value Summary:
- NCN advantages: Emerging AI platform, potential for high growth, lower market cap
- ETH advantages: Established ecosystem, institutional adoption, deflationary mechanics
✅ Investment Advice:
- New investors: Consider allocating a majority to ETH for stability, with a small position in NCN for growth potential
- Experienced investors: Balanced portfolio with ETH as a core holding and NCN as a speculative play
- Institutional investors: Focus on ETH for its liquidity, regulatory clarity, and established market position
⚠️ Risk Warning: The cryptocurrency market is highly volatile, and this article does not constitute investment advice. None
VII. FAQ
Q1: What are the main differences between NCN and ETH in terms of investment potential? A: NCN is an emerging AI platform with high growth potential but higher volatility, while ETH is an established ecosystem with institutional adoption and more stability. NCN may offer higher returns but with greater risk, whereas ETH provides a more stable investment with steady growth potential.
Q2: How do the supply mechanisms of NCN and ETH compare? A: ETH has a semi-deflationary model with no fixed supply cap, utilizing a burn mechanism and Proof of Stake (PoS) staking. NCN's supply mechanism is not explicitly detailed in the given information. ETH's model creates scarcity during high network usage, potentially increasing its value over time.
Q3: Which cryptocurrency has seen more institutional adoption? A: Ethereum (ETH) has seen significantly more institutional adoption. ETH ETFs have experienced 14 consecutive weeks of net inflows totaling $19.2 billion, with major institutions like BlackRock holding substantial amounts. There's no comparable information provided for NCN's institutional adoption.
Q4: How do the current market prices and trading volumes of NCN and ETH compare? A: As of 2025-11-04, NCN's price is $0.0001323 with a 24-hour trading volume of $17,160.77, while ETH's price is $3,589.84 with a 24-hour trading volume of $822,378,757.42. ETH has a significantly higher price and trading volume compared to NCN.
Q5: What are the long-term price predictions for NCN and ETH by 2030? A: For NCN, the base scenario predicts a range of $0.00028311556336 - $0.000317089430963, with an optimistic scenario above $0.000317089430963. For ETH, the base scenario predicts a range of $5924.9638987077825 - $8117.200541229662025, with an optimistic scenario above $8117.200541229662025.
Q6: How should investors allocate their portfolio between NCN and ETH? A: Conservative investors might consider allocating 5% to NCN and 95% to ETH, while more aggressive investors might allocate 20% to NCN and 80% to ETH. The exact allocation depends on individual risk tolerance and investment goals.
Q7: What are the main risks associated with investing in NCN and ETH? A: For NCN, main risks include high volatility, limited liquidity, and potential scalability issues. For ETH, risks include correlation with the broader crypto market, network congestion, and potential regulatory scrutiny. Both face general market and regulatory risks associated with cryptocurrencies.
Share
Content
Introduction: NCN vs ETH Investment Comparison
I. Price History Comparison and Current Market Status
Key Factors Affecting ETH's Investment Value
III. 2025-2030 Price Prediction: NCN vs ETH
IV. Investment Strategy Comparison: NCN vs ETH
V. Potential Risk Comparison
VI. Conclusion: Which Is the Better Buy?
VII. FAQ

