


#ThreeMajorUSIndexesDecline
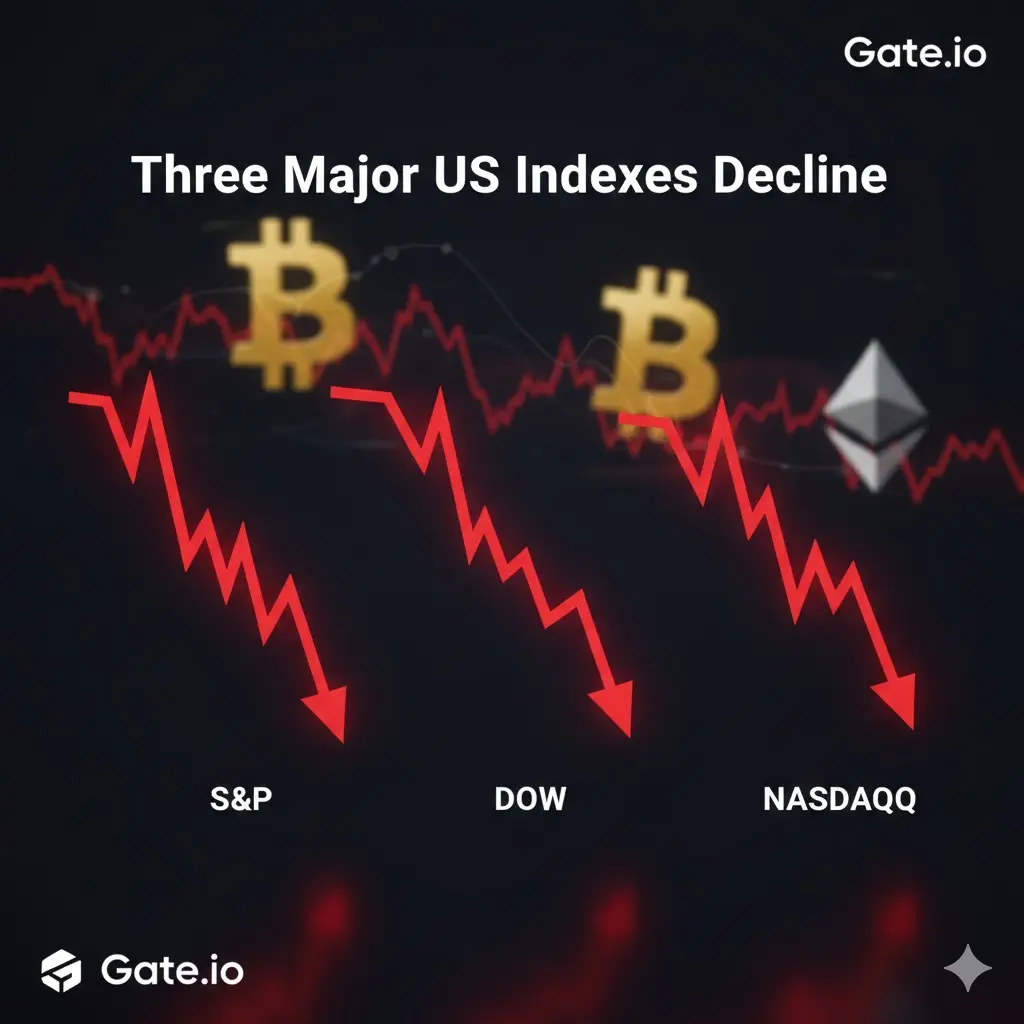
The three main U.S. stock market indexes — the Dow Jones Industrial Average (DJIA), S&P 500, and Nasdaq Composite — remain under pressure following Monday's sharp declines, with futures showing modest early recovery attempts on February 24, 2026 (as of midday UTC / evening PKT in Karachi). This broad pullback reflects ongoing investor caution amid tariff uncertainty, AI disruption fears, and risk-off sentiment spilling across equities and correlated assets like Bitcoin.
In simple terms: Stocks are down meaningfully in percentage terms, but liquidity remains robust with high trading volumes absorbing the selling — meaning the market isn't in panic mode yet, though volatility is elevated. Here's the fully extended breakdown including price levels, percentage changes, trading volumes, liquidity insights, and how everything ties together.
Latest Verified Market Snapshot (February 23 Close + February 24 Early Indications)
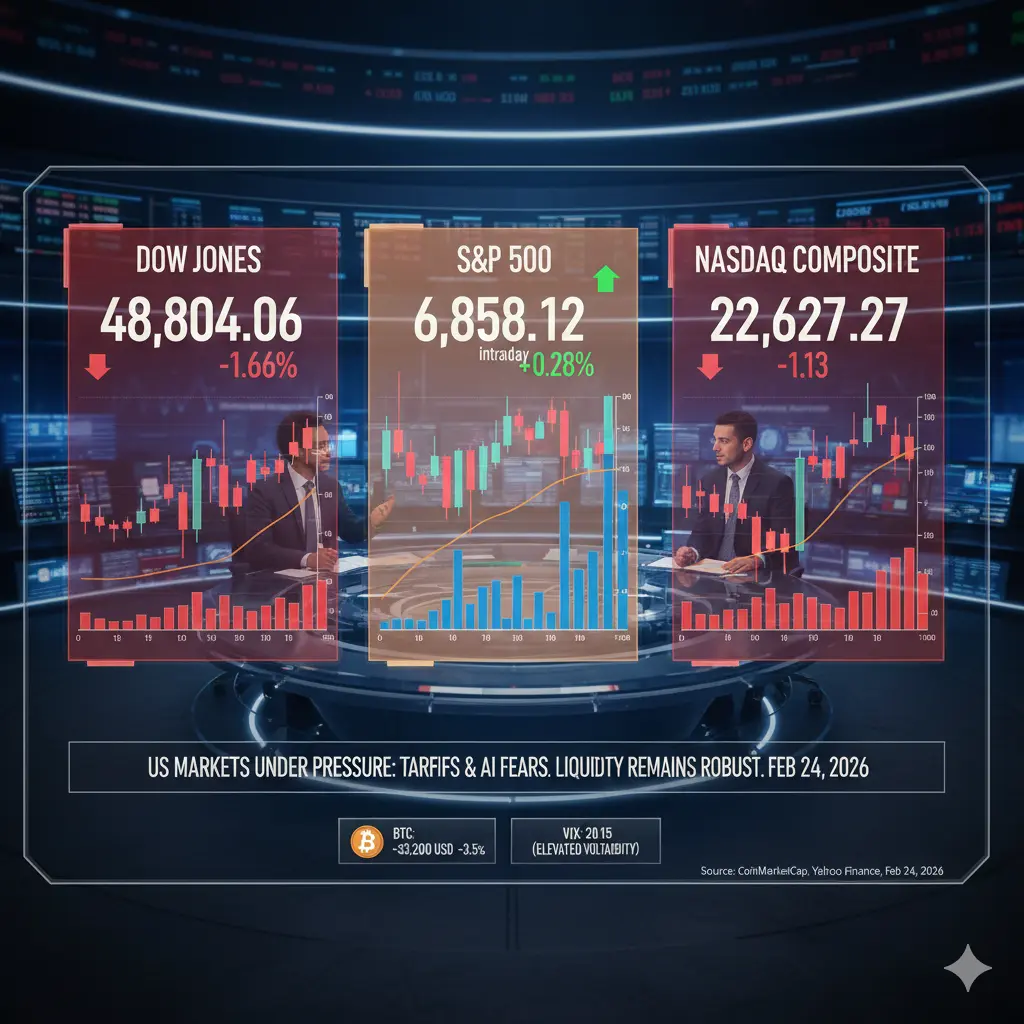
Dow Jones Industrial Average (DJIA): Closed at 48,804.06 on Feb 23 (down 821.91 points or -1.66% to -1.7%). This was a heavy drop, driven by industrials and financials hit by trade fears.
S&P 500: Closed at 6,837.75 on Feb 23 (down 71.76 points or -1.04%). Early Feb 24 indications show a slight bounce attempt (up ~0.25–0.34% in some trackers, around 6,854–6,861 levels intraday).
Nasdaq Composite: Closed at 22,627.27 on Feb 23 (down 258.80 points or -1.13%). Tech sector weakness amplified the move.
Trading Volumes (Feb 23 session): Elevated across the board, signaling active participation rather than thin selling.
S&P 500: Heavy volume (typical daily consolidated U.S. equities volume in the billions of shares; recent sessions saw ~3–5 billion shares traded market-wide, with notional value in tens of billions USD).
Nasdaq: Around 7 billion shares traded on Feb 23 (high for the index, reflecting tech selling).
Overall U.S. equities market: Consolidated volume exceeded 5–18 billion shares in recent days (e.g., matched + TRF volumes in the 5–9 billion range daily), with notional value traded in the hundreds of billions — deep liquidity absorbing large orders without extreme slippage.
Liquidity Insights:
High volumes indicate strong liquidity — plenty of buyers stepping in on dips, preventing a free-fall. The market can handle billions in daily turnover without major dislocations.
VIX (fear index) spiked (around 20+ levels recently), showing increased volatility but not extreme panic (VIX >30 would signal bigger stress).
Bid-ask spreads remain tight in major indexes/stocks, and order books are deep — classic sign that institutions/whales are active, not just retail fleeing.
Why the Percentage Drops? Quick Recap + Tie to Liquidity/Volume
The declines stem from the same catalysts:
Trump Tariff Flip-Flop: 15% temporary global tariffs announced/escalated → uncertainty spikes → risk-off selling. This hits importers/exporters hard, pressuring percentages across sectors.
AI Scare Trade: Software/payments/cyber stocks crushed (e.g., IBM -13%, CrowdStrike -10%, Visa/Mastercard -5–7%) → Nasdaq takes the biggest % hit as tech weighs ~40–50% of the index.
Broader Sentiment: After choppy policy environment, investors rotate defensive or reduce exposure → broad % drops, but high volume shows conviction in selling (not forced liquidations).
Bitcoin Tie-In (High Correlation ~60–70% with S&P/Nasdaq):
Current BTC Price: ~$63,000–$63,500 USD (down -3.2% to -3.9% in 24h from ~$65k–$68k levels earlier in the week; testing $62k–$63k support).
24h Trading Volume: $33–$45 billion USD (very healthy — often 500k+ BTC traded daily).
Market Cap: ~$1.26–$1.27 trillion USD.
Liquidity here is massive too — daily volume dwarfs miner sales (like Bitdeer's ~$60–70M move), so macro equity weakness drives the % drop more than anything crypto-specific.
Overall Market Health: Price % vs. Liquidity/Volume Perspective
Percentage Changes: Red across the board (-1% to -1.7% on Feb 23), but not catastrophic (e.g., no -5%+ crash days). This is a correction in a still-up YTD context for many indexes.
Volume & Liquidity: Strong — elevated turnover means the market is actively pricing in fears, with real buyers/sellers engaged. Low-volume drops would be more concerning (thin selling = potential for sharper reversals).
Implications: High liquidity + volume often cushions further downside and sets up bounces if headlines improve (e.g., tariff clarity or solid earnings from Nvidia/Salesforce this week). But persistent uncertainty could extend the % pain.
Bottom Line: This pullback shows real selling pressure in percentages, but deep liquidity and high volumes mean the market is handling it orderly — no signs of forced capitulation yet. It's a "wait-and-see" environment until big catalysts resolve.
The three main U.S. stock market indexes — the Dow Jones Industrial Average (DJIA), S&P 500, and Nasdaq Composite — remain under pressure following Monday's sharp declines, with futures showing modest early recovery attempts on February 24, 2026 (as of midday UTC / evening PKT in Karachi). This broad pullback reflects ongoing investor caution amid tariff uncertainty, AI disruption fears, and risk-off sentiment spilling across equities and correlated assets like Bitcoin.
In simple terms: Stocks are down meaningfully in percentage terms, but liquidity remains robust with high trading volumes absorbing the selling — meaning the market isn't in panic mode yet, though volatility is elevated. Here's the fully extended breakdown including price levels, percentage changes, trading volumes, liquidity insights, and how everything ties together.
Latest Verified Market Snapshot (February 23 Close + February 24 Early Indications)
Dow Jones Industrial Average (DJIA): Closed at 48,804.06 on Feb 23 (down 821.91 points or -1.66% to -1.7%). This was a heavy drop, driven by industrials and financials hit by trade fears.
S&P 500: Closed at 6,837.75 on Feb 23 (down 71.76 points or -1.04%). Early Feb 24 indications show a slight bounce attempt (up ~0.25–0.34% in some trackers, around 6,854–6,861 levels intraday).
Nasdaq Composite: Closed at 22,627.27 on Feb 23 (down 258.80 points or -1.13%). Tech sector weakness amplified the move.
Trading Volumes (Feb 23 session): Elevated across the board, signaling active participation rather than thin selling.
S&P 500: Heavy volume (typical daily consolidated U.S. equities volume in the billions of shares; recent sessions saw ~3–5 billion shares traded market-wide, with notional value in tens of billions USD).
Nasdaq: Around 7 billion shares traded on Feb 23 (high for the index, reflecting tech selling).
Overall U.S. equities market: Consolidated volume exceeded 5–18 billion shares in recent days (e.g., matched + TRF volumes in the 5–9 billion range daily), with notional value traded in the hundreds of billions — deep liquidity absorbing large orders without extreme slippage.
Liquidity Insights:
High volumes indicate strong liquidity — plenty of buyers stepping in on dips, preventing a free-fall. The market can handle billions in daily turnover without major dislocations.
VIX (fear index) spiked (around 20+ levels recently), showing increased volatility but not extreme panic (VIX >30 would signal bigger stress).
Bid-ask spreads remain tight in major indexes/stocks, and order books are deep — classic sign that institutions/whales are active, not just retail fleeing.
Why the Percentage Drops? Quick Recap + Tie to Liquidity/Volume
The declines stem from the same catalysts:
Trump Tariff Flip-Flop: 15% temporary global tariffs announced/escalated → uncertainty spikes → risk-off selling. This hits importers/exporters hard, pressuring percentages across sectors.
AI Scare Trade: Software/payments/cyber stocks crushed (e.g., IBM -13%, CrowdStrike -10%, Visa/Mastercard -5–7%) → Nasdaq takes the biggest % hit as tech weighs ~40–50% of the index.
Broader Sentiment: After choppy policy environment, investors rotate defensive or reduce exposure → broad % drops, but high volume shows conviction in selling (not forced liquidations).
Bitcoin Tie-In (High Correlation ~60–70% with S&P/Nasdaq):
Current BTC Price: ~$63,000–$63,500 USD (down -3.2% to -3.9% in 24h from ~$65k–$68k levels earlier in the week; testing $62k–$63k support).
24h Trading Volume: $33–$45 billion USD (very healthy — often 500k+ BTC traded daily).
Market Cap: ~$1.26–$1.27 trillion USD.
Liquidity here is massive too — daily volume dwarfs miner sales (like Bitdeer's ~$60–70M move), so macro equity weakness drives the % drop more than anything crypto-specific.
Overall Market Health: Price % vs. Liquidity/Volume Perspective
Percentage Changes: Red across the board (-1% to -1.7% on Feb 23), but not catastrophic (e.g., no -5%+ crash days). This is a correction in a still-up YTD context for many indexes.
Volume & Liquidity: Strong — elevated turnover means the market is actively pricing in fears, with real buyers/sellers engaged. Low-volume drops would be more concerning (thin selling = potential for sharper reversals).
Implications: High liquidity + volume often cushions further downside and sets up bounces if headlines improve (e.g., tariff clarity or solid earnings from Nvidia/Salesforce this week). But persistent uncertainty could extend the % pain.
Bottom Line: This pullback shows real selling pressure in percentages, but deep liquidity and high volumes mean the market is handling it orderly — no signs of forced capitulation yet. It's a "wait-and-see" environment until big catalysts resolve.