
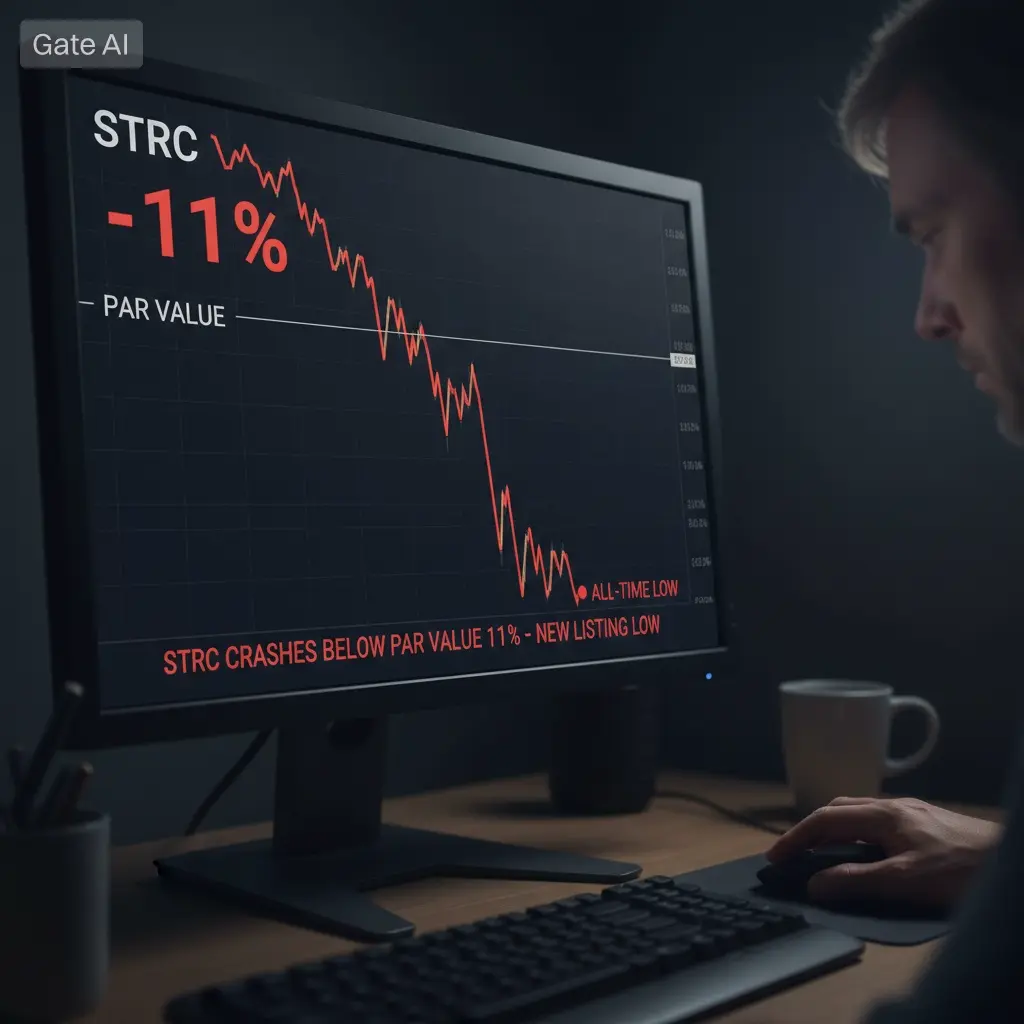
#STRC跌破面值11%創上市新低
STRC’s Decline Below Par Value Signals a Critical Test for Yield-Based Crypto Structures
Financial markets often reveal hidden weaknesses during periods of uncertainty. The recent performance of STRC has become a prime example of this phenomenon. After falling below its intended $100 par value and extending losses to approximately 11% from face value, STRC has reached its lowest level since launch. While some investors may view this simply as a temporary price decline, the move raises much larger questions about how structured yield products perform when market conditions become challenging.
STRC was designed differently from traditional equities. Rather than focusing primarily on growth, its structure emphasizes income generation while attempting to maintain stability around a predetermined valuation level. The concept combines attractive yield opportunities with mechanisms intended to support long-term price stability, creating an investment product that appeals to income-focused participants seeking exposure to the digital asset ecosystem.
The recent breakdown below the $100 level suggests that market forces are beginning to challenge the assumptions behind that model.
One of the most important factors influencing the decline is the broader weakness across crypto markets. Bitcoin remains the primary liquidity driver for the digital asset industry, and when Bitcoin enters a period of reduced momentum or heightened uncertainty, investor appetite for risk-sensitive products typically declines. Yield-oriented structures often experience amplified reactions because their attractiveness depends not only on returns but also on confidence in the sustainability of those returns.
Another major concern revolves around liquidity conditions and balance sheet expectations. Investors increasingly evaluate structured products through the lens of financial flexibility. Market participants want reassurance that issuers possess sufficient resources to maintain distributions, manage capital efficiently, and support stability mechanisms during periods of stress. When uncertainty develops around these factors, even small concerns can create disproportionate price movements as risk premiums expand.
Perhaps the most significant issue, however, is the market's perception of the $100 stability framework itself.
The effectiveness of any price-support mechanism depends heavily on credibility. Investors must believe that management tools, dividend policies, and structural adjustments are capable of maintaining confidence during adverse conditions. Once an asset falls meaningfully below its intended anchor level, attention shifts from yield generation toward structural resilience.
This creates a feedback loop. Lower prices can weaken confidence, reduced confidence can encourage selling pressure, and additional selling pressure can drive prices even further from their intended valuation range. In many cases, psychological factors become just as important as financial fundamentals.
The broader implications extend well beyond STRC alone.
The current situation represents a real-world stress test for an emerging category of crypto-linked yield products. Investors across the market are closely watching whether these structures can preserve stability during prolonged periods of risk aversion, declining liquidity, and shifting macroeconomic conditions.
Several important questions are now being evaluated:
Can issuer-managed frameworks effectively stabilize prices during sustained market stress?
Will investors continue allocating capital toward high-yield structured instruments if price volatility increases?
How should risk be priced when stability mechanisms are tested under unfavorable conditions?
The answers to these questions could influence future demand for similar products throughout the digital asset sector.
Looking ahead, three developments will likely determine the next phase for STRC.
First, investors will monitor whether management adopts more aggressive dividend or distribution adjustments to strengthen confidence and improve market positioning.
Second, overall liquidity conditions across major cryptocurrencies will remain crucial. A recovery in Bitcoin and broader digital asset markets could help restore investor appetite for yield-focused products.
Third, reclaiming the psychologically important $100 level would serve as a meaningful signal that confidence in the structure is recovering. Failure to regain that level, however, may encourage further reassessment of valuation assumptions across the market.
Ultimately, STRC's decline below par value represents more than a simple price movement. It highlights the delicate relationship between yield, confidence, liquidity, and structural design. Markets are now testing whether stability-focused crypto instruments can maintain their intended characteristics when investor sentiment turns defensive.
The coming weeks may provide one of the clearest indicators yet of how resilient these new financial structures truly are under real market pressure.
#MyGateTradeStory @Gate_Square #STRC #GateSquare