Trade
Trading Type
Spot
Trade crypto freely
Alpha
Points
Get promising tokens in streamlined on-chain trading
Pre-Market
Trade new tokens before they are officially listed
Margin
Magnify your profit with leverage
Convert & Block Trading
0 Fees
Trade any size with no fees and no slippage
Leveraged Tokens
Get exposure to leveraged positions simply
Futures
Futures
Hundreds of contracts settled in USDT or BTC
Options
HOT
Trade European-style vanilla options
Unified Account
Maximize your capital efficiency
Demo Trading
Futures Kickoff
Get prepared for your futures trading
Futures Events
Participate in events to win generous rewards
Demo Trading
Use virtual funds to experience risk-free trading
Earn
Launch
CandyDrop
Collect candies to earn airdrops
Launchpool
Quick staking, earn potential new tokens
HODLer Airdrop
Hold GT and get massive airdrops for free
Launchpad
Be early to the next big token project
Alpha Points
NEW
Trade on-chain assets and enjoy airdrop rewards!
Futures Points
NEW
Earn futures points and claim airdrop rewards
Investment
Simple Earn
Earn interests with idle tokens
Auto-Invest
Auto-invest on a regular basis
Dual Investment
Buy low and sell high to take profits from price fluctuations
Soft Staking
Earn rewards with flexible staking
Crypto Loan
0 Fees
Pledge one crypto to borrow another
Lending Center
One-stop lending hub
VIP Wealth Hub
Customized wealth management empowers your assets growth
Private Wealth Management
Customized asset management to grow your digital assets
Quant Fund
Top asset management team helps you profit without hassle
Staking
Stake cryptos to earn in PoS products
BTC Staking
HOT
Stake BTC and earn 10% APR
GUSD Minting
Use USDT/USDC to mint GUSD for treasury-level yields
More
US Economy Roars Back with Strong Q3 GDP Growth — What This Means for Bitcoin and Crypto?
1h ago
Stellar (XLM) To Bounce Back? Key Harmonic Pattern Hints at Potential Upside Move
4h ago
Trending Topics
View More82.52K Popularity
36.38K Popularity
18.69K Popularity
6.12K Popularity
3.75K Popularity
Hot Gate Fun
View More- MC:$0.1Holders:10.00%
- MC:$3.56KHolders:20.09%
- MC:$3.49KHolders:10.00%
- MC:$3.5KHolders:10.00%
- MC:$3.49KHolders:10.00%
Pin
🎉 Share Your 2025 Year-End Summary & Win $10,000 Sharing Rewards!
Reflect on your year with Gate and share your report on Square for a chance to win $10,000!
👇 How to Join:
1️⃣ Click to check your Year-End Summary: https://www.gate.com/competition/your-year-in-review-2025
2️⃣ After viewing, share it on social media or Gate Square using the "Share" button
3️⃣ Invite friends to like, comment, and share. More interactions, higher chances of winning!
🎁 Generous Prizes:
1️⃣ Daily Lucky Winner: 1 winner per day gets $30 GT, a branded hoodie, and a Gate × Red Bull tumbler
2️⃣ Lucky Share Draw: 10🔥 Gate Square Event | #PostToWinLaunchpadKDK 🔥
KDK | The latest Gate Launchpad spotlight token
Before: stake USDT to join
Now 👉 just post for a chance to win KDK!
🎁 Gate Square exclusive: 2,000 KDK total rewards up for grabs
🚀 Launchpad star project — big potential ahead 👀
📅 Event Duration
Dec 19, 04:00 – Dec 30, 16:00 (UTC)
📌 How to Join
Post on Gate Square (text, images, analysis, or opinions)
Content should relate to KDK price predictions at launch, project insights, or your understanding of the Gate Launchpad mechanism
Add one hashtag: #发帖赢Launchpad新币KDK 或 #PostToWinLaunchpadKDK
�🎨 Gate AI Creation Contest | One Sentence, Draw Your 2026
On Gate Square, anyone can be a visual creator — truly zero barriers to entry.
With just one sentence, generate an image and bring your vision of 2026 to life.
Create and post your work using Gate Square AI Creation for a chance to win the Gate Year of the Horse New Year Gift Box.
📅 Duration
Dec 17, 2025, 10:00 – Jan 3, 2026, 18:00 UTC
🎯 How to Join
1. Go to Gate Square → Create Post → AI Creation
2. Enter one sentence to generate your image
3. Post with #GateAICreation
🏆 Rewards
5 winners: Gate Year of the Horse New Year
Gold Smashes New All-Time High: Why Bitcoin (BTC) Could Be Next?
While gold dominates the headlines, seasoned analysts are looking at a different chart: The Bitcoin-to-Gold Fractal. Historically, Bitcoin doesn’t move with gold—it follows it with a strategic delay.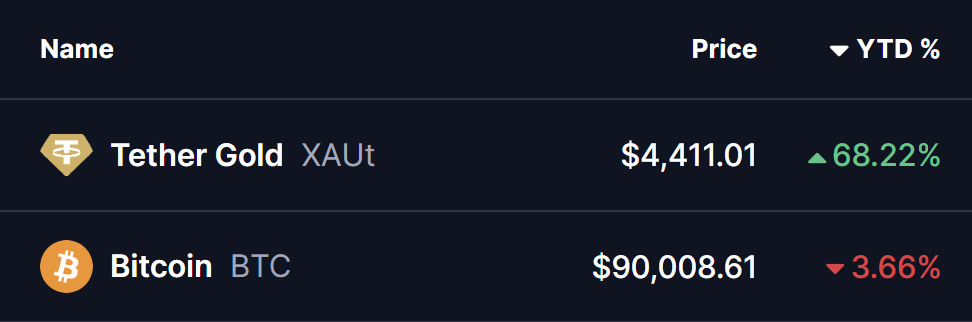
Source: Coinmarketcap
Historical Gold Fractal Hints at Bullish Potential The latest analysis shared by crypto analyst @Osemka8 highlights how Bitcoin’s current price action closely mirrors the structure that played out for gold during the 1970s. Back then, gold experienced a strong initial rally, followed by a multi-year consolidation phase that frustrated investors and created doubts about further upside. That pause ultimately proved to be a launchpad, as gold later entered a parabolic expansion phase that redefined its valuation for decades. When overlaying Bitcoin’s long-term chart against gold’s historical fractal, the similarities become difficult to ignore. Bitcoin’s rise from its early-cycle lows mirrors gold’s initial breakout phase, while the current multi-month consolidation near the $85,000–$90,000 range closely aligns with gold’s mid-cycle pause before its next leg higher.
BTC-GOLD Fractal Chart/Credits: @Osemka8 (X)
The chart suggests that Bitcoin is not breaking down — it is digesting gains, much like gold did before its historic surge. Bitcoin’s Consolidation May Be Strength, Not Weakness Despite gold stealing the spotlight, Bitcoin has quietly maintained a higher-timeframe structure of higher highs and higher lows. The recent correction from the $120,000 region appears more consistent with a macro reset than a trend reversal. Much like gold in the 1970s, Bitcoin’s current range-bound behavior may be acting as a transfer of supply from short-term traders to longer-term holders. This phase often feels slow and unconvincing, but historically, it has preceded some of Bitcoin’s strongest expansion moves. Another key similarity lies in relative underperformance. In past cycles, Bitcoin has often lagged traditional hedges during periods of macro uncertainty, only to later outperform them once confidence returns and liquidity expands. What’s Next for BTC? If the gold-to-Bitcoin fractal continues to play out, Bitcoin’s current consolidation could represent the final base before a renewed upside phase. A sustained break above the upper consolidation range would likely shift sentiment rapidly, opening the door for a broader trend continuation toward new highs. That said, fractals are not guarantees. They serve as historical context rather than precise forecasts. Timing, macro liquidity conditions, and investor sentiment will all play critical roles in determining whether Bitcoin follows gold’s historic footsteps. For now, the chart delivers a clear message: gold has already moved — and Bitcoin may simply be next in line. Disclaimer: The views and analysis presented in this article are for informational purposes only and reflect the author’s perspective, not financial advice. Technical patterns and indicators discussed are subject to market volatility and may or may not yield the anticipated results. Investors are advised to exercise caution, conduct independent research, and make decisions aligned with their individual risk tolerance.