Post content & earn content mining yield
placeholder
gatefun
gatefun
The 2026 Crypto Pivot: From Hype to Infrastructure
As of March 2026, the "Wild West" era of cryptocurrency has officially transitioned into a sophisticated institutional asset class. While Bitcoin recently faced a structural test at the $72,000 resistance level, the narrative has shifted from mere price speculation to real-world utility.
The headlines are now dominated by two major forces: AI integration and regulatory clarity. Autonomous AI agents are becoming primary users of DeFi protocols, executing complex trades and managing liquidity 24/7. Simultaneously, the U.S. CLARITY Act is providi
BTC-1.26%
DEFI-1%
post-image
post-image
  • Reward
  • Comment
  • Repost
  • Share
#PI 2026 will be the AI year for the Pi Network. The latest paper indicates that once Pi Network becomes AI-enabled, it will have the computing power equivalent to two NVIDIA's output. Internet companies will purchase Pi Network's AI computing power. The market capitalization of Pi Network will be at least ten trillion dollars.
PI12.36%
View Original
post-image
  • Reward
  • 1
  • Repost
  • Share
Musk777vip:
Wishing you great wealth in the Year of the Horse 🐴
The upward momentum $PI remains strong. Today, let's stand on the shoulders of the giant at 0.26 first.
PI12.36%
View Original
post-image
  • Reward
  • 1
  • Repost
  • Share
GateUser-2216933fvip:
2026 Go Go Go 👊
Lucky
Lucky
Coin
gatefun
Created By@PROTRAYDER
Listing Progress
0.00%
MC:
$2.41K
More Tokens
Trump urges speedy passage of CLARITY Act, criticizes big banks for hindering crypto markets
gate liveLIVE
932
live-coin
  • Reward
  • 2
  • Repost
  • Share
Sakura_3434vip:
2026 GOGOGO 👊
View More
$HANA Signal】Buy on Pullback! 1H level retraces to EMA50 support, clear signs of main force defending the market
$HANA After experiencing a massive surge, the 1H level is currently in a healthy correction and consolidation phase. The current price hovers around 0.0396, and the 1-hour RSI has fallen from overbought levels to a neutral zone, indicating selling pressure is easing. The key point is that the 1-hour EMA50 (around 0.0387) and the 4-hour EMA20 (around 0.0374) form a double support zone, with open interest remaining stable and no significant fund outflows, suggesting that the main f
HANA13.69%
BTC-1.26%
ETH-0.46%
SOL-1.87%
View Original
post-image
  • Reward
  • Comment
  • Repost
  • Share
Premium and premium + accounts, where ya’ll at?
post-image
  • Reward
  • Comment
  • Repost
  • Share
💕Celebrated every year on March 8th, International Women's Day is not just a day for greetings or gifts, but a meaningful day rooted in a deep-seated struggle for rights and equality. This special day, echoing on social media with the hashtag #HappyInternationalWomens, celebrates women's social, economic, political, and cultural achievements while also reminding us of the distance still to be covered on the path to gender equality.
💖Following this event, women's rights advocate Clara Zetkin proposed at the International Socialist Women's Conference in Copenhagen in 1910 that March 8th be c
post-image
  • Reward
  • Comment
  • Repost
  • Share
Iran’s oil depot and refinery in Tehran was just hit by U.S./Israel airstrikes and has been completely destroyed.
post-image
  • Reward
  • Comment
  • Repost
  • Share
$BTC Signal】Pullback to Long! 1H Oversold Rebound, Clear Signs of Main Force Supporting the Market
$BTC The 1H timeframe found support around 67,000 and formed a bullish rebound candle. RSI has entered the oversold zone, indicating short-term selling pressure is easing. Although the 4H level broke below the short-term moving average, open interest remains stable, with no signs of panic selling. Combined with negative funding rates, the risk of short squeeze is building. The current price has entered an optimized entry zone, making it a good opportunity for a short-term rebound.
🎯Direction: L
BTC-1.26%
ETH-0.46%
SOL-1.87%
View Original
post-image
  • Reward
  • Comment
  • Repost
  • Share
If I had bought PETROLEUM 10 days ago, I would have outperformed everyone who had Ethereum over the past 8 years.🤣
View Original
post-image
  • Reward
  • Comment
  • Repost
  • Share
In about 2 days, the total mined supply of $BTC will hit 20 million. That means only 1 million Bitcoin remain to be mined — and at the current schedule, it will take around 114 years to mine the rest. true scarcity in action.#CryptoMarketsDipSlightly $BTC
BTC-1.26%
post-image
  • Reward
  • Comment
  • Repost
  • Share
$LYN Signal】Pullback to add longs! 1H retracing EMA20 support, 4H trend unchanged
$LYN On the 1H timeframe, the price is retracing the key EMA20 support, oscillating around 0.321. On the 4H timeframe, a massive bullish candle yesterday established strong momentum, currently in a healthy pullback phase, with trading volume remaining stable and no signs of major institutional exit. The 1H RSI is approaching neutral, building momentum for another rally. The order book shows selling pressure concentrated above 0.322, while buy orders around 0.3215 are deep and solid, forming short-term support.
BTC-1.26%
ETH-0.46%
SOL-1.87%
View Original
post-image
  • Reward
  • Comment
  • Repost
  • Share
web4.0
web4.0
web4.0
gatekol
Created By@GoWithTheFlow
Subscription Progress
0.00%
MC:
$0
More Tokens
💥Immediately following the data release, Bitcoin dropped below the psychological level of $70,000, falling as low as the $68,700-$69,000 range on some exchanges. This movement mirrored a general sell-off in stocks and risky assets. Investors shifted to "risk-off" positions as the weak employment data was interpreted as a recession signal. Oil prices rising above $90 due to tensions with Iran fueled stagflation fears, while the short-term strengthening of the dollar put pressure on BTC. However, this decline was limited; Bitcoin recovered during the day, trading near $70,000, and the total cap
BTC-1.26%
post-image
post-image
post-image
User_anyvip
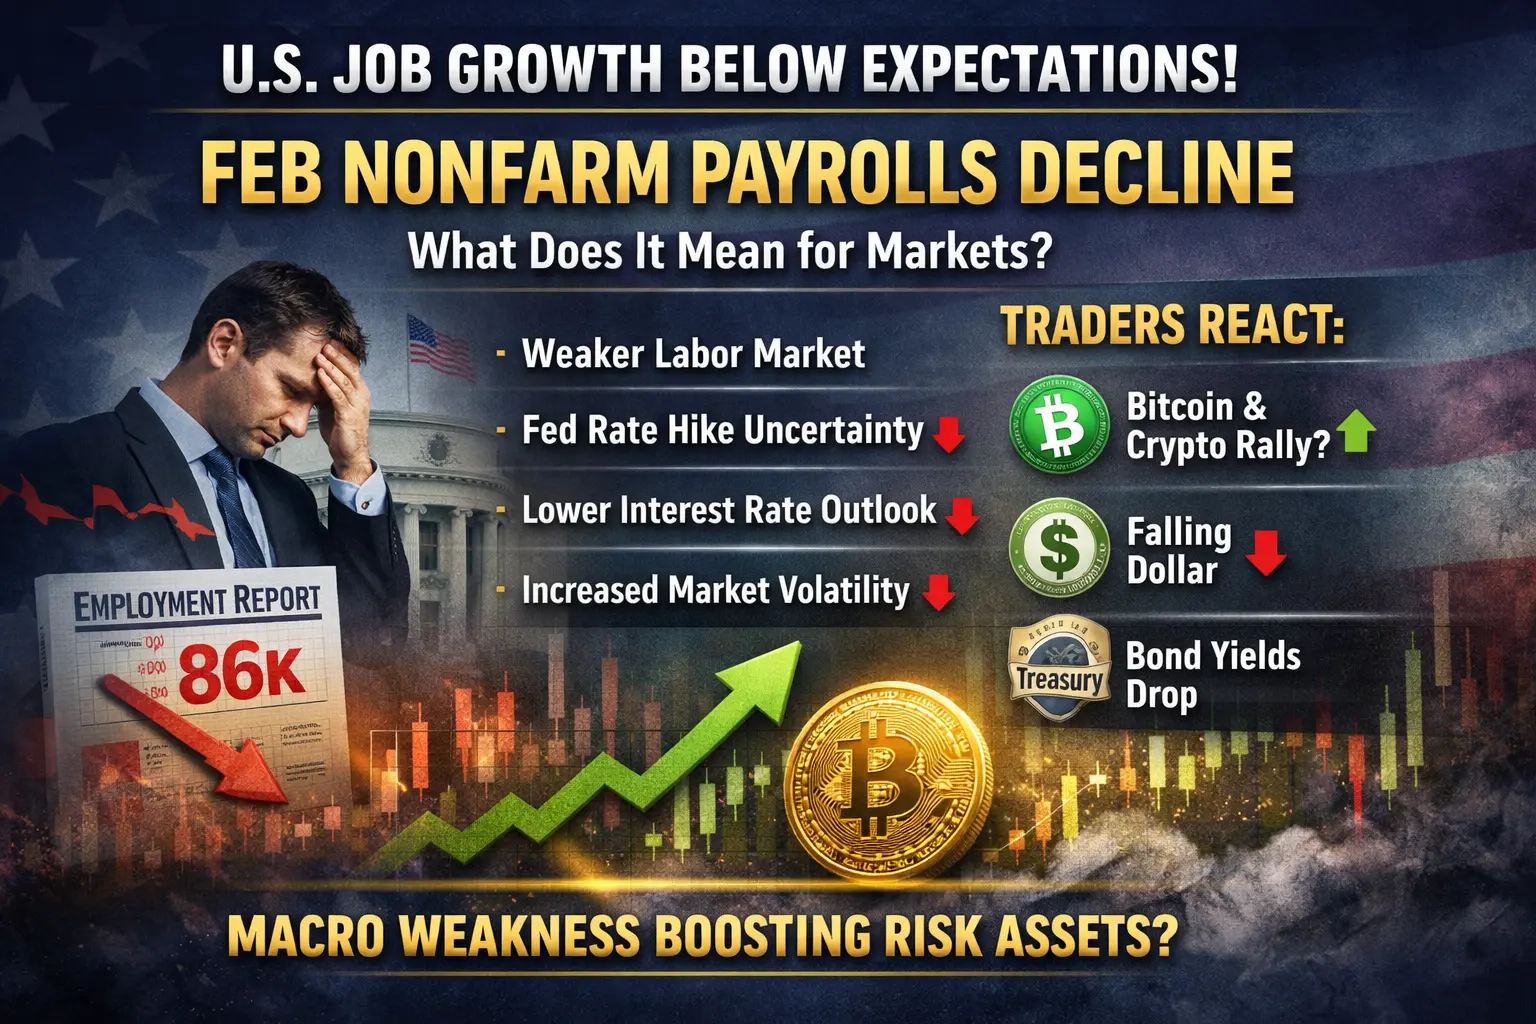
💥One of the most critical indicators of the US economy, nonfarm payrolls data, came as a major surprise with the February 2026 report released on March 6, 2026. According to data published by the US Bureau of Labor Statistics (BLS), total nonfarm employment decreased by 92,000 people in February. Economists had expected an increase of approximately 50-60,000 people. This unexpected decline, combined with the rise in the unemployment rate from 4.3% to 4.4%, strengthened signals of a cooling in the American labor market and resonated across a wide spectrum, from Wall Street to the Fed.
💥This decline is not just a one-month data point; it also represents a continuation of the weak trend that has been ongoing since the last quarter of 2025. The January 2026 data was revised downwards from 130,000 to 126,000, while the increase in December 2025 was also pulled into negative territory. Thus, the end of 2025 paints a much more fragile picture than previously thought. The healthcare sector, which has long been a driving force behind job growth, suffered a net loss in February due to strike activities. The nurses' strike in California, in particular, directly impacted employment in the sector. Construction and transportation/storage sectors were also hit by harsh winter weather conditions. Information technology and the federal government were already on a downward trend.
⏬Markets reacted immediately to this data. On Friday, the day the report was released, the Dow Jones index lost between 1.2% and 1.9%, while the S&P 500 and Nasdaq experienced similar losses. Bond yields initially fell but later recovered; the dollar showed mixed performance. Investors are concerned that this weak employment picture will fuel recession fears.
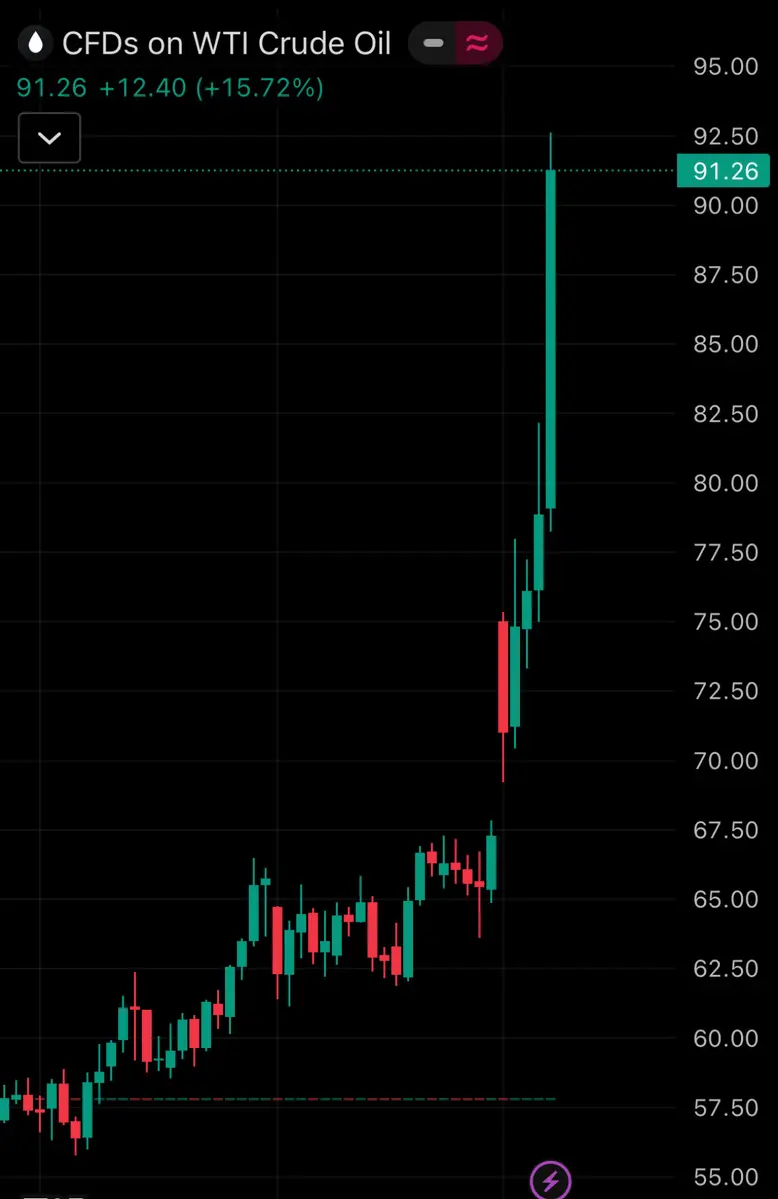
☝️Especially with the tensions in the Middle East stemming from Iran, and oil prices exceeding $91, stagflation scenarios have been brought back to the forefront. On the one hand, unemployment is rising, and on the other hand, energy costs are increasing; This dilemma is putting the Fed in a difficult position.
🔎From an analytical perspective, the February report seriously undermines hopes for a "soft landing." The labor market, which has been sustained by the health and social welfare sectors throughout 2025, is now showing broad-based weakness. Although average hourly earnings increased by 0.4% monthly to $37.32, this increase, while consistent with the inflation target, is outweighed by the psychological impact of job losses. Uncertainty regarding the Fed's interest rate policy has deepened: On the one hand, weak employment data fuels expectations of an early rate cut, while on the other hand, the oil shock could reignite inflation. Analysts state that the Fed will maintain its "data-dependent" stance, but this report increases the likelihood of a possible rate cut in June 2026.
Globally, the impact was felt immediately. European and Asian stock markets also opened negatively, while emerging markets were under pressure due to the strengthening dollar. For energy-importing countries like Turkey, the rise in oil prices poses additional risks in terms of both inflation and current account deficit. Investors will now be closely watching the March and April reports; while a single bad month may not necessarily mean a trend reversal, consecutive revisions and sector-specific losses are sounding the alarm. As a result, this data, circulating under the hashtag ✍️#FebNonfarmPayrollsUnexpectedlyFall, has put the first quarter of 2026 in a "wait and see" mode. While the US economy still has a strong foundation, this unexpected drop in employment sends a clear message to policymakers and investors: the labor market is cooling, and this cooling could reshape both domestic and global economic balances. The next report will show whether this decline is a temporary weather event and strike effect, or the beginning of a deeper slowdown. For now, uncertainty remains the biggest enemy of the markets.
repost-content-media
  • Reward
  • Comment
  • Repost
  • Share
Guess who round tripped generational wealth again
post-image
  • Reward
  • Comment
  • Repost
  • Share
#FebNonfarmPayrollsUnexpectedlyFall
📉 Surprising US labor market: job growth slows below expectations
Recent economic data in the United States has surprised global markets. The non-farm payrolls (NFP) report came in below market expectations, indicating that the pace of job creation in the US may be slowing down.
Since the labor market is one of the most important indicators for Federal Reserve monetary policy, this unexpected decline quickly drew the attention of investors across stock, bond, and digital asset markets.
📊 Why labor market data is very important
The non-farm payrolls
View Original
post-image
Usmanali140793vip
#FebNonfarmPayrollsUnexpectedlyFall
📉 U.S. Nonfarm Payrolls Shock Markets: Job Growth Falls Below Expectations
The latest U.S. economic data has delivered a surprise to global markets. The Nonfarm Payrolls (NFP) report came in below market expectations, signaling that the pace of job creation in the United States may be slowing.
Since the labor market is one of the most important indicators for the Federal Reserve’s monetary policy, this unexpected decline has quickly attracted the attention of investors across stocks, bonds, and crypto markets.
📊 Why the Labor Market Data Is So Important
The Nonfarm Payrolls report measures the number of new jobs added to the U.S. economy each month. It is widely considered one of the most powerful indicators of economic strength.
A weaker-than-expected report can indicate:
• Slowing economic growth
• Cooling inflation pressures
• A potential shift in interest rate expectations
If the labor market begins to lose momentum, the Federal Reserve may become less aggressive with interest rate hikes, which could increase liquidity across financial markets.
💰 Possible Impact on Bitcoin and Crypto
Crypto markets have become increasingly sensitive to macroeconomic developments. When economic data suggests that interest rates may stabilize or decline, investors often increase their exposure to risk assets such as Bitcoin and altcoins.
Lower interest rate expectations generally lead to:
• Increased market liquidity
• Reduced pressure on risk assets
• Stronger appetite for speculative investments
Because of this dynamic, some traders view weaker labor data as potentially bullish for the crypto market in the medium term.
📈 What Traders Should Watch Next
Following the NFP release, market participants are closely watching several indicators that could shape the next trend:
• Federal Reserve policy expectations
• U.S. Treasury yield movements
• U.S. Dollar strength
• Bitcoin market volatility
If the dollar weakens and liquidity expectations increase, crypto markets may see renewed momentum.
🧠 Market Perspective
While short-term volatility is common after major economic releases, experienced traders understand that macroeconomic trends often create the largest opportunities in financial markets.
The unexpected decline in Nonfarm Payrolls could become an important signal that the global financial environment is shifting.
📊 Do you think weaker U.S. employment data will support the next crypto rally?
#FebNonfarmPayrollsUnexpectedlyFall
repost-content-media
  • Reward
  • 4
  • Repost
  • Share
Moathalmahdivip:
Atmosphere 1000x coming 🤑
View More
Weekend Market Analysis And BTC ETH Prediction
gate liveLIVE
298
  • Reward
  • Comment
  • Repost
  • Share
They called it risky.
I call it research. 🎯
3 locks. 1 slip. 9,225 USDT waiting on the other side.
The data doesn’t lie Chelsea, City & Arsenal don’t either.
Watch me win this
post-image
  • Reward
  • Comment
  • Repost
  • Share
Almost every time a select gang of rogues are on the wrong side of history, for the simple reason that; their current reality (of $WKC) and stomach infrastructure always determines their opinion, what they support n the functionality of their brain.
Too many “poor” “rich” folks in CTNG 😪
WKC0.75%
post-image
  • Reward
  • Comment
  • Repost
  • Share
3.8 Sunday Bitcoin Morning Market Analysis
Last night, the market sharply declined from above 68,000, with the lowest touching around 66,880, a drop of over a thousand points in a single day.
Currently, the price has slightly rebounded to the 67,300 range, entering a correction phase after the sharp decline.
From a technical perspective, the middle band of the Bollinger Bands at 67,540 acts as short-term resistance, with the price trading below it, indicating a weak trend; the lower band at 67,023 provides recent support, while the upper band at 68,057 is a key resistance level for the rebound
BTC-1.26%
View Original
post-image
  • Reward
  • Comment
  • Repost
  • Share
TAO is a great buy point, selling it is really...
Sigh! What a lesson.
TAO-1.24%
View Original
post-image
[The user has shared his/her trading data. Go to the App to view more.]
  • Reward
  • Comment
  • Repost
  • Share
Load More

Join 40M users in our growing community

⚡️ Join 40M users in the crypto craze discussion
💬 Engage with your favorite top creators
👍 See what interests you
  • Pin