#MyGateTradeStory
#BTC
Comprehensive Bitcoin (BTC) Market Analysis
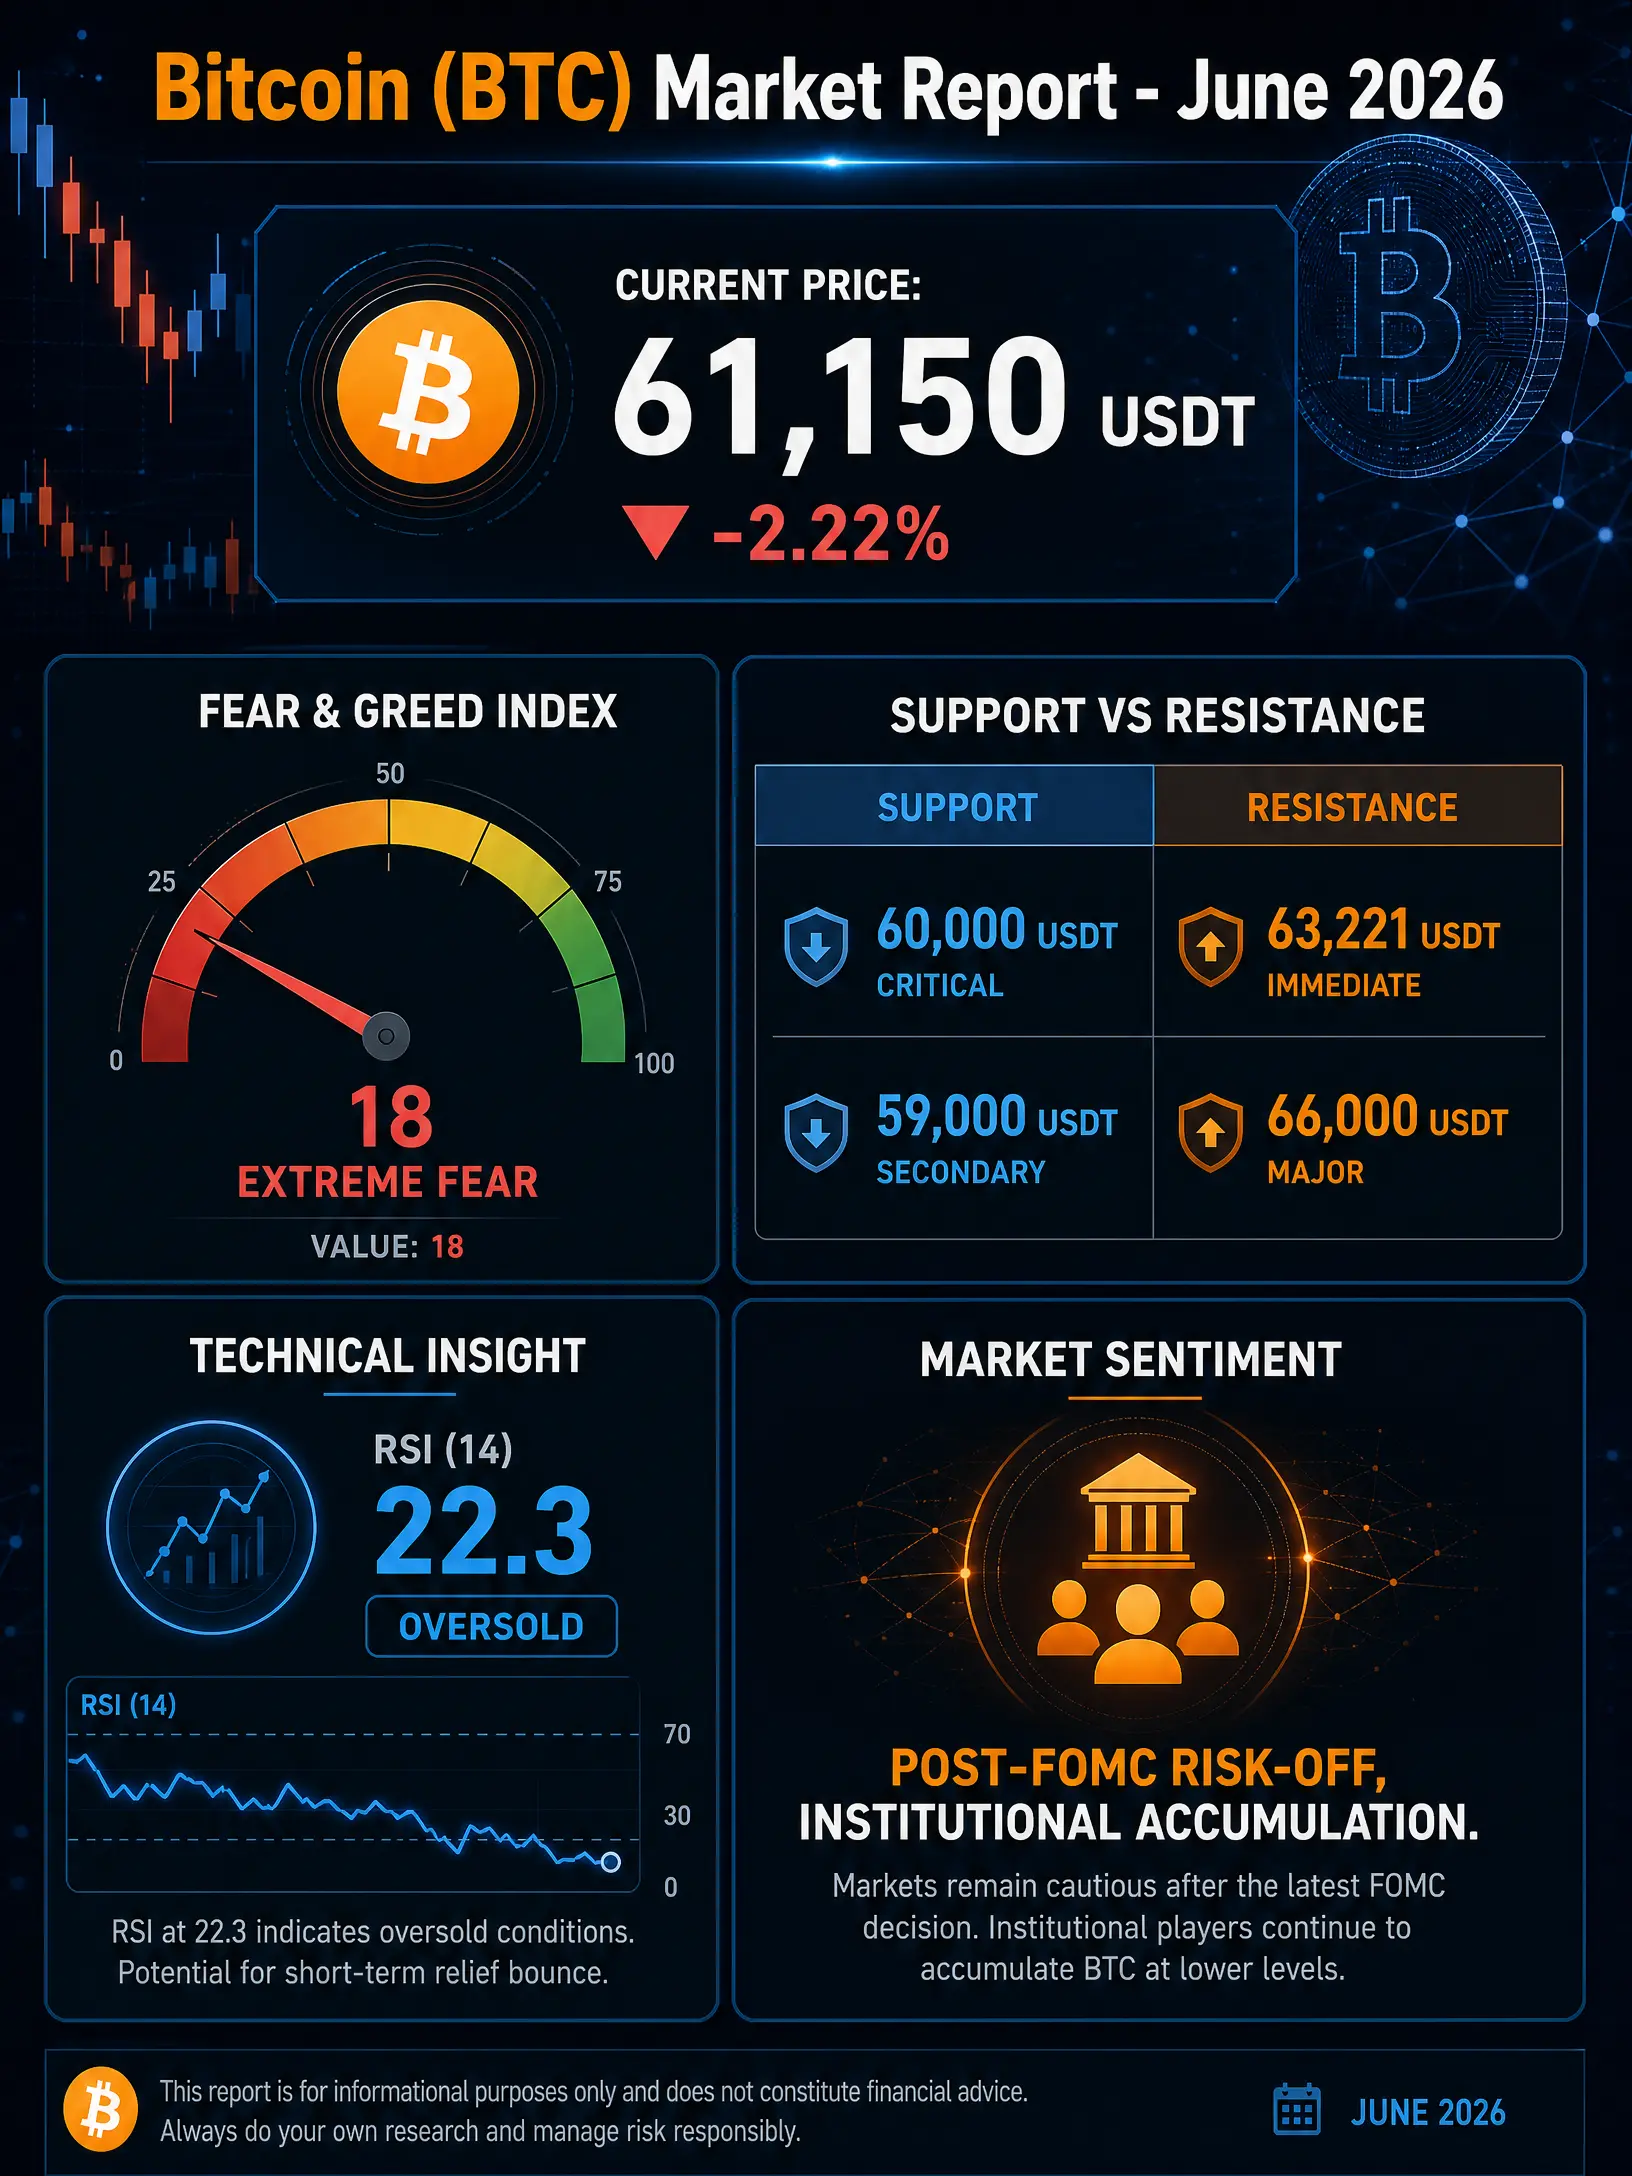
Bitcoin has entered one of the most critical phases of the current market cycle, experiencing substantial downward pressure as risk sentiment across global markets continues to deteriorate. The world's largest cryptocurrency is currently trading around 61,150 USDT, representing a decline of approximately 2.22% over the last 24 hours. During this period, Bitcoin traded within a volatile range between 60,889.5 USDT and 63,221.2 USDT, highlighting increased uncertainty among market participants.
While short-term price action remains under pressure, the broader picture is becoming increasingly important. Bitcoin now stands at a major crossroads where institutional accumulation, extreme fear, technical oversold conditions, and macroeconomic uncertainty are colliding simultaneously. The next few weeks could determine whether the market is approaching a long-term bottoming phase or preparing for another leg lower before recovery begins.
Current Price Action and Immediate Context
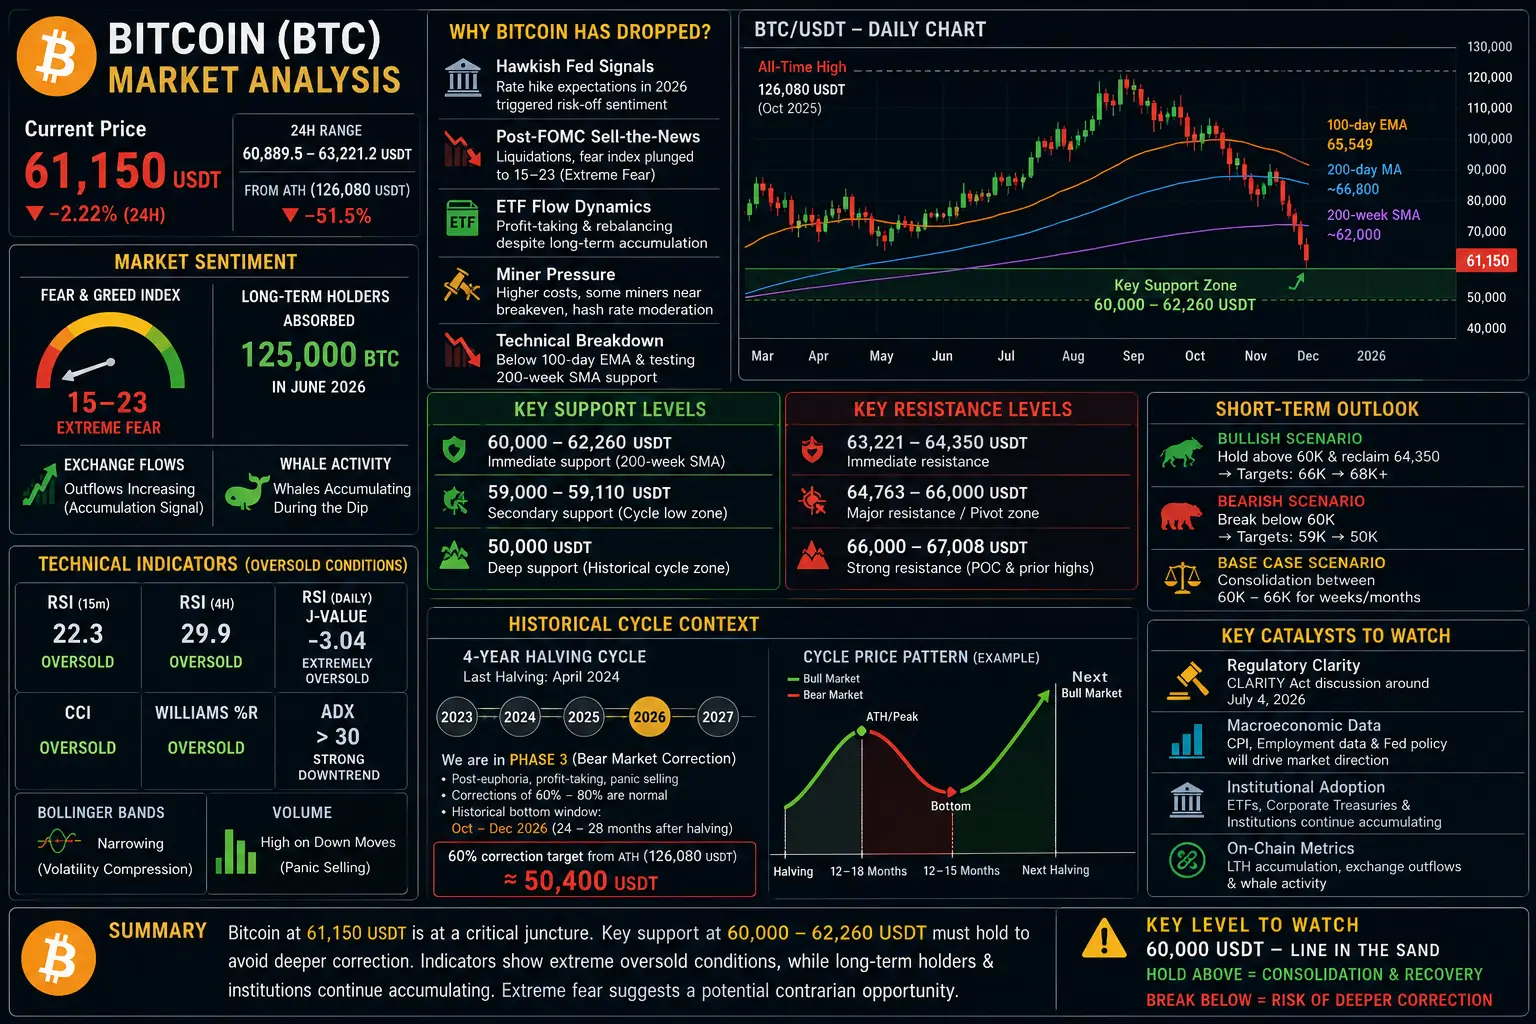
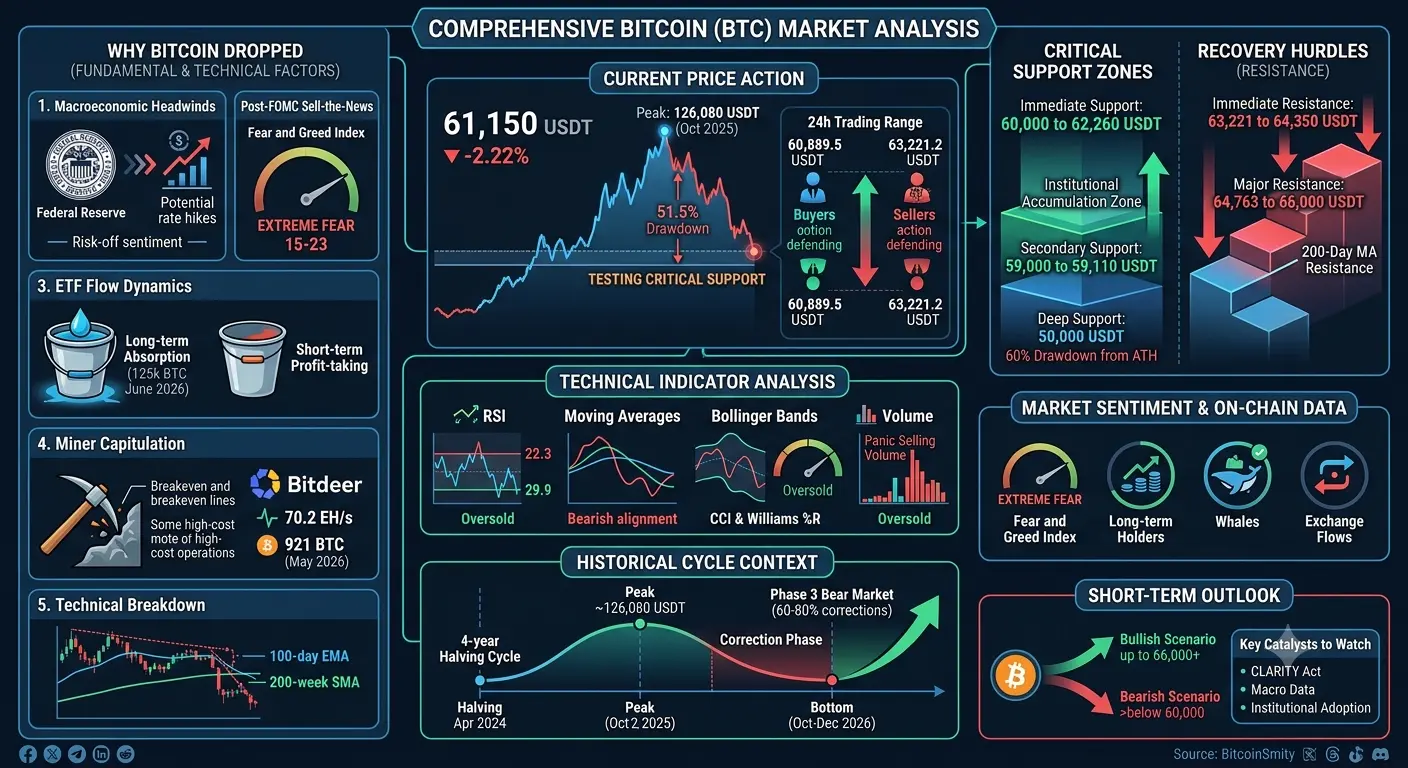
Bitcoin is currently changing hands near 61,150 USDT, placing it significantly below its all-time high of 126,080 USDT recorded in October 2025. This decline represents a drawdown of approximately 51.5%, placing Bitcoin firmly inside a major corrective phase according to historical cycle standards.
Despite the recent weakness, the market continues to defend the psychologically important 60,000 USDT region. The latest 24-hour trading range between 60,889.5 USDT and 63,221.2 USDT demonstrates that buyers and sellers remain locked in an intense battle for control. Such volatility near major support zones often precedes large directional moves.
The current environment reflects uncertainty rather than complete capitulation. Institutional investors continue accumulating selectively while short-term traders remain cautious due to broader macroeconomic concerns.
Why Bitcoin Has Dropped: Fundamental and Technical Factors
Macroeconomic Headwinds
The most significant catalyst behind Bitcoin's decline remains changing expectations regarding monetary policy. Recent Federal Reserve commentary has reinforced concerns that interest rates may remain elevated throughout 2026. Higher rates generally strengthen the appeal of traditional income-generating assets while reducing demand for speculative and growth-oriented investments such as cryptocurrencies.
As global liquidity conditions tighten, investors become increasingly selective regarding risk exposure, creating additional selling pressure across digital asset markets.
Post-FOMC Sell-the-News Pressure
Financial markets frequently experience heightened volatility following major central bank announcements. The recent Federal Open Market Committee meeting triggered a classic sell-the-news reaction, causing leveraged traders to unwind positions aggressively.
The resulting liquidation cascade pushed market sentiment into extreme fear territory, with the Fear and Greed Index dropping into the 15 to 23 range. Historically, such readings often appear during periods of panic when weak hands exit positions and stronger investors begin accumulating.
ETF Flow Dynamics
Bitcoin ETF activity continues to play a major role in market structure. Although short-term profit-taking and portfolio rebalancing have generated temporary selling pressure, long-term demand remains visible.
Long-term holders reportedly absorbed approximately 125,000 BTC during June 2026, demonstrating that institutional confidence has not disappeared despite ongoing volatility. Major asset managers continue maintaining exposure, although the pace of accumulation has slowed compared to earlier stages of the cycle.
Miner Capitulation Concerns
Mining profitability has deteriorated as Bitcoin prices declined. Some operators with higher energy costs are approaching breakeven levels, increasing concerns regarding miner selling pressure.
Nevertheless, large-scale mining companies continue expanding operations. Bitdeer reported a hash rate of approximately 70.2 EH/s alongside production of 921 BTC during May 2026, suggesting that major industry participants remain focused on long-term growth.
Technical Breakdown
From a purely technical perspective, Bitcoin has suffered significant structural damage. The asset now trades beneath the 100-day EMA near 65,549 USDT while simultaneously testing the 200-week SMA around 62,000 USDT.
When major moving averages fail, systematic trading algorithms often trigger additional selling activity. This phenomenon can amplify downside momentum and accelerate market corrections.
Key Support Levels: Critical Zones to Watch
Immediate Support at 60,000 USDT to 62,260 USDT
The most important support zone currently exists between 60,000 USDT and 62,260 USDT. This region aligns with historical accumulation areas and coincides with the 200-week moving average.
The recent rebound from 60,889.5 USDT indicates that buyers remain active in this region. Maintaining support above this zone would significantly improve the probability of stabilization and consolidation.
Secondary Support at 59,000 USDT to 59,110 USDT
Should Bitcoin lose the 60,000 USDT region, the next meaningful support area emerges between 59,000 USDT and 59,110 USDT.
This zone represents a major liquidity pocket where institutional participants may increase accumulation efforts. Historically, strong buying interest has emerged whenever Bitcoin approaches similar cycle-support regions.
Deep Support at 50,000 USDT
In a more pessimistic scenario, Bitcoin could revisit the 50,000 USDT area.
A move toward this level would represent roughly a 60% correction from the October 2025 peak and would align closely with historical bear-market retracement patterns observed in previous Bitcoin cycles.
Key Resistance Levels: Recovery Hurdles
Immediate Resistance at 63,221 USDT to 64,350 USDT
The first challenge facing buyers is the resistance zone between 63,221.2 USDT and 64,350 USDT.
Recovering this area would reduce immediate bearish pressure and improve short-term momentum. Multiple rejections in this region indicate that sellers continue defending it aggressively.
Major Resistance at 64,763 USDT to 66,000 USDT
The 64,763 USDT to 66,000 USDT zone remains the most important recovery barrier.
A successful breakout above this range would significantly improve market structure and increase the probability of a move toward higher targets.
200-Day Moving Average Resistance
Bitcoin also remains below its declining 200-day moving average, creating another obstacle for bulls.
Historically, sustainable recoveries begin only after price successfully reclaims and holds above this indicator.
Technical Indicator Analysis
Relative Strength Index (RSI)
Momentum indicators continue flashing deeply oversold readings.
The 15-minute RSI remains near 22.3, while the 4-hour RSI sits around 29.9. Meanwhile, the daily J-value has dropped to approximately -3.04, reflecting severe short-term selling pressure.
Historically, such readings often precede relief rallies and temporary recoveries.
Moving Average Configuration
Current moving average alignment remains bearish across multiple timeframes.
Shorter-term averages continue trading beneath longer-term averages while trend-strength indicators suggest sellers remain in control.
Bollinger Bands
Bollinger Band compression has reached unusually low levels.
Periods of compressed volatility are often followed by major directional expansions, meaning a significant move could occur soon.
Commodity Channel Index (CCI) and Williams %R
Both indicators remain firmly inside oversold territory, reinforcing signals generated by RSI.
Multiple oversold indicators appearing simultaneously often increase the probability of a countertrend rebound.
Volume Analysis
Trading volume expanded significantly during the decline, reflecting elevated fear and forced liquidations.
However, volume profiles also reveal accumulation activity near major support zones, suggesting sophisticated investors may be positioning for future recovery.
Market Sentiment and On-Chain Data
Fear and Greed Index
Current readings between 15 and 23 indicate extreme fear across the market.
Historically, such pessimistic conditions have frequently appeared near major cycle bottoms.
Long-Term Holder Behavior
Long-term investors accumulated approximately 125,000 BTC throughout June 2026.
This behavior is particularly noteworthy because experienced market participants often buy aggressively during periods of panic.
Whale Activity
Large Bitcoin holders continue displaying accumulation behavior.
Whale wallets have historically acted as leading indicators during major market turning points.
Exchange Flows
Exchange outflows continue increasing, suggesting investors are moving Bitcoin into long-term storage rather than preparing to sell.
This trend generally reduces available market supply and supports long-term bullish fundamentals.
Historical Cycle Context
Bitcoin continues following its traditional 4-year halving cycle, with the latest halving occurring in April 2024.
If the October 2025 peak at 126,080 USDT ultimately proves to be the cycle top, historical comparisons suggest the final bottom may emerge between October and December 2026.
Phase 3 Bear Market Correction
Current market behavior closely resembles Phase 3 of previous Bitcoin cycles.
This stage is typically characterized by fading optimism, prolonged consolidation, profit-taking, and emotional selling from late entrants.
Historically, corrections during this phase often reach 60% to 80% before a new accumulation cycle begins.
Short-Term Outlook and Scenarios
Bullish Scenario
Holding above 60,000 USDT and reclaiming 64,350 USDT could trigger a recovery toward 66,000 USDT, followed by potential upside toward 68,000 USDT and beyond.
Bearish Scenario
A decisive breakdown below 60,000 USDT could expose Bitcoin to downside targets near 59,000 USDT and eventually 50,000 USDT.
Base Case Scenario
The most likely outcome currently remains consolidation between 60,000 USDT and 66,000 USDT while investors assess macroeconomic developments, ETF flows, and on-chain accumulation trends.
Key Catalysts to Watch
Regulatory Developments
The upcoming CLARITY Act discussions could improve regulatory certainty and strengthen investor confidence.
Macroeconomic Data
Inflation reports, employment statistics, and Federal Reserve communications will remain major market drivers.
Institutional Adoption
Continued participation from ETFs, corporations, and institutional investors remains one of Bitcoin's strongest long-term bullish factors.
Bitcoin at 61,150 USDT sits at one of the most important technical and psychological levels of the entire 2026 cycle. While macroeconomic uncertainty, bearish technical structure, and weak sentiment continue weighing on price action, several encouraging signals are emerging beneath the surface.
Extreme fear readings, long-term holder accumulation, whale buying activity, exchange outflows, and deeply oversold technical indicators collectively suggest that the market may be approaching a significant inflection point.
The 60,000 USDT support zone remains the most important level to monitor. Holding above it could create the foundation for a multi-month recovery phase, while losing it may trigger a deeper correction toward 59,000 USDT or even 50,000 USDT.
For now, patience, disciplined risk management, and close monitoring of institutional activity remain essential as Bitcoin navigates one of the most consequential periods of the current market cycle. @Gate_Square #TradFiCFDGoldMasters
#BTC
Comprehensive Bitcoin (BTC) Market Analysis
Bitcoin has entered one of the most critical phases of the current market cycle, experiencing substantial downward pressure as risk sentiment across global markets continues to deteriorate. The world's largest cryptocurrency is currently trading around 61,150 USDT, representing a decline of approximately 2.22% over the last 24 hours. During this period, Bitcoin traded within a volatile range between 60,889.5 USDT and 63,221.2 USDT, highlighting increased uncertainty among market participants.
While short-term price action remains under pressure, the broader picture is becoming increasingly important. Bitcoin now stands at a major crossroads where institutional accumulation, extreme fear, technical oversold conditions, and macroeconomic uncertainty are colliding simultaneously. The next few weeks could determine whether the market is approaching a long-term bottoming phase or preparing for another leg lower before recovery begins.
Current Price Action and Immediate Context
Bitcoin is currently changing hands near 61,150 USDT, placing it significantly below its all-time high of 126,080 USDT recorded in October 2025. This decline represents a drawdown of approximately 51.5%, placing Bitcoin firmly inside a major corrective phase according to historical cycle standards.
Despite the recent weakness, the market continues to defend the psychologically important 60,000 USDT region. The latest 24-hour trading range between 60,889.5 USDT and 63,221.2 USDT demonstrates that buyers and sellers remain locked in an intense battle for control. Such volatility near major support zones often precedes large directional moves.
The current environment reflects uncertainty rather than complete capitulation. Institutional investors continue accumulating selectively while short-term traders remain cautious due to broader macroeconomic concerns.
Why Bitcoin Has Dropped: Fundamental and Technical Factors
Macroeconomic Headwinds
The most significant catalyst behind Bitcoin's decline remains changing expectations regarding monetary policy. Recent Federal Reserve commentary has reinforced concerns that interest rates may remain elevated throughout 2026. Higher rates generally strengthen the appeal of traditional income-generating assets while reducing demand for speculative and growth-oriented investments such as cryptocurrencies.
As global liquidity conditions tighten, investors become increasingly selective regarding risk exposure, creating additional selling pressure across digital asset markets.
Post-FOMC Sell-the-News Pressure
Financial markets frequently experience heightened volatility following major central bank announcements. The recent Federal Open Market Committee meeting triggered a classic sell-the-news reaction, causing leveraged traders to unwind positions aggressively.
The resulting liquidation cascade pushed market sentiment into extreme fear territory, with the Fear and Greed Index dropping into the 15 to 23 range. Historically, such readings often appear during periods of panic when weak hands exit positions and stronger investors begin accumulating.
ETF Flow Dynamics
Bitcoin ETF activity continues to play a major role in market structure. Although short-term profit-taking and portfolio rebalancing have generated temporary selling pressure, long-term demand remains visible.
Long-term holders reportedly absorbed approximately 125,000 BTC during June 2026, demonstrating that institutional confidence has not disappeared despite ongoing volatility. Major asset managers continue maintaining exposure, although the pace of accumulation has slowed compared to earlier stages of the cycle.
Miner Capitulation Concerns
Mining profitability has deteriorated as Bitcoin prices declined. Some operators with higher energy costs are approaching breakeven levels, increasing concerns regarding miner selling pressure.
Nevertheless, large-scale mining companies continue expanding operations. Bitdeer reported a hash rate of approximately 70.2 EH/s alongside production of 921 BTC during May 2026, suggesting that major industry participants remain focused on long-term growth.
Technical Breakdown
From a purely technical perspective, Bitcoin has suffered significant structural damage. The asset now trades beneath the 100-day EMA near 65,549 USDT while simultaneously testing the 200-week SMA around 62,000 USDT.
When major moving averages fail, systematic trading algorithms often trigger additional selling activity. This phenomenon can amplify downside momentum and accelerate market corrections.
Key Support Levels: Critical Zones to Watch
Immediate Support at 60,000 USDT to 62,260 USDT
The most important support zone currently exists between 60,000 USDT and 62,260 USDT. This region aligns with historical accumulation areas and coincides with the 200-week moving average.
The recent rebound from 60,889.5 USDT indicates that buyers remain active in this region. Maintaining support above this zone would significantly improve the probability of stabilization and consolidation.
Secondary Support at 59,000 USDT to 59,110 USDT
Should Bitcoin lose the 60,000 USDT region, the next meaningful support area emerges between 59,000 USDT and 59,110 USDT.
This zone represents a major liquidity pocket where institutional participants may increase accumulation efforts. Historically, strong buying interest has emerged whenever Bitcoin approaches similar cycle-support regions.
Deep Support at 50,000 USDT
In a more pessimistic scenario, Bitcoin could revisit the 50,000 USDT area.
A move toward this level would represent roughly a 60% correction from the October 2025 peak and would align closely with historical bear-market retracement patterns observed in previous Bitcoin cycles.
Key Resistance Levels: Recovery Hurdles
Immediate Resistance at 63,221 USDT to 64,350 USDT
The first challenge facing buyers is the resistance zone between 63,221.2 USDT and 64,350 USDT.
Recovering this area would reduce immediate bearish pressure and improve short-term momentum. Multiple rejections in this region indicate that sellers continue defending it aggressively.
Major Resistance at 64,763 USDT to 66,000 USDT
The 64,763 USDT to 66,000 USDT zone remains the most important recovery barrier.
A successful breakout above this range would significantly improve market structure and increase the probability of a move toward higher targets.
200-Day Moving Average Resistance
Bitcoin also remains below its declining 200-day moving average, creating another obstacle for bulls.
Historically, sustainable recoveries begin only after price successfully reclaims and holds above this indicator.
Technical Indicator Analysis
Relative Strength Index (RSI)
Momentum indicators continue flashing deeply oversold readings.
The 15-minute RSI remains near 22.3, while the 4-hour RSI sits around 29.9. Meanwhile, the daily J-value has dropped to approximately -3.04, reflecting severe short-term selling pressure.
Historically, such readings often precede relief rallies and temporary recoveries.
Moving Average Configuration
Current moving average alignment remains bearish across multiple timeframes.
Shorter-term averages continue trading beneath longer-term averages while trend-strength indicators suggest sellers remain in control.
Bollinger Bands
Bollinger Band compression has reached unusually low levels.
Periods of compressed volatility are often followed by major directional expansions, meaning a significant move could occur soon.
Commodity Channel Index (CCI) and Williams %R
Both indicators remain firmly inside oversold territory, reinforcing signals generated by RSI.
Multiple oversold indicators appearing simultaneously often increase the probability of a countertrend rebound.
Volume Analysis
Trading volume expanded significantly during the decline, reflecting elevated fear and forced liquidations.
However, volume profiles also reveal accumulation activity near major support zones, suggesting sophisticated investors may be positioning for future recovery.
Market Sentiment and On-Chain Data
Fear and Greed Index
Current readings between 15 and 23 indicate extreme fear across the market.
Historically, such pessimistic conditions have frequently appeared near major cycle bottoms.
Long-Term Holder Behavior
Long-term investors accumulated approximately 125,000 BTC throughout June 2026.
This behavior is particularly noteworthy because experienced market participants often buy aggressively during periods of panic.
Whale Activity
Large Bitcoin holders continue displaying accumulation behavior.
Whale wallets have historically acted as leading indicators during major market turning points.
Exchange Flows
Exchange outflows continue increasing, suggesting investors are moving Bitcoin into long-term storage rather than preparing to sell.
This trend generally reduces available market supply and supports long-term bullish fundamentals.
Historical Cycle Context
Bitcoin continues following its traditional 4-year halving cycle, with the latest halving occurring in April 2024.
If the October 2025 peak at 126,080 USDT ultimately proves to be the cycle top, historical comparisons suggest the final bottom may emerge between October and December 2026.
Phase 3 Bear Market Correction
Current market behavior closely resembles Phase 3 of previous Bitcoin cycles.
This stage is typically characterized by fading optimism, prolonged consolidation, profit-taking, and emotional selling from late entrants.
Historically, corrections during this phase often reach 60% to 80% before a new accumulation cycle begins.
Short-Term Outlook and Scenarios
Bullish Scenario
Holding above 60,000 USDT and reclaiming 64,350 USDT could trigger a recovery toward 66,000 USDT, followed by potential upside toward 68,000 USDT and beyond.
Bearish Scenario
A decisive breakdown below 60,000 USDT could expose Bitcoin to downside targets near 59,000 USDT and eventually 50,000 USDT.
Base Case Scenario
The most likely outcome currently remains consolidation between 60,000 USDT and 66,000 USDT while investors assess macroeconomic developments, ETF flows, and on-chain accumulation trends.
Key Catalysts to Watch
Regulatory Developments
The upcoming CLARITY Act discussions could improve regulatory certainty and strengthen investor confidence.
Macroeconomic Data
Inflation reports, employment statistics, and Federal Reserve communications will remain major market drivers.
Institutional Adoption
Continued participation from ETFs, corporations, and institutional investors remains one of Bitcoin's strongest long-term bullish factors.
Bitcoin at 61,150 USDT sits at one of the most important technical and psychological levels of the entire 2026 cycle. While macroeconomic uncertainty, bearish technical structure, and weak sentiment continue weighing on price action, several encouraging signals are emerging beneath the surface.
Extreme fear readings, long-term holder accumulation, whale buying activity, exchange outflows, and deeply oversold technical indicators collectively suggest that the market may be approaching a significant inflection point.
The 60,000 USDT support zone remains the most important level to monitor. Holding above it could create the foundation for a multi-month recovery phase, while losing it may trigger a deeper correction toward 59,000 USDT or even 50,000 USDT.
For now, patience, disciplined risk management, and close monitoring of institutional activity remain essential as Bitcoin navigates one of the most consequential periods of the current market cycle. @Gate_Square #TradFiCFDGoldMasters