Summary
-
Last week, global markets traded around the Federal Reserve’s hawkish signals. Cooling rate-cut expectations pushed U.S. Treasury yields and the U.S. dollar higher, putting pressure on risk assets. The crypto market also corrected, with both BTC and ETH declining by more than 4%.
-
The overall trend of ETF outflows remained unchanged. Trading activity on Gate TradFi Perp stayed strong, while coverage of U.S. equity assets continued to expand. Short-term order book liquidity for XAUT weakened, and the market remained in a cautious positioning phase amid macroeconomic uncertainty.
-
On-chain activity showed a moderate recovery but did not develop into a broad-based surge in trading volume. DEX volumes diverged, with Uniswap slightly overtaking PancakeSwap and the Solana ecosystem seeing renewed trading activity. Stablecoin supply did not show significant new U.S. dollar inflows, with capital rotation largely confined to existing liquidity. Mid-tier stablecoins demonstrated a degree of resilience.
-
The DeFi market entered a phase of structural recovery. LSTs, Aave lending activity, and protocol revenues all improved, though the gains were primarily driven by asset price appreciation and the recovery of core liquidity markets. Capital continued to favor mature collateral assets, stable-yield products, and trading-focused protocols, while stablecoin issuance remained the industry's primary revenue source.
-
The BTC derivatives market continued its deleveraging process. Open interest (OI) declined sharply, while funding rates remained positive, indicating that bullish sentiment had cooled but had not yet turned bearish. Meanwhile, declining options volume, weakening skew, and a rebound in DVOL reflected rising short-term demand for downside protection and renewed expectations of higher volatility.
1. Market Focus Analysis
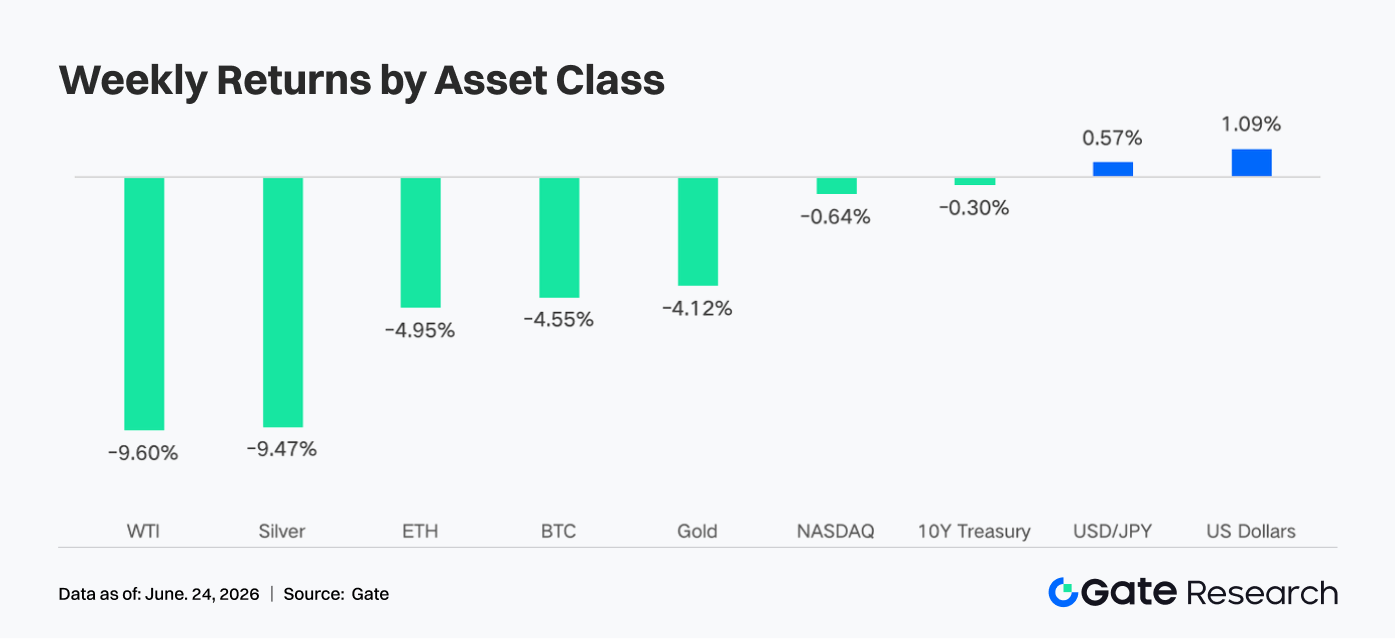
Last week (June 15–21, 2026), the key macro event was the Federal Reserve’s June FOMC meeting. Following his first post-meeting press conference as Fed Chair, Kevin Warsh delivered remarks that markets interpreted as hawkish. The Fed kept the federal funds target range unchanged at 3.50%–3.75%, but the latest dot plot completely removed expectations for rate cuts in 2026. Nine of the 18 officials even projected at least one rate hike before year-end. Warsh also stated that forward guidance was no longer suitable for the current policy environment. As a result, U.S. Treasury yields rose sharply, with the two-year Treasury yield reaching its highest level in over a year. Equity markets experienced significant volatility on Fed Day. Although the Nasdaq Composite gained 2.43% for the week, the S&P 500 rose 0.93%, and the Russell 2000 advanced 1.21%, the intraday sell-off on Wednesday was described by media outlets as “the worst Fed Day since the new chair took office.” The U.S. Dollar Index strengthened alongside hawkish expectations, weighing on commodities. Gold traded sideways amid competing safe-haven demand and dollar strength, while oil prices edged lower due to demand concerns. Market participants remained focused on inflation and labor market data for clues as to whether the Fed might ultimately shift toward rate hikes later this year. With no major Nonfarm Payrolls or CPI releases during the week, market sentiment was largely expectation-driven. Geopolitical developments in the Middle East, as well as U.S. tax reform and debt ceiling negotiations, also contributed to a cautious risk environment.
In crypto markets, concerns over tighter liquidity conditions stemming from hawkish Fed expectations had a clear negative impact on digital assets. BTC fell approximately 4% over the week, declining from a Monday high of $67,300 to a low near $62,300 on Thursday before rebounding modestly to close around $63,300 over the weekend. ETH underperformed BTC, falling roughly 5%, retreating from a weekly high near $1,850 to around $1,700 by Sunday. Altcoins broadly followed major cryptocurrencies lower as tightening liquidity conditions weighed on risk appetite. Total crypto market capitalization fluctuated between approximately $2.2 trillion and $2.29 trillion, while the Fear & Greed Index moved closer to the “Fear” zone following the Fed meeting, reflecting increasingly cautious market sentiment.
2. Liquidity Analysis
2.1 The Broad Trend of Crypto ETF Outflows Has Yet to Reverse
Last week, U.S. spot Bitcoin ETFs as a whole recorded modest net inflows. However, cumulative net outflows from spot Bitcoin ETFs in June still reached approximately $2.1 billion, indicating that the broader trend of continued capital outflows this month has not fundamentally reversed.
Looking at the major products, BlackRock's IBIT continued to lead. On Tuesday alone, it recorded net inflows of approximately $16.4 million, demonstrating its strong ability to attract capital. At present, the combined AUM of all U.S. spot Bitcoin ETFs stands at approximately $82.5 billion, with holdings of around 1.284 million BTC. Among them, IBIT remains dominant, managing approximately $66 billion in assets, while Fidelity's FBTC ranks second with approximately $14 billion. In addition, on June 16, BlackRock officially listed a new product on Nasdaq — the iShares Bitcoin Premium Income ETF (BITA). Marketed with monthly cash distributions, the product targets an annualized yield of 15%–25% and is designed to attract income-oriented institutional investors, adding a new category to the Bitcoin ETF product ecosystem.
Last week, liquidity conditions for spot Ethereum ETFs showed some divergence, with signs of recovery appearing in certain products. On June 16, spot Ethereum ETFs recorded net inflows of approximately $9.6 million, marking the second consecutive day of positive flows and signaling a recent improvement. BlackRock's ETHA continued to serve as the primary source of inflows, recording approximately $17.3 million in net inflows that day and single-handedly supporting the overall positive flow. Meanwhile, Bitwise ETHW recorded net outflows of approximately $3.5 million, Fidelity FETH recorded net outflows of approximately $2.2 million, and Grayscale Mini ETH recorded net outflows of approximately $2.0 million, indicating that capital continues to concentrate in leading products.
Overall, institutional allocation demand through ETF channels remains intact. However, against the backdrop of unfavorable macro interest-rate expectations, the pace of new capital entering the market has slowed significantly in the short term, and the market is waiting for greater clarity regarding the future path of Federal Reserve policy.
2.2 TradFi Liquidity
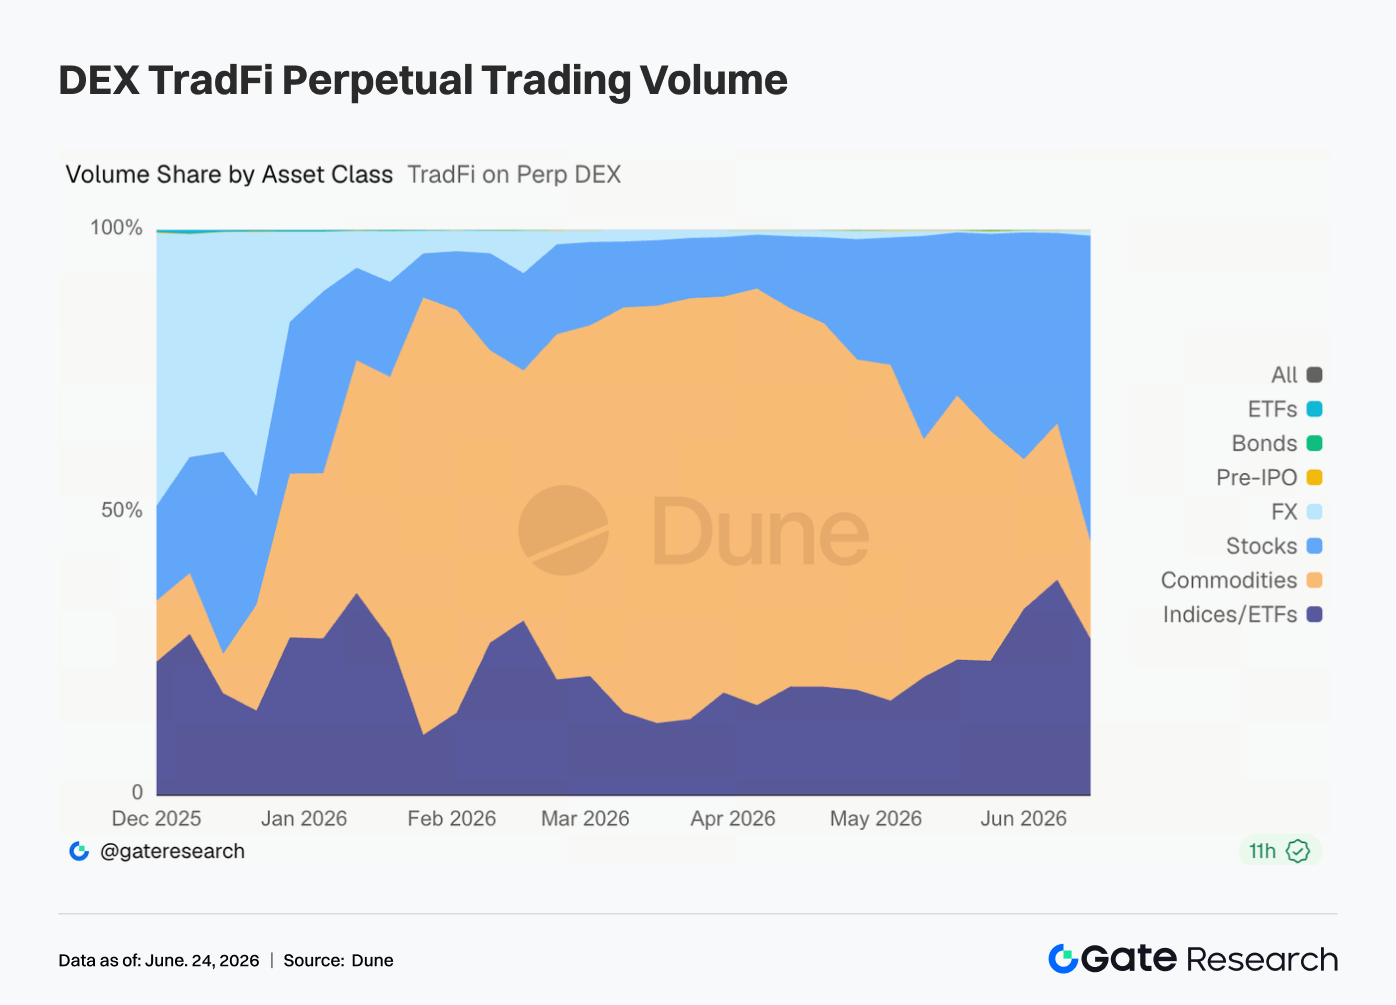
- TradFi Perp DEX: Over the past week, the trading structure of TradFi Perp DEXs underwent notable changes. The share of commodities continued to decline, while the shares of stocks and indices/ETFs increased significantly. Since mid-May, the share of the commodities sector has gradually fallen from a previous high of nearly 70% to approximately 25%–35%, while the share of stocks has rebounded rapidly to around 30%, and the share of indices/ETFs has risen to approximately 35%–40%, becoming the primary source of incremental growth in recent weeks. This shift is closely related to the recent market environment. On the one hand, safe-haven trading driven by tensions in the Middle East pushed commodity prices such as gold higher before entering a consolidation phase, leading to a marginal cooling in trading activity. On the other hand, the listing of SpaceX and continued strength in AI, semiconductor, and other technology sectors attracted capital back into U.S. equities and related index products. For TradFi Perp platforms, user demand is expanding from simple gold trading to a broader range of asset classes, including stocks, ETFs, and Pre-IPO products.
-
Gate TradFi Perp: Over the past week, Gate TradFi Perp trading volume remained at a relatively high level overall. Daily trading volume was mainly concentrated in the range of $300 million to $800 million. Compared with previous periods, volatility in trading volume narrowed somewhat, but activity remained consistently strong. During the period, several days saw rapid increases in trading volume, with the peak approaching $800 million, indicating that demand for leveraged trading remained robust during periods of major macro events and asset price fluctuations. By asset class, metals continued to dominate trading activity, while equity-related assets recorded significant volume increases on several trading days. The blue area repeatedly expanded alongside increases in total trading volume, indicating that user participation in U.S. equity-related perpetual contracts is increasing. Overall, Gate TradFi Perp trading volume remained stable over the past week, with demand driven primarily by precious metals perpetual contracts, while participation in equity-related assets continued to increase.
-
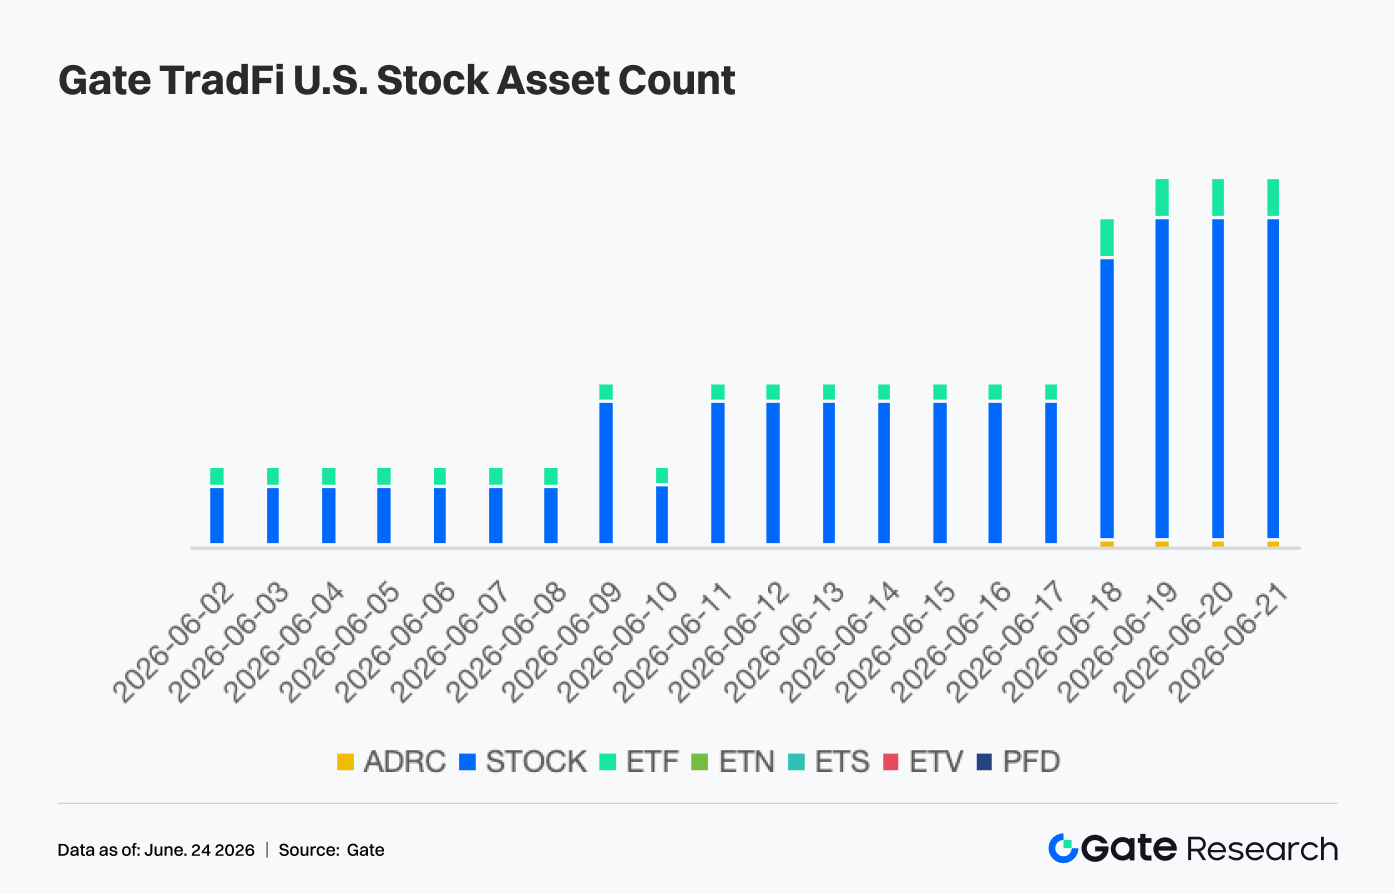
Number of Gate TradFi U.S. Stock Assets: Gate officially launched its U.S. stock trading service on June 2. Supported by real underlying assets, direct USDT settlement, no overnight holding fees, and high liquidity, the service has continued to attract market attention since launch, with trading volume growing steadily. At present, Gate supports seven categories of assets, including ADRC, Stocks, ETFs, ETNs, ETSs, ETVs, and PFDs, and continues to expand its product coverage. In terms of the number of assets, the total number of tradable instruments has doubled since launch. Among them, the stock category has experienced the most significant growth, with its share of all listed assets increasing from approximately 70% at launch to 85%, further enriching users' investment choices. Going forward, Gate will continue to expand access to more markets, integrate global liquidity, and enhance cross-market trading capabilities, continuously broadening its diversified asset coverage and further strengthening its strategic positioning as a global asset trading and market access platform.
- TradFi Order Book Depth: We selected XAUT, the highest-volume TradFi asset, to analyze order book depth (Delta). Over the past week, XAUT order book liquidity showed clear divergence. During the first half of the week, buy-side liquidity repeatedly dominated, with Delta turning sharply positive and reaching a peak of nearly $2.5 million, driving XAUT prices from around $4,050 to approximately $4,300 and demonstrating strong market absorption capacity. However, after June 18, as prices retreated from their highs, sell-side liquidity gradually strengthened, and Delta turned persistently negative, indicating increasing overhead selling pressure. Since June 22, negative Delta has expanded significantly, with aggressive sell orders gaining the upper hand in the short term, causing XAUT prices to retreat to around $4,120. Overall, gold-backed tokens continue to receive buying support, but the short-term liquidity structure has become more defensive, with the market waiting for further clarity regarding macroeconomic uncertainty.
3. On-Chain Data Insights
3.1 DEX Trading Volume Did Not Expand Broadly Alongside the Market Recovery, with Uniswap Slightly Overtaking PancakeSwap
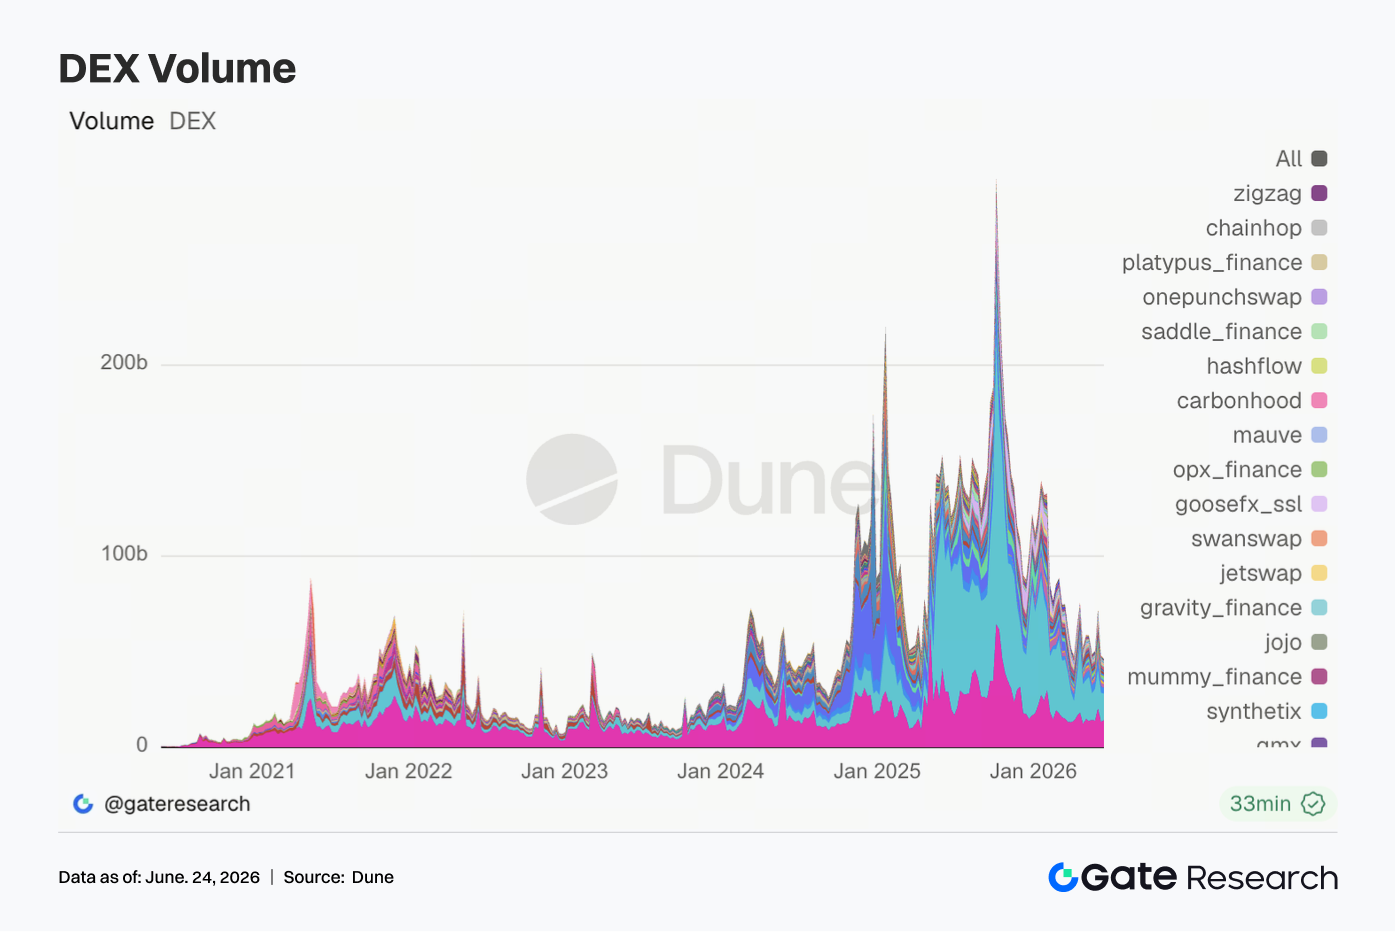
Last week, DEX trading volume showed divergence, as the market rebound did not translate into a broad-based increase in volume. Uniswap recorded weekly trading volume of approximately $14.11 billion, slightly surpassing PancakeSwap's $13.98 billion. PancakeSwap declined compared with the previous week, while Uniswap continued to recover. Aerodrome and Curve cooled from the elevated levels seen in the previous week, indicating that trading demand on Ethereum and Base did not continue to expand. Performance on Solana was stronger, with trading volume on Raydium and Meteora rebounding, while Whirlpool remained largely unchanged. PumpSwap volume increased to approximately $458 million, with the number of traders remaining above 1.26 million, although the number of transactions was slightly lower than the previous week. This suggests that last week's growth was driven more by larger average transaction sizes rather than a substantial increase in high-frequency retail activity.
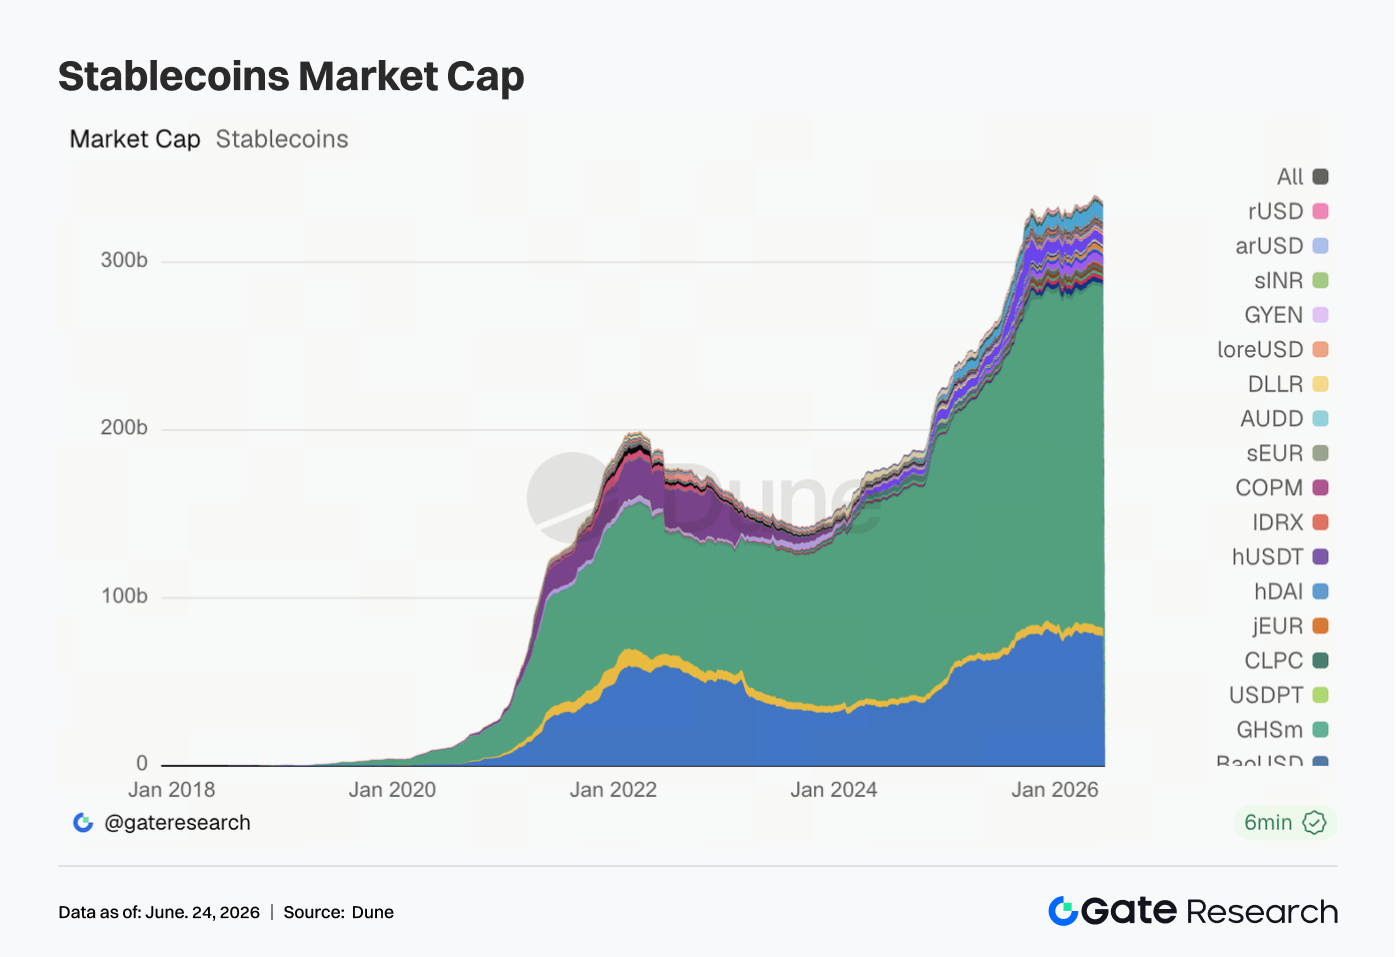
3.2 Stablecoin Supply Diverged, with Mid-Tier Assets Better Reflecting Changes in the On-Chain Dollar Structure
Last week, the stablecoin market showed clear divergence, with data for leading assets such as USDT and USDC declining. Notably, DAI remained at approximately $4.96 billion, PYUSD rose slightly to around $2.09 billion, and GHO remained stable at approximately $600 million, indicating that some mid-tier stablecoins continued to demonstrate resilience. USDe and USDS also declined, suggesting that the expansion of yield-bearing and protocol-native stablecoins has slowed. Overall, the stablecoin market did not provide a clear signal of new dollar inflows last week. On-chain capital continued to rotate within existing liquidity, while institutional allocations remained focused on assets with proven liquidity, reserve transparency, and cross-chain usability.
3.3 Recovery in LST Valuations Expanded, with Greater Elasticity Seen on the SOL and HYPE Sides
Last week, the LST sector recovered broadly, and major ETH staking protocols continued their gradual improvement. Lido TVL increased to approximately $15.71 billion, while Rocket Pool and StakeWise both recorded growth of around 3% to 5%, indicating that capital conditions in ETH staking have not continued to deteriorate. The SOL ecosystem showed greater elasticity, with both Jito and Jupiter Staked SOL posting notable rebounds, while Sanctum Validator LSTs continued to expand. Kinetiq kHYPE delivered the strongest performance, with TVL increasing by approximately 15% compared with the previous week. However, because TVL is measured in U.S. dollar terms, much of last week's increase may have been driven by price recoveries in ETH, SOL, and HYPE rather than net inflows of staked assets. The current situation appears more consistent with valuation recovery and position rebuilding.
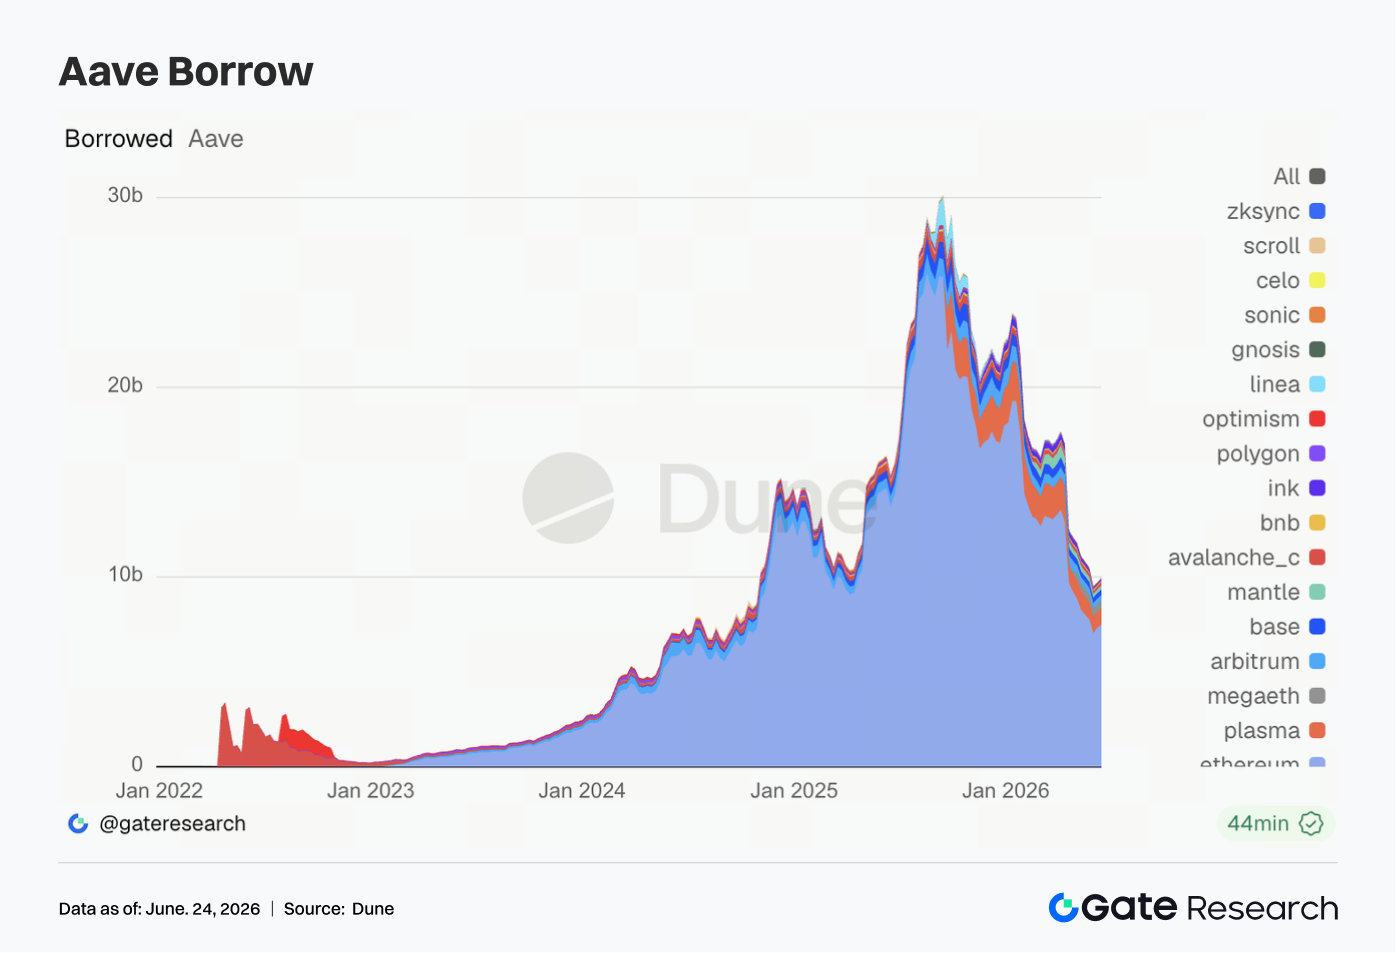
3.4 Aave Lending Activity Recovered Moderately, with Ethereum Providing Support While Multi-Chain Markets Were No Longer Weakening Unilaterally
Aave lending balances continued to recover last week. The Ethereum market remained the primary source of support, with outstanding borrowings increasing to approximately $7.48 billion, up around 2% from the previous week. Multi-chain markets no longer weakened unilaterally. Plasma, Mantle, Avalanche, and Ink all recorded notable rebounds, while Arbitrum and Base also improved slightly. MegaETH and BNB Chain, however, experienced declines. Capital has returned first to markets with deeper collateral pools, stronger liquidation liquidity, and more mature risk parameters, although borrowing demand on certain emerging chains has also begun to recover. Overall, Aave has moved from a post-incident defensive phase into a stage of selective recovery, although expansion remains concentrated in markets with more reliable liquidity.
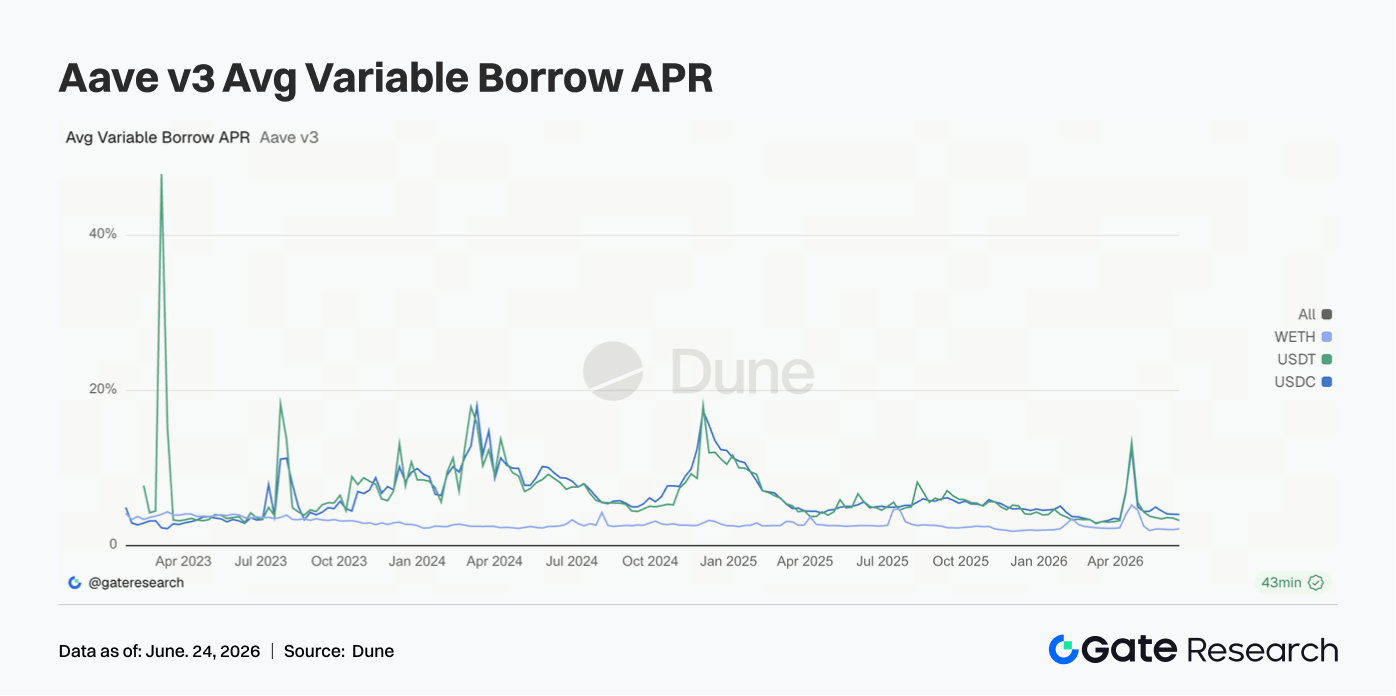
3.5 Aave Borrowing Rates Stabilized at Low Levels, While Tail-End Pressure in USDC Continued to Ease
Last week, borrowing rates for major assets on Aave remained stable at low levels. The average borrowing rate for USDC was approximately 4.02%, largely unchanged from the previous week. However, the weekly peak rate declined from approximately 10.84% to 9.36%, indicating that short-term liquidity tightness caused by extreme utilization rates continued to ease. The average borrowing rate for USDT fell to approximately 3.24%, while the average borrowing rate for WETH rose slightly to approximately 2.16%, although it remained within a low range. The recovery in lending balances did not trigger a rapid increase in financing costs, suggesting that leverage demand remains relatively restrained. The current rate environment is suitable for capital turnover, carry trades, and market-neutral strategies, but does not yet indicate competition among borrowers for liquidity.
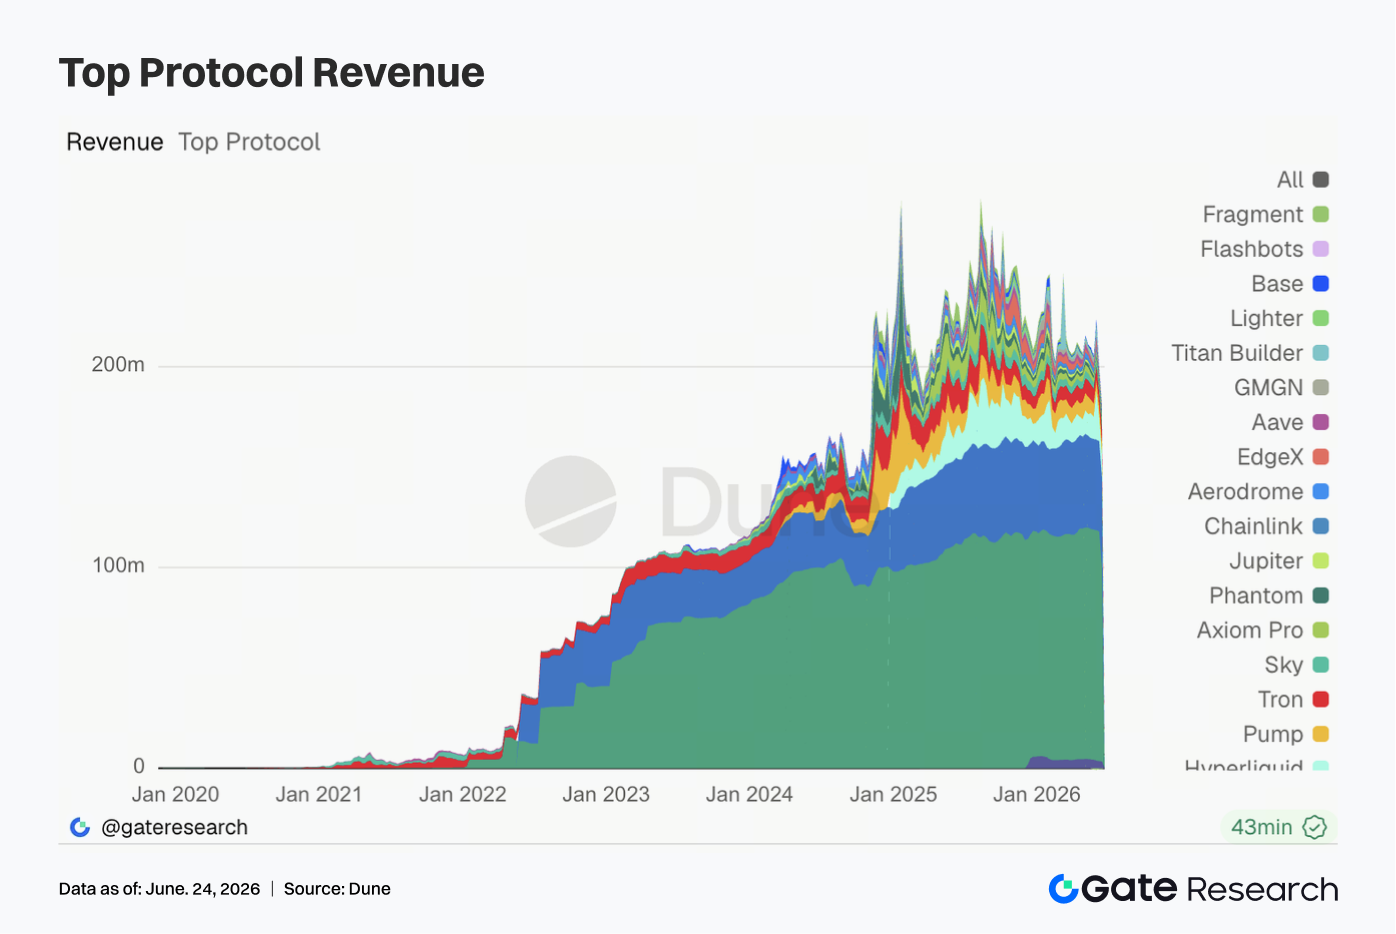
3.6 Protocol Revenue Declined but the Overall Structure Remained Unchanged, with Stablecoin Issuers Continuing to Serve as the Revenue Foundation
Last week, protocol revenue was generally weaker. Tether’s revenue declined to approximately $96.76 million, down around 15.5% from the previous week, but it remained significantly ahead of other protocols. Circle generated approximately $45.19 million in revenue, remaining largely stable. Hyperliquid generated approximately $11.57 million in revenue, down slightly from the previous week, but continued to be the leading revenue source among on-chain trading protocols. Revenue for Pump, Tron, Titan Builder, and Base declined, while Axiom Pro, Jupiter, Aerodrome, and Aave improved against the broader trend. The overall revenue structure remained fundamentally unchanged: stablecoin issuers continued to provide the industry's revenue foundation, derivatives and trading applications contributed cyclical upside, and lending protocols maintained relatively stable but limited revenue recovery in a low-interest-rate environment.
4. Derivatives Tracking
4.1 BTC Funding Rates Remained Positive While OI Declined Rapidly, as Leveraged Positions Continued to Be Cleared
Last week, BTC prices generally remained in a low-level consolidation range. At the beginning of the week, prices traded around $65,000–$66,000 before falling to the $62,000–$63,000 range around June 17. Although a partial recovery followed, BTC remained near $64,000 over the weekend and failed to reclaim levels above $66,000.
Open interest (OI) declined significantly during the week. Around June 15, OI remained above $23 billion before falling rapidly to approximately $21 billion, where it remained relatively stable during the second half of the week. The combination of falling prices and rapidly declining OI indicates continued deleveraging, with a portion of long positions accumulated during the previous rebound being forced out of the market. Funding rates remained positive throughout the week, although overall levels were noticeably lower than before. Between June 18 and June 19, funding rates briefly increased, suggesting that some bottom-fishing demand from long positions remained during the consolidation period, although no signs of extreme crowding emerged. Compared with the high-funding-rate environment seen in previous weeks, bullish sentiment was significantly more restrained.
Overall, the BTC derivatives market currently exhibits a structure characterized by “low-price consolidation + declining OI + moderately positive funding rates.” Leverage-related risks continue to be released, but the market has not yet shifted into a crowded short positioning environment. If BTC fails to regain levels above $66,000, an extended period of low-level consolidation may continue to suppress the return of leveraged capital.

4.2 Options Volume Was Higher Earlier in the Week and Lower Later, While Monthly Contracts Remained the Primary Trading Instrument
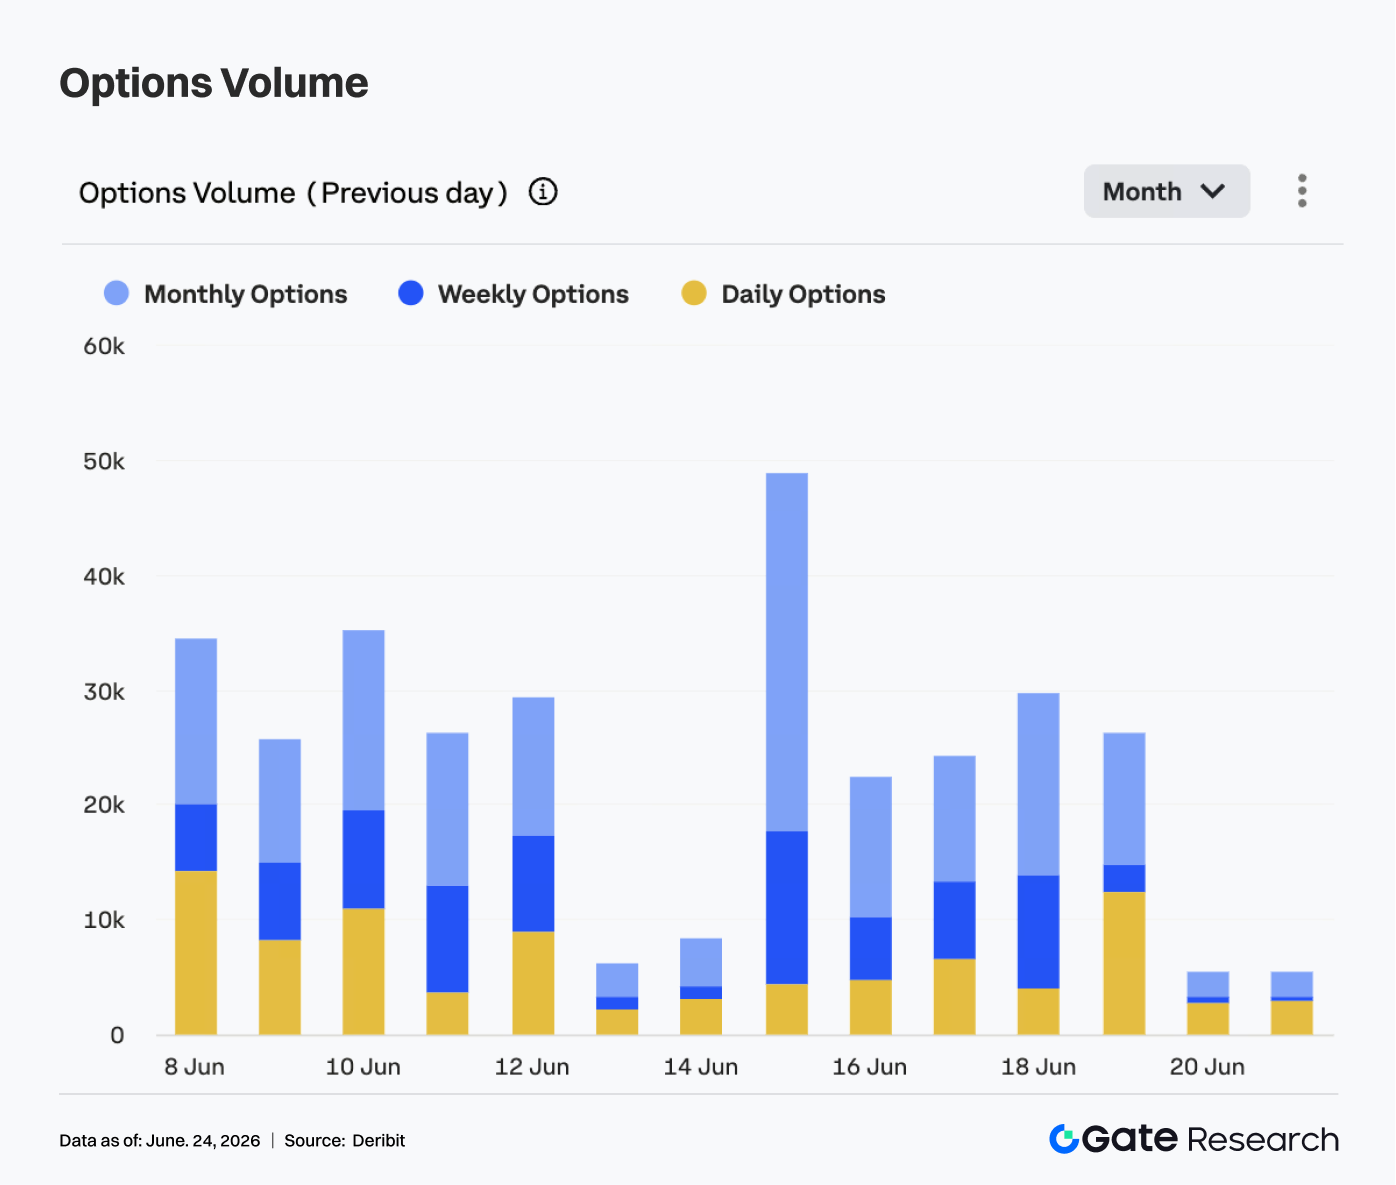
In the options market, BTC options trading volume showed a pattern of being higher at the beginning of the week and lower toward the end. Trading volume approached 50,000 contracts on June 15, marking the weekly peak and indicating strong demand for position rolling and hedging following previous price volatility. Thereafter, trading volume gradually declined, remaining mostly between 20,000 and 30,000 contracts from June 16 to June 19, before falling rapidly to around 5,000 contracts over the weekend.
From a structural perspective, monthly options continued to account for the majority of trading volume, indicating that market participants remained focused on medium-term risk management and directional position adjustments. Weekly options maintained a certain degree of activity on some trading days, reflecting ongoing short-term trading demand, although no concentrated surge in volume occurred. The share of daily options volume increased around June 19, suggesting that during the period of low-level price consolidation, some capital used short-dated instruments for temporary hedging or event-driven trading. Overall, however, daily options did not become the dominant instrument, and market activity remained concentrated in monthly and weekly expiries.
Overall, options trading volume cooled significantly compared with the previous high-volatility period. The pattern of stronger activity early in the week and weaker activity later suggests that concentrated hedging demand has largely been absorbed and the market has entered a wait-and-see phase. If BTC subsequently breaks above $66,000 or falls below $62,000, options trading volume may increase again.
4.3 25D Skew Weakened Again, Reflecting Rising Demand for Short-Term Downside Protection
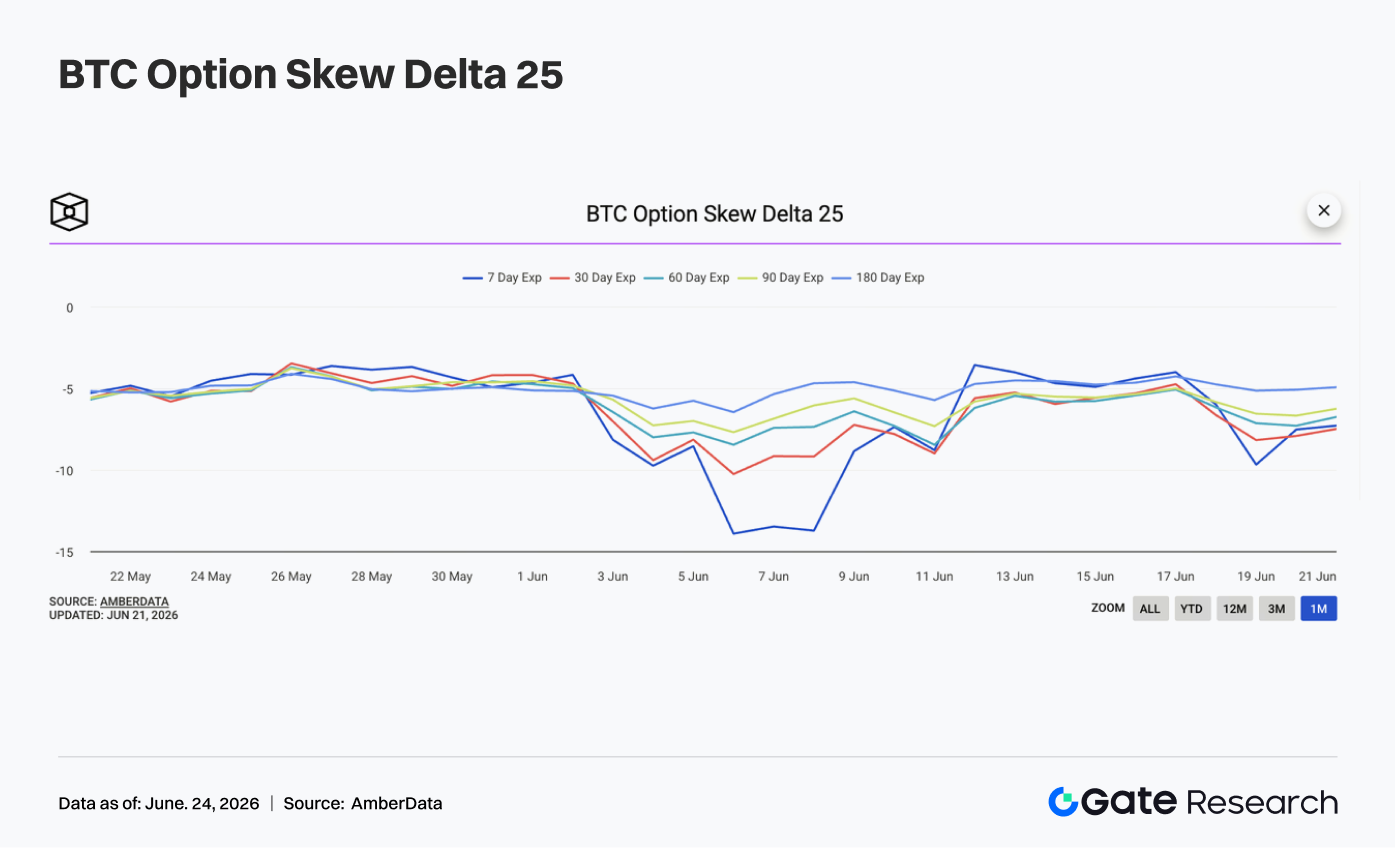
Looking at the 25D Skew, BTC skew across all maturities remained negative overall and weakened again during the second half of the week. At the beginning of the week, skew across maturities was mostly between -4 and -5, reflecting relatively stable conditions and indicating that the extreme defensive sentiment seen previously had moderated.
However, as BTC prices declined again after June 17, skew across maturities began to weaken. Around June 19, 7D Skew briefly fell to nearly -10, while 30D Skew declined to around -8, indicating that premiums for short-dated put options increased again and market concerns regarding short-term downside risks intensified. Compared with the extreme conditions seen in early June, when 7D Skew approached -14, last week's decline in skew did not reach panic levels. The decline in medium- and long-dated skew was relatively modest, suggesting that demand for protection remained concentrated in short-dated maturities. Market participants appear more concerned about a near-term break below key support levels than a repricing of the longer-term trend.
Overall, the skew structure last week reflected a recovery in defensive sentiment. If BTC continues to trade within the $62,000–$64,000 range, demand for short-term protection may remain elevated. If prices regain levels above $66,000, skew could recover toward a more moderate negative range.
4.4 DVOL Rebounded from Low Levels, with Volatility Expectations Rising Again
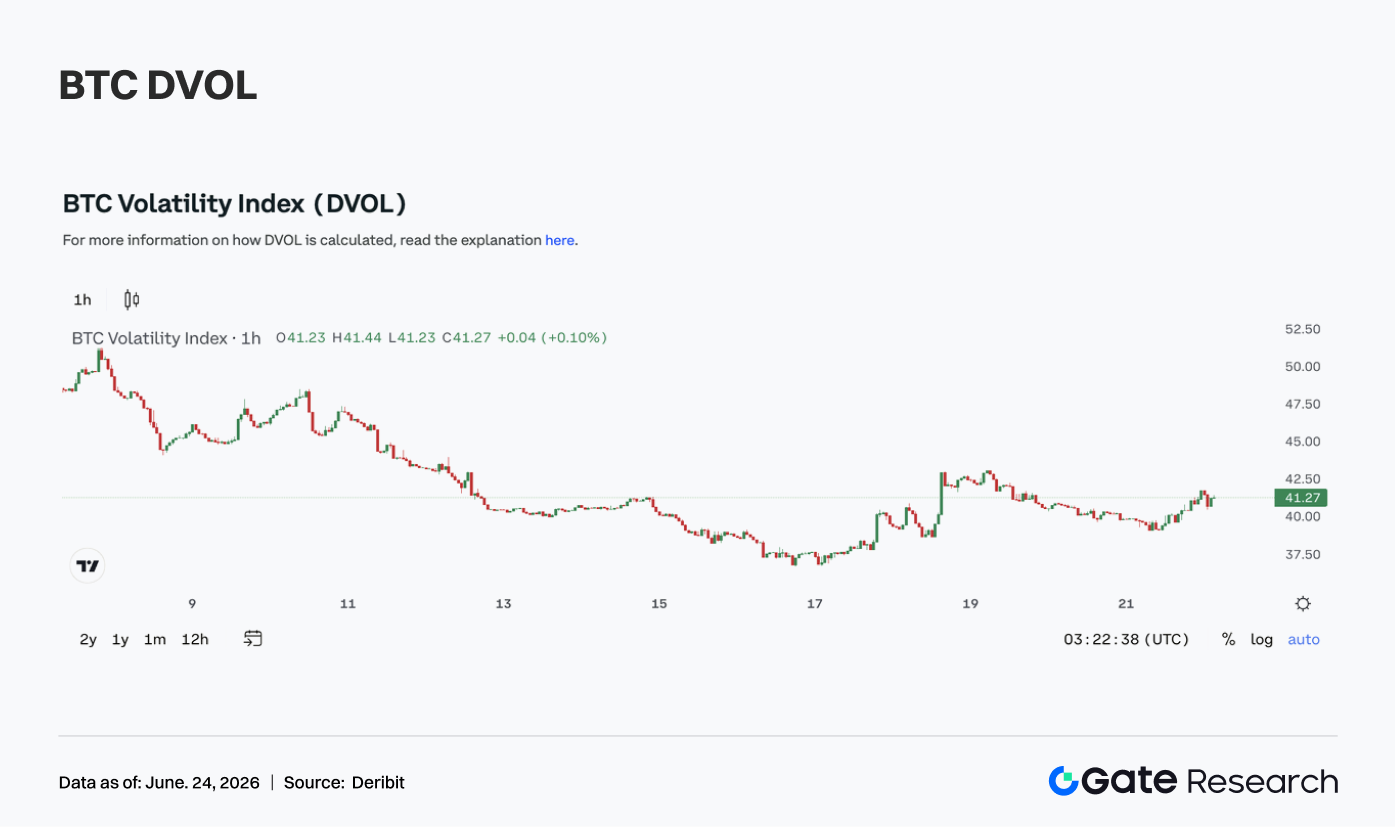
In terms of volatility, the BTC volatility index DVOL first declined and then rebounded. At the beginning of the week, DVOL continued its previous downtrend, gradually falling from around 40 and reaching approximately 37.5 near June 17, indicating a notable cooling in volatility expectations.
Subsequently, as BTC prices declined again, OI fell rapidly, and skew weakened, DVOL rebounded from its lows. Around June 18, DVOL rose quickly above 42. Although it later retraced slightly, it remained largely in the 40–41 range, above the weekly low. The rebound in DVOL suggests that the market has not fully escaped high-volatility risks. Although prices did not experience a sharp decline comparable to previous periods, derivatives markets have already begun pricing in short-term volatility once again. The combination of weaker skew and higher DVOL reinforces the view that both protective demand and volatility premiums have recovered.
Overall, BTC is currently characterized by a combination of “low-level consolidation + rising volatility + weakening skew.” If prices continue to fluctuate within the $62,000–$66,000 range, DVOL may remain near 40. If BTC falls below $62,000, volatility could expand further.
5. Outlook
Data Sources:
- Investing, https://investing.com/currencies/xau-usd-historical-data
- Gate, https://www.gate.com/trade/BTC_USDT
- CMC, https://coinmarketcap.com/real-world-assets/?type=all-tokens
- Coinglass, https://www.coinglass.com/pro/depth-delta
- Dune, https://dune.com/gateresearch/gate-tradfi#weekly-volume
- Dune, https://dune.com/gateresearch/gate-institutional-weekly-report
- Bybit, https://www.bybit.com/future-activity/en/tradfi
- Bitget, https://www.bitgettradfi.com/tradfi/XAUUSD
- CryptoQuant, https://cryptoquant.com/asset/btc/chart/derivatives
- Amberdata, https://pro.amberdata.io/options/deribit/btc/current/
Gate Research is a comprehensive blockchain and cryptocurrency research platform that provides deep content for readers, including technical analysis, market insights, industry research, trend forecasting, and macroeconomic policy analysis.
Disclaimer
Investing in cryptocurrency markets involves high risk. Users are advised to conduct their own research and fully understand the nature of the assets and products before making any investment decisions. Gate is not responsible for any losses or damages arising from such decisions.