2025 ATRS Price Prediction: Analyzing Market Trends and Growth Potential for the Future
Introduction: ATRS's Market Position and Investment Value
Attarius Network (ATRS), as a platform designed to facilitate the transition from Web2 to Web3, has been simplifying blockchain integration since its inception. As of 2025, ATRS has a market capitalization of $10,243, with a circulating supply of approximately 9,653,204 tokens, and a price hovering around $0.0010611. This asset, often referred to as a "Web3 transition enabler," is playing an increasingly crucial role in helping developers, players, and NFT creators integrate blockchain technology.
This article will provide a comprehensive analysis of ATRS's price trends from 2025 to 2030, combining historical patterns, market supply and demand, ecosystem development, and macroeconomic factors to offer professional price predictions and practical investment strategies for investors.
I. ATRS Price History Review and Current Market Status
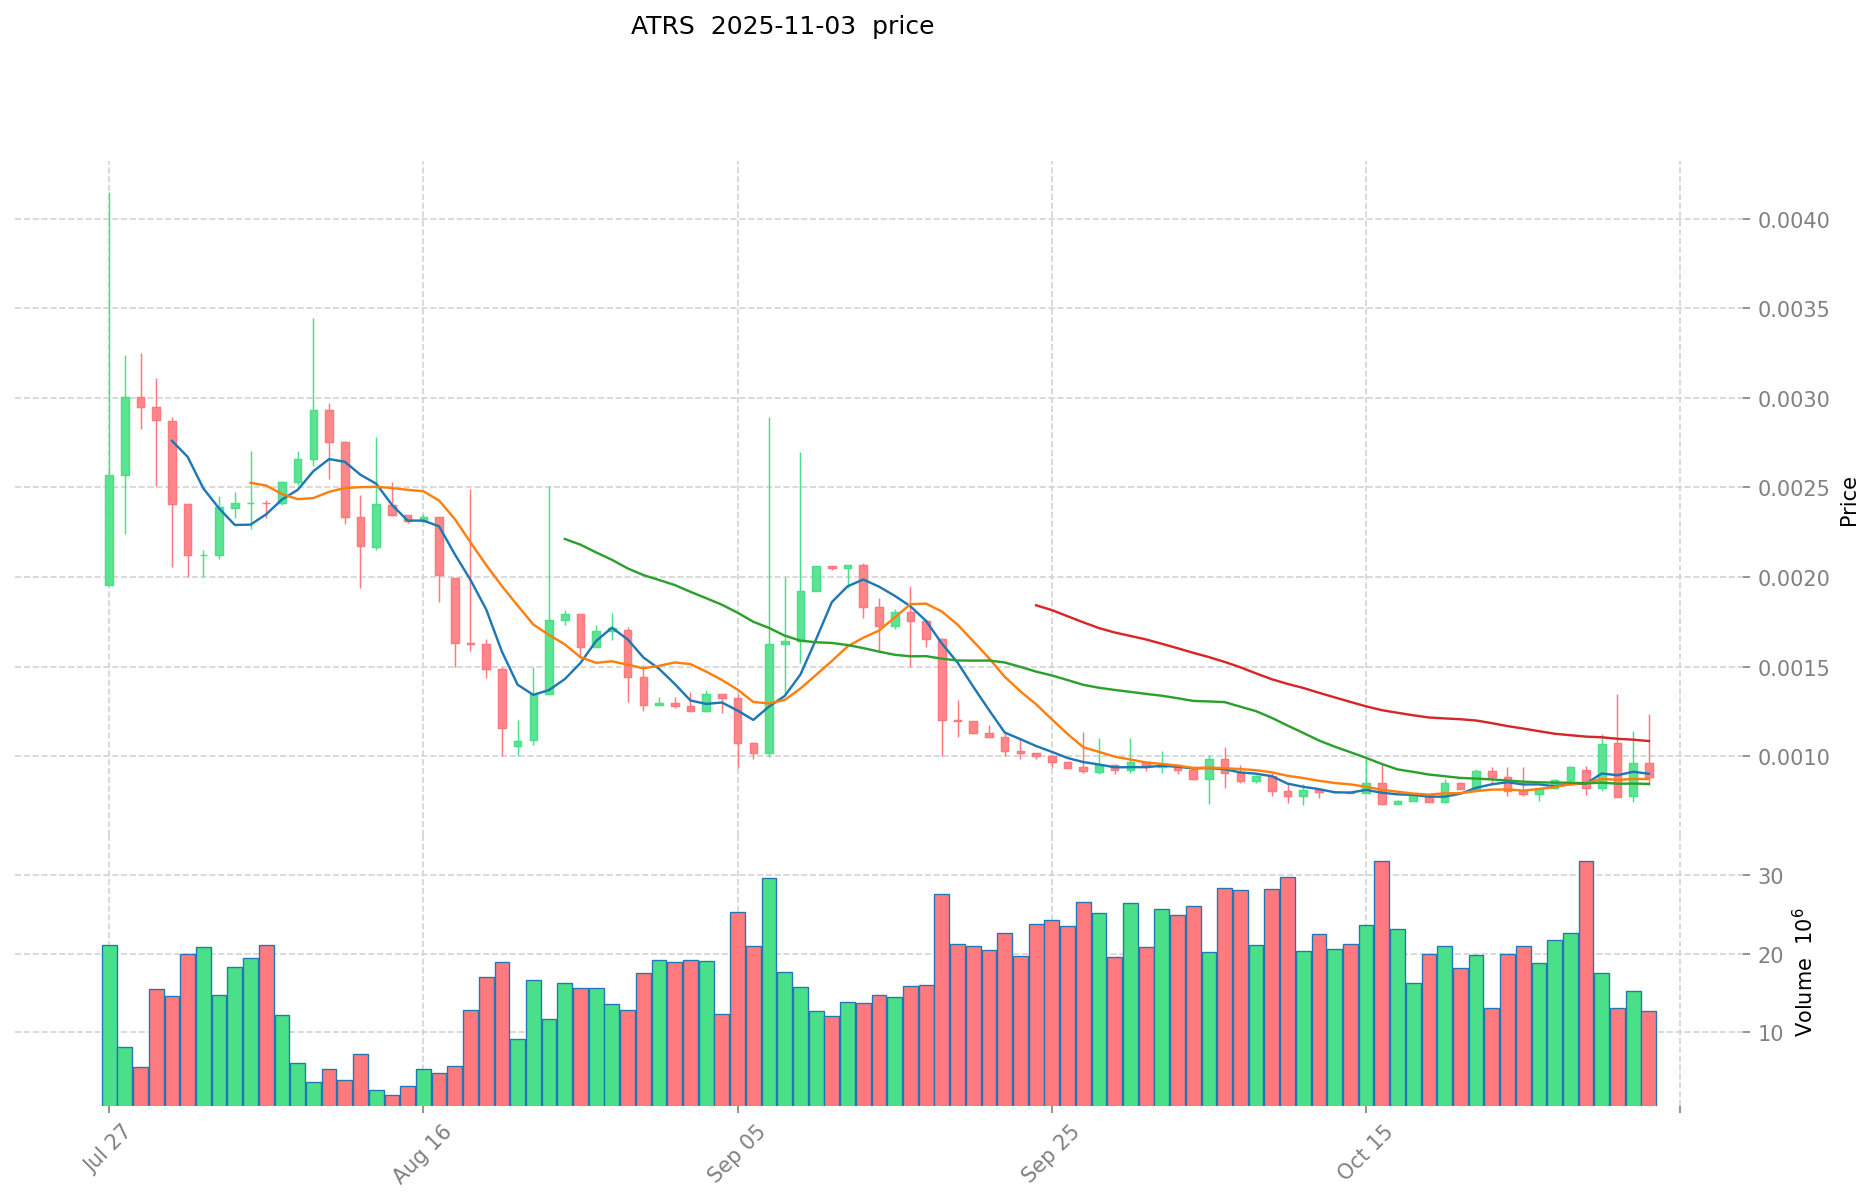
ATRS Historical Price Evolution
- 2024: ATRS reached its all-time high of $0.14888 on July 10, 2024
- 2025: ATRS hit its all-time low of $0.000334 on March 7, 2025
- 2025: Significant price recovery, with a 23.49% increase in the last 24 hours
ATRS Current Market Situation
ATRS is currently trading at $0.0010611, showing a strong 23.49% increase in the last 24 hours. The token has also demonstrated positive momentum over longer time frames, with 22.50% and 22.02% gains over the past 7 and 30 days, respectively. However, ATRS is still down 81.51% compared to its price one year ago.
The current market capitalization of ATRS stands at $10,243.01, with a circulating supply of 9,653,204 tokens. The 24-hour trading volume has reached $16,071.22, indicating moderate market activity. The fully diluted valuation of the project is $159,165.00, based on the maximum supply of 150,000,000 ATRS tokens.
Despite the recent positive price action, ATRS is still trading significantly below its all-time high of $0.14888, suggesting potential room for growth if market conditions remain favorable.
Click to view the current ATRS market price

ATRS Market Sentiment Indicator
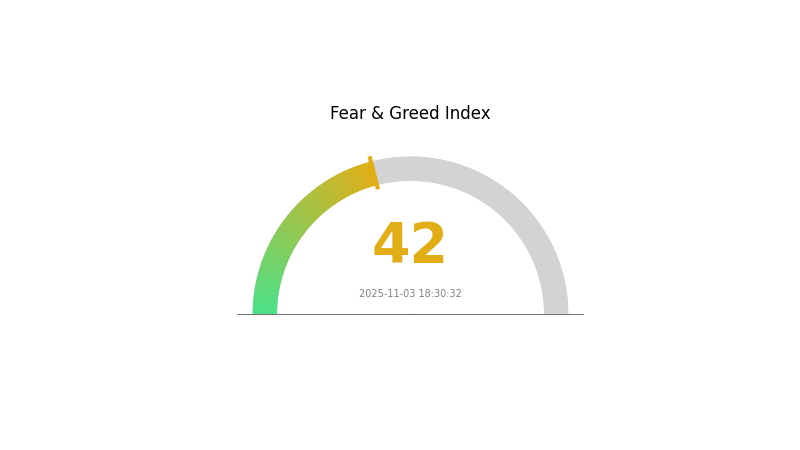
2025-11-03 Fear and Greed Index: 42 (Fear)
Click to view the current Fear & Greed Index
The crypto market sentiment remains cautious, with the Fear and Greed Index registering at 42, indicating a state of fear. This suggests that investors are currently more risk-averse, potentially creating opportunities for contrarian traders. However, it's crucial to remember that market sentiment can shift rapidly. Traders should stay informed, manage their risks wisely, and consider diversifying their portfolios. As always, thorough research and a well-thought-out strategy are essential in navigating the volatile crypto markets.

ATRS Holdings Distribution
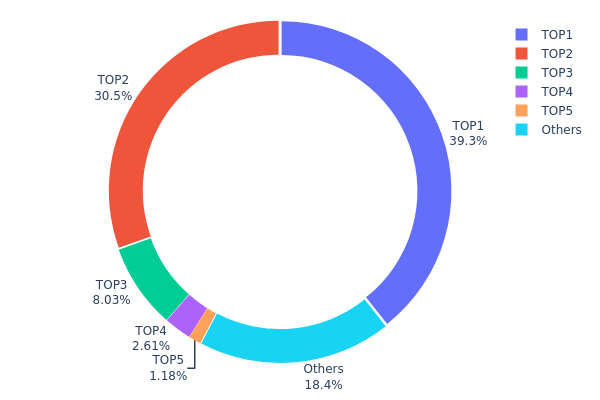
The address holdings distribution data for ATRS reveals a highly concentrated ownership structure. The top two addresses collectively hold nearly 70% of the total supply, with 39.32% and 30.48% respectively. This level of concentration raises concerns about potential market manipulation and price volatility.
Furthermore, the top five addresses account for over 81% of the total ATRS supply, leaving only 18.39% distributed among other holders. This skewed distribution suggests a low level of decentralization and could potentially impact market dynamics. Such concentration may lead to increased price fluctuations if large holders decide to buy or sell significant portions of their holdings.
While this concentration might provide some stability in terms of reduced circulating supply, it also poses risks to the overall market structure. The high concentration in a few addresses could potentially limit liquidity and make the token more susceptible to sudden price movements based on the actions of these major holders.
Click to view the current ATRS Holdings Distribution

| Top | Address | Holding Qty | Holding (%) |
|---|---|---|---|
| 1 | 0x0d07...b492fe | 58984.42K | 39.32% |
| 2 | 0xc882...84f071 | 45724.73K | 30.48% |
| 3 | 0x1156...75668c | 12045.84K | 8.03% |
| 4 | 0x2084...61369e | 3920.29K | 2.61% |
| 5 | 0xd7b1...b10175 | 1767.04K | 1.17% |
| - | Others | 27557.68K | 18.39% |
II. Key Factors Affecting ATRS Future Price
Macroeconomic Environment
-
Impact of Monetary Policy: Major central banks, especially the Federal Reserve, are expected to maintain tight monetary policies. Aggressive interest rate hikes leading to global liquidity tightening may directly impact ATRS price trends.
-
Inflation Hedging Properties: With core PCE inflation rates persistently above 2%, ATRS may be viewed as a potential hedge against inflation.
-
Geopolitical Factors: International situations and geopolitical events could influence ATRS price movements.
Technological Development and Ecosystem Building
- Ecosystem Applications: The growth of DApps and ecosystem projects built on ATRS could drive its adoption and value.
III. ATRS Price Prediction for 2025-2030
2025 Outlook
- Conservative prediction: $0.00101 - $0.00106
- Neutral prediction: $0.00106 - $0.00120
- Optimistic prediction: $0.00120 - $0.00135 (requires positive market sentiment and project developments)
2027-2028 Outlook
- Market phase expectation: Potential growth phase with increasing adoption
- Price range forecast:
- 2027: $0.00127 - $0.00198
- 2028: $0.00153 - $0.00218
- Key catalysts: Technological advancements, broader market trends, and increased utility of ATRS
2029-2030 Long-term Outlook
- Base scenario: $0.00194 - $0.00218 (assuming steady market growth and adoption)
- Optimistic scenario: $0.00218 - $0.00241 (with favorable market conditions and project success)
- Transformative scenario: $0.00241 - $0.00260 (with breakthrough innovations and mass adoption)
- 2030-12-31: ATRS $0.00226 (potential peak before year-end consolidation)
| 年份 | 预测最高价 | 预测平均价格 | 预测最低价 | 涨跌幅 |
|---|---|---|---|---|
| 2025 | 0.00135 | 0.00106 | 0.00101 | 0 |
| 2026 | 0.00164 | 0.00121 | 0.0008 | 13 |
| 2027 | 0.00198 | 0.00143 | 0.00127 | 34 |
| 2028 | 0.00218 | 0.0017 | 0.00153 | 60 |
| 2029 | 0.00241 | 0.00194 | 0.00103 | 83 |
| 2030 | 0.00226 | 0.00218 | 0.00163 | 104 |
IV. ATRS Professional Investment Strategies and Risk Management
ATRS Investment Methodology
(1) Long-term Holding Strategy
- Suitable for: Long-term investors and believers in Web3 technology
- Operation suggestions:
- Accumulate ATRS tokens during market dips
- Hold for at least 2-3 years to ride out market volatility
- Store tokens in a secure non-custodial wallet
(2) Active Trading Strategy
- Technical analysis tools:
- Moving Averages: Use to identify trends and potential entry/exit points
- Relative Strength Index (RSI): Gauge overbought/oversold conditions
- Key points for swing trading:
- Set clear stop-loss and take-profit levels
- Monitor market sentiment and project developments closely
ATRS Risk Management Framework
(1) Asset Allocation Principles
- Conservative investors: 1-3% of crypto portfolio
- Aggressive investors: 5-10% of crypto portfolio
- Professional investors: Up to 15% of crypto portfolio
(2) Risk Hedging Solutions
- Diversification: Balance ATRS with other crypto assets and traditional investments
- Stop-loss orders: Use to limit potential losses in volatile market conditions
(3) Secure Storage Solutions
- Hardware wallet recommendation: Gate Web3 Wallet
- Software wallet option: Official Attarius Wallet
- Security precautions: Enable two-factor authentication, use strong passwords, and regularly update software
V. Potential Risks and Challenges for ATRS
ATRS Market Risks
- High volatility: ATRS price may experience significant fluctuations
- Limited liquidity: Low trading volume may lead to slippage and difficulty in executing large orders
- Competition: Other Web3 integration platforms may gain market share
ATRS Regulatory Risks
- Uncertain regulatory landscape: Potential changes in cryptocurrency regulations could impact ATRS
- Cross-border compliance: Varying regulations across jurisdictions may limit adoption
- KYC/AML requirements: Stricter regulations may affect the ease of use for the Attarius platform
ATRS Technical Risks
- Smart contract vulnerabilities: Potential security flaws in the token contract
- Scalability challenges: The platform may face issues as user base grows
- Integration complexities: Difficulties in seamlessly connecting Web2 and Web3 technologies
VI. Conclusion and Action Recommendations
ATRS Investment Value Assessment
Attarius Network (ATRS) presents a unique value proposition in facilitating the transition from Web2 to Web3. While it shows potential for long-term growth, investors should be aware of short-term volatility and the nascent state of the Web3 ecosystem.
ATRS Investment Recommendations
✅ Beginners: Start with small, regular investments to gain exposure ✅ Experienced investors: Consider a moderate allocation based on risk tolerance ✅ Institutional investors: Evaluate ATRS as part of a diversified Web3 portfolio
ATRS Trading Participation Methods
- Spot trading: Purchase ATRS tokens on Gate.com
- DCA strategy: Set up recurring buys to average out price volatility
- Staking: Participate in any available staking programs to earn passive income
Cryptocurrency investments carry extremely high risks, and this article does not constitute investment advice. Investors should make decisions based on their own risk tolerance and are advised to consult professional financial advisors. Never invest more than you can afford to lose.
FAQ
Is Tarsus stock considered a good investment?
Tarsus stock shows potential but timing is crucial. Its solid financials and long cash runway are positive, yet near-term growth prospects are limited.
Should I sell my Aurora Innovation stock?
Based on recent data, selling Aurora Innovation stock may be advisable. The stock price fell by 1.92% recently, and it shows negative signals from both short-term and long-term moving averages.
Is Athira Pharma a good stock to buy?
Athira Pharma shows mixed potential. It has a C Momentum Grade, but uncertain long-term growth. Consider current market trends before investing.
Is AT&T stock expected to rise?
Based on current market trends and analyst forecasts, AT&T stock is expected to show moderate growth in the coming months. Positive factors include 5G expansion and strong service revenue.
Share
Content