2025 FALCONS Price Prediction: Will This Crypto Soar or Crash in the Next Bull Run?
Introduction: FALCONS' Market Position and Investment Value
Falcons Inu (FALCONS), positioned as a meme-inspired token with metaverse aspirations, has been making waves in the crypto space since its inception. As of 2025, FALCONS has a market capitalization of $17,891.99, with a circulating supply of approximately 289,000,000 tokens, and is trading at around $0.00006191. This asset, dubbed the "Falcon of Memes," is playing an increasingly crucial role in the realms of NFTs and gaming experiences within its ecosystem.
This article will provide a comprehensive analysis of FALCONS' price trends from 2025 to 2030, considering historical patterns, market supply and demand, ecosystem development, and macroeconomic factors to offer professional price predictions and practical investment strategies for investors.
I. FALCONS Price History Review and Current Market Status
FALCONS Historical Price Evolution
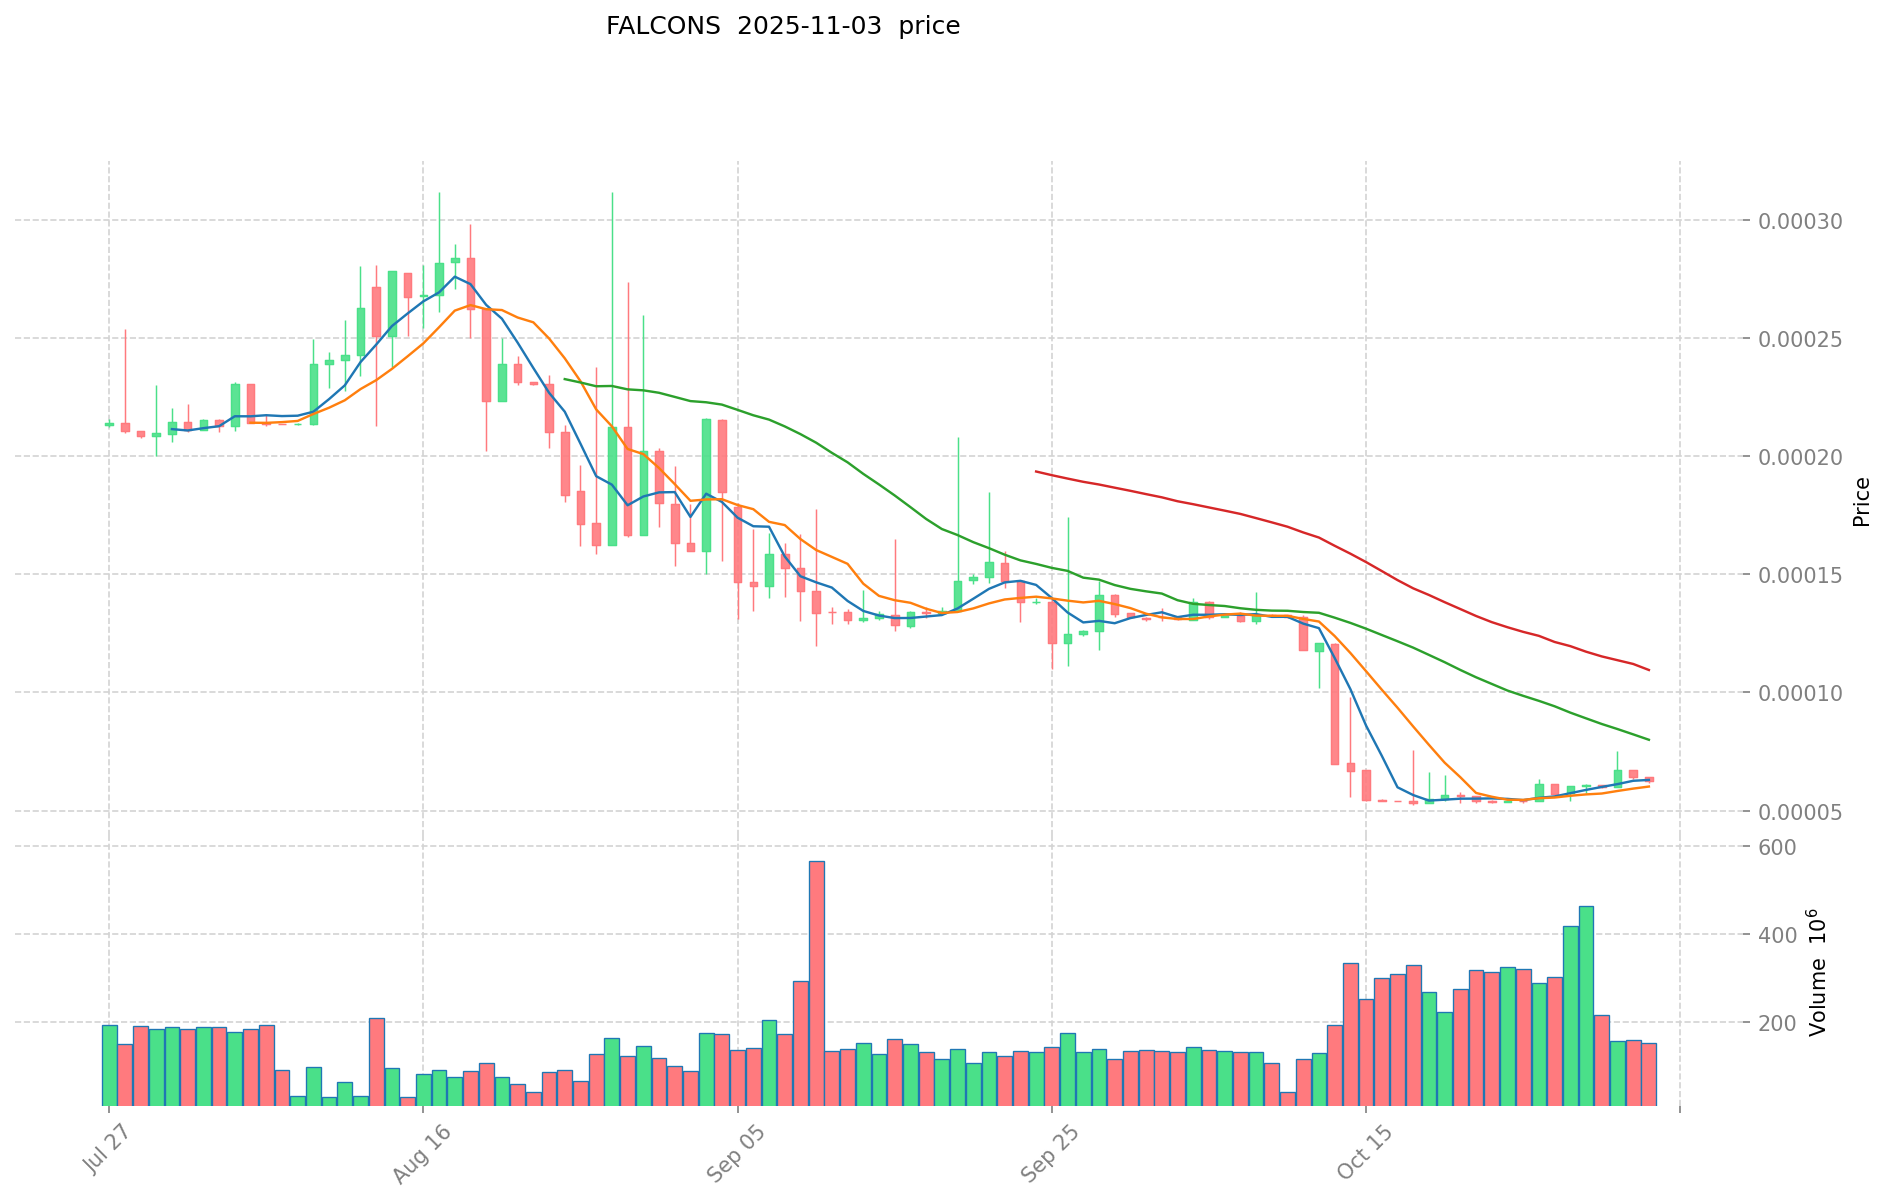
- June 2025: FALCONS reached its all-time high of $0.00059855, marking a significant milestone for the project.
- January 2025: The token hit its all-time low of $0.00004472, presenting a challenging period for investors.
FALCONS Current Market Situation
As of November 3, 2025, FALCONS is trading at $0.00006191. The token has experienced a 2.93% decrease in the last 24 hours, with a trading volume of $9,391.82. The current market capitalization stands at $17,891.99, ranking FALCONS at 6852 in the overall cryptocurrency market.
The token has shown mixed performance across different timeframes. While it has seen a slight increase of 0.64% over the past week, it has experienced significant declines of 53.13% in the last 30 days and 45.23% over the past year. The current price represents a 89.65% decrease from its all-time high and a 38.44% increase from its all-time low.
The market sentiment for FALCONS appears cautious, with the current price being closer to its all-time low than its all-time high. The token's circulating supply is 289,000,000 FALCONS, which is 28.9% of its maximum supply of 1,000,000,000 tokens.
Click to view the current FALCONS market price
FALCONS Market Sentiment Indicator
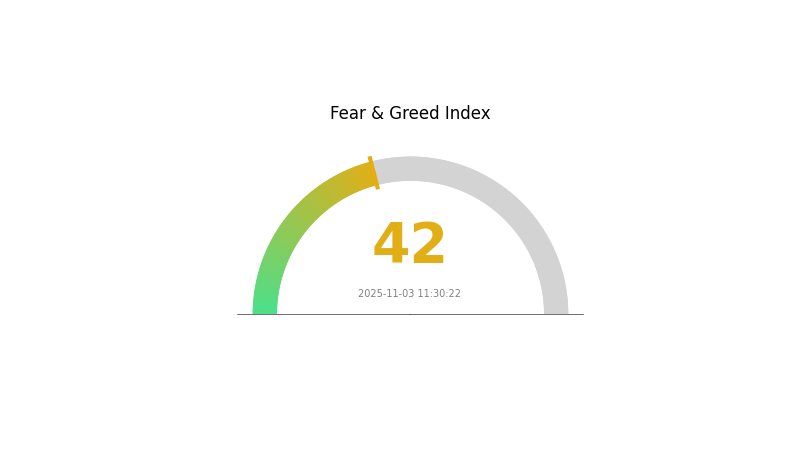
2025-11-03 Fear and Greed Index: 42 (Fear)
Click to view the current Fear & Greed Index
The crypto market is currently experiencing a period of fear, with the sentiment index at 42. This suggests investors are becoming more cautious and risk-averse. During such times, it's crucial to stay informed and make rational decisions. While fear can present buying opportunities for some, it's essential to conduct thorough research and manage risks carefully. Remember, market sentiment can shift quickly, so stay vigilant and adjust your strategy accordingly.
FALCONS Holdings Distribution
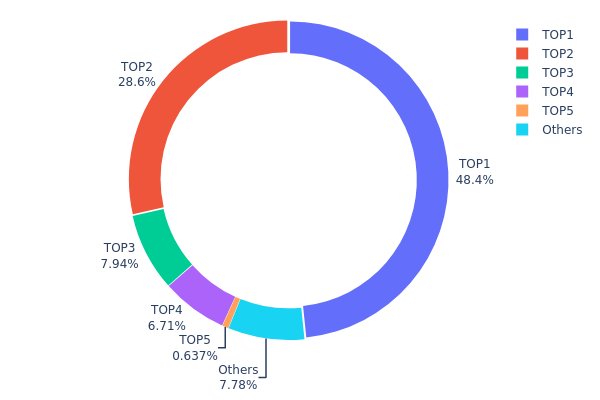
The address holdings distribution data provides crucial insights into the concentration of FALCONS tokens across different wallet addresses. Analysis of this data reveals a highly centralized distribution pattern, with the top 5 addresses controlling 92.19% of the total supply. The largest holder alone accounts for 48.36% of all tokens, followed by a second address holding 28.57%.
This concentration level raises concerns about potential market manipulation and price volatility. With such a significant portion of tokens held by a few addresses, large-scale transactions could have outsized impacts on market dynamics. The high concentration also suggests a lower degree of decentralization, which may affect the overall stability and resilience of the FALCONS ecosystem.
Furthermore, this distribution pattern indicates that FALCONS' on-chain structure may be vulnerable to sudden shifts if any of the top holders decide to liquidate their positions. Investors and market participants should be aware of these structural characteristics when assessing the token's market behavior and potential risks.
Click to view the current FALCONS Holdings Distribution
| Top | Address | Holding Qty | Holding (%) |
|---|---|---|---|
| 1 | 0x0d07...b492fe | 338564.89K | 48.36% |
| 2 | 0x334a...e69c84 | 200008.44K | 28.57% |
| 3 | 0xfca8...e3e6fe | 55554.00K | 7.93% |
| 4 | 0xeacb...2b3f10 | 46969.91K | 6.70% |
| 5 | 0x2bab...be8a30 | 4455.88K | 0.63% |
| - | Others | 54446.87K | 7.81% |
II. Key Factors Influencing FALCONS' Future Price
Market Sentiment
- Investor Confidence: Investor sentiment and confidence have a direct impact on FALCONS price trends. When the market receives news about FALCONS being widely adopted, it can significantly influence price movements.
Macroeconomic Environment
- Regulatory Changes: Regulatory changes can have a substantial impact on FALCONS' price. As the cryptocurrency market evolves, new regulations may affect its adoption and trading.
Technical Development and Ecosystem Building
-
Technology Advancements: Ongoing technological developments in FALCONS can influence its price. Improvements in scalability, security, or functionality may increase its value proposition.
-
Market Adoption: The level of acceptance and adoption of FALCONS in various sectors can drive its price. Increased use cases and integration into mainstream applications may positively impact its value.
III. FALCONS Price Prediction for 2025-2030
2025 Outlook
- Conservative prediction: $0.00005 - $0.00006
- Neutral prediction: $0.00006
- Optimistic prediction: $0.00007 (requires favorable market conditions)
2026-2028 Outlook
- Market stage expectation: Gradual growth with potential volatility
- Price range forecast:
- 2026: $0.00004 - $0.00008
- 2027: $0.00005 - $0.00008
- 2028: $0.00004 - $0.00011
- Key catalysts: Increased adoption, technological advancements, market sentiment
2029-2030 Long-term Outlook
- Base scenario: $0.00008 - $0.00010 (assuming steady market growth)
- Optimistic scenario: $0.00010 - $0.00012 (assuming strong market performance)
- Transformative scenario: $0.00012+ (under extremely favorable conditions)
- 2030-12-31: FALCONS $0.00012 (potential peak price)
| 年份 | 预测最高价 | 预测平均价格 | 预测最低价 | 涨跌幅 |
|---|---|---|---|---|
| 2025 | 0.00007 | 0.00006 | 0.00005 | 0 |
| 2026 | 0.00008 | 0.00007 | 0.00004 | 9 |
| 2027 | 0.00008 | 0.00007 | 0.00005 | 18 |
| 2028 | 0.00011 | 0.00008 | 0.00004 | 23 |
| 2029 | 0.00011 | 0.00009 | 0.00008 | 47 |
| 2030 | 0.00012 | 0.0001 | 0.00009 | 66 |
IV. FALCONS Professional Investment Strategy and Risk Management
FALCONS Investment Methodology
(1) Long-term Holding Strategy
- Suitable for: Investors with high risk tolerance and belief in meme coins
- Operation suggestions:
- Accumulate FALCONS during market dips
- Hold for at least 1-2 years to ride out market volatility
- Store in a secure non-custodial wallet
(2) Active Trading Strategy
- Technical analysis tools:
- Relative Strength Index (RSI): Monitor overbought/oversold conditions
- Moving Averages: Identify trend directions and potential reversals
- Key points for swing trading:
- Set strict stop-loss orders to limit potential losses
- Take profits at predetermined price targets
FALCONS Risk Management Framework
(1) Asset Allocation Principles
- Conservative investors: 1-2% of crypto portfolio
- Aggressive investors: 5-10% of crypto portfolio
- Professional investors: Up to 15% of crypto portfolio
(2) Risk Hedging Solutions
- Diversification: Spread investments across multiple meme coins and other crypto assets
- Stop-loss orders: Implement automatic sell orders to limit potential losses
(3) Secure Storage Solutions
- Hot wallet recommendation: Gate Web3 Wallet
- Cold storage solution: Hardware wallet for long-term holdings
- Security precautions: Enable two-factor authentication, use strong passwords, and be cautious of phishing attempts
V. FALCONS Potential Risks and Challenges
FALCONS Market Risks
- High volatility: Meme coins are subject to extreme price swings
- Sentiment-driven: Price heavily influenced by social media trends and celebrity endorsements
- Lack of fundamental value: No inherent utility beyond speculation
FALCONS Regulatory Risks
- Potential crackdowns: Increased scrutiny of meme coins by financial regulators
- Compliance issues: Possible delisting from exchanges due to regulatory concerns
- Tax implications: Unclear tax treatment in many jurisdictions
FALCONS Technical Risks
- Smart contract vulnerabilities: Potential for exploits in the underlying code
- Network congestion: High transaction fees and delays during peak trading periods
- Centralization concerns: Potential for large holders to manipulate the market
VI. Conclusion and Action Recommendations
FALCONS Investment Value Assessment
FALCONS presents a high-risk, high-reward opportunity in the meme coin space. While it offers potential for significant short-term gains, it lacks fundamental value and faces numerous regulatory and market risks.
FALCONS Investment Recommendations
✅ Beginners: Limit exposure to a small percentage of overall portfolio, if any ✅ Experienced investors: Consider small allocations as part of a diversified crypto strategy ✅ Institutional investors: Approach with extreme caution, only suitable for high-risk portfolios
FALCONS Trading Participation Methods
- Spot trading: Buy and sell FALCONS on Gate.com
- Staking: Participate in staking programs if offered by the project
- NFT integration: Explore potential NFT offerings within the Falcons ecosystem
Cryptocurrency investments carry extremely high risk, and this article does not constitute investment advice. Investors should make decisions based on their own risk tolerance and are advised to consult professional financial advisors. Never invest more than you can afford to lose.
FAQ
Will ACH reach $1?
ACH reaching $1 is possible but uncertain. It depends on market conditions and project growth. Current projections suggest it could happen, but no definitive prediction can be made.
Can Coti reach $10?
Yes, COTI could potentially reach $10. With advancements in privacy, Ethereum Layer 2 integration, and increased market adoption, COTI has strong growth catalysts. Current projections suggest this price target is feasible in a bullish scenario.
Will ICP reach $1000?
While ICP's current price is around $5.66, reaching $1000 would require a 175x increase. It's ambitious but possible in the long term given ICP's potential and market volatility.
What crypto has the highest price prediction?
Bitcoin has the highest price prediction. Analysts expect BTC to reach new all-time highs by 2025 due to increased adoption and institutional investment.
Share
Content
Introduction: FALCONS' Market Position and Investment Value
I. FALCONS Price History Review and Current Market Status
II. Key Factors Influencing FALCONS' Future Price
III. FALCONS Price Prediction for 2025-2030
IV. FALCONS Professional Investment Strategy and Risk Management
V. FALCONS Potential Risks and Challenges
VI. Conclusion and Action Recommendations
FAQ

