2025 MART Price Prediction: Analyzing Market Trends and Future Prospects for the Digital Asset
Introduction: MART's Market Position and Investment Value
ArtMeta (MART), as a platform connecting art galleries, artists, and collectors in a digital world, has been making strides in the NFT market since its inception. As of 2025, ArtMeta's market capitalization stands at $9,652.21, with a circulating supply of approximately 3,458,333 tokens, and a price hovering around $0.002791. This asset, often referred to as a "bridge between fine art and crypto," is playing an increasingly crucial role in the digital art and NFT sectors.
This article will provide a comprehensive analysis of ArtMeta's price trends from 2025 to 2030, considering historical patterns, market supply and demand, ecosystem development, and macroeconomic factors, to offer professional price predictions and practical investment strategies for investors.
I. MART Price History Review and Current Market Status
MART Historical Price Evolution
- 2022: All-time high reached, price peaked at $0.380768 on July 14
- 2023-2024: Market fluctuations, price experienced significant volatility
- 2025: Bearish trend, price dropped to an all-time low of $0.00129817 on April 7
MART Current Market Situation
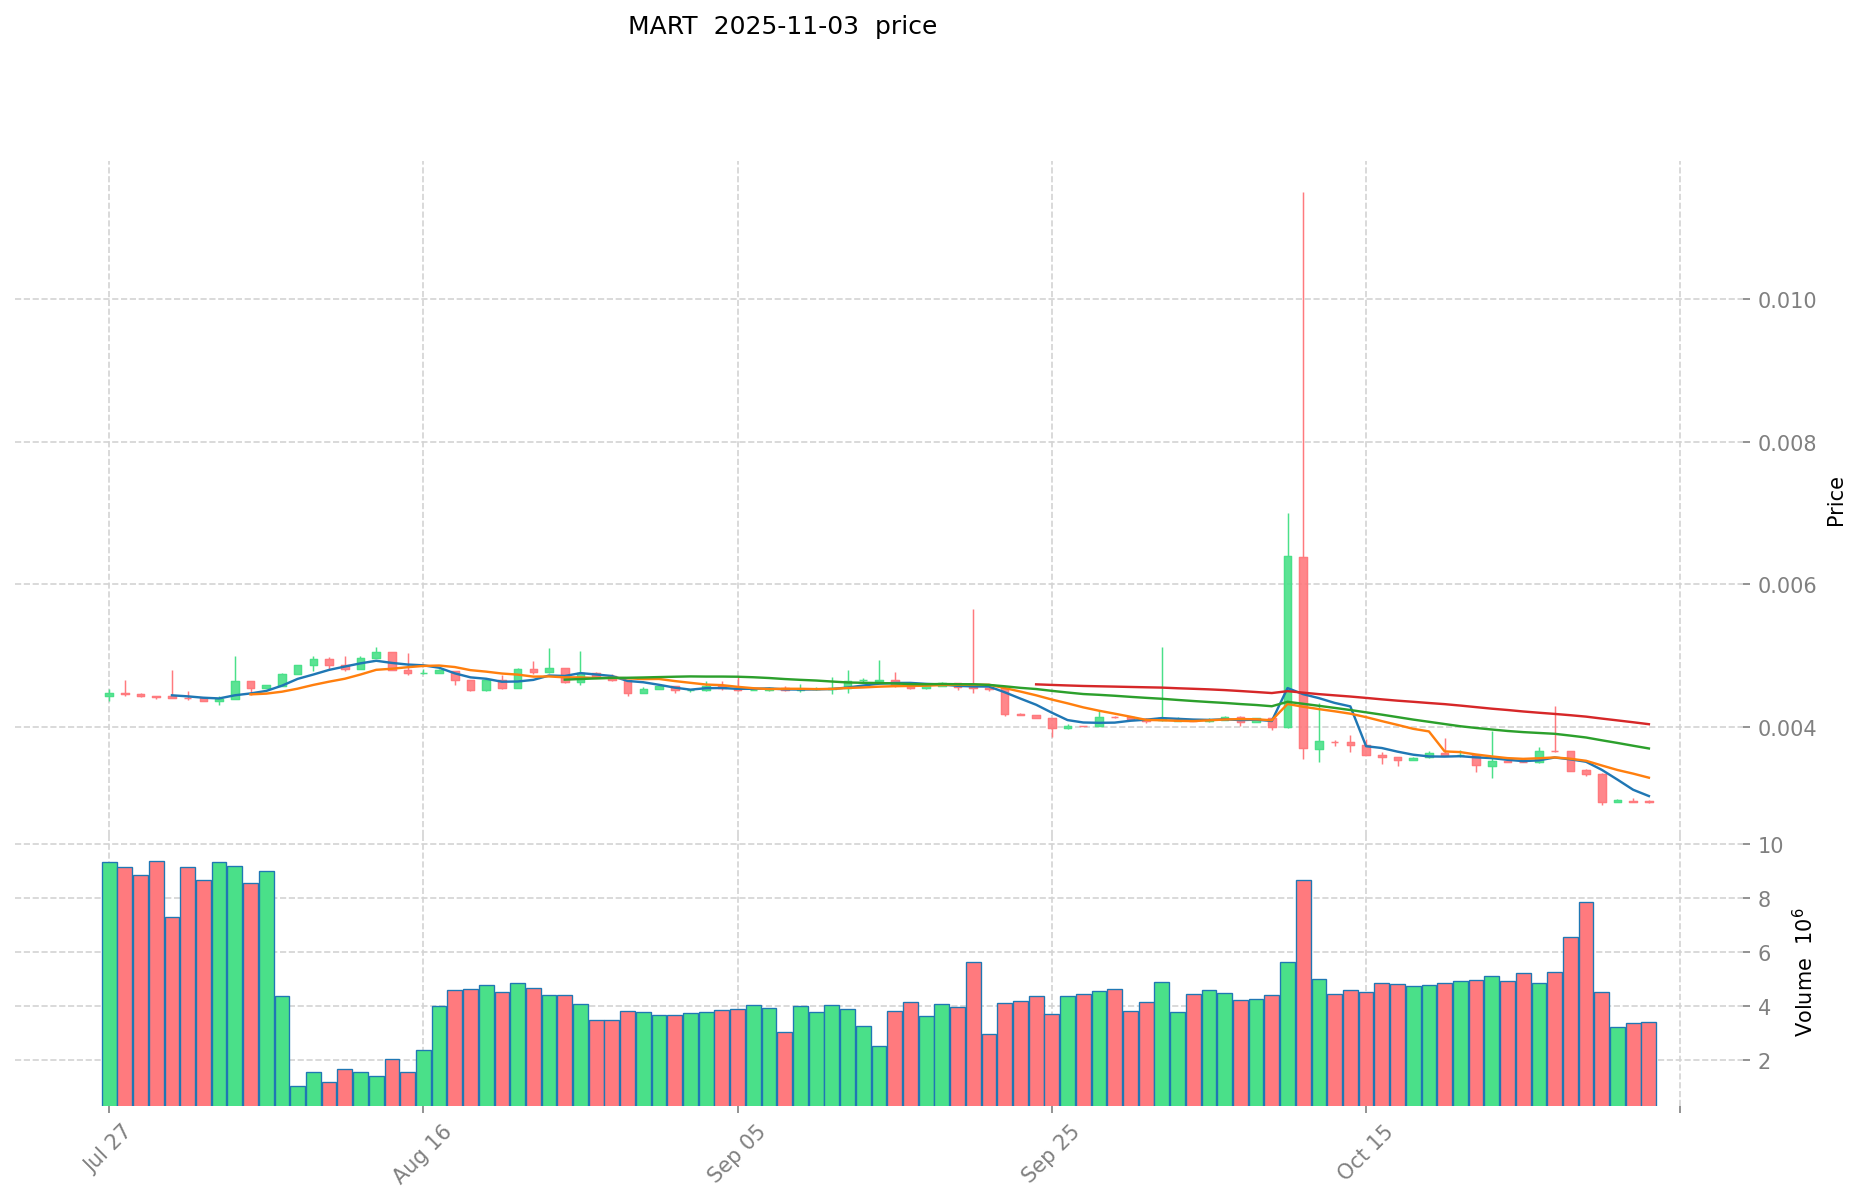
As of November 4, 2025, MART is trading at $0.002791, showing a 24-hour decline of 6.07%. The token has experienced significant downward pressure over various timeframes, with a 7-day decrease of 25.19% and a 30-day drop of 32%. The current price represents a 99.27% decline from its all-time high, while it has risen 115.07% from its all-time low. MART's market capitalization stands at $9,652.21, ranking it 7353rd in the cryptocurrency market. The circulating supply is 3,458,333 MART, which is 3.46% of the total supply of 100,000,000 tokens. Trading volume in the last 24 hours reached $10,026.06, indicating moderate market activity. The overall market sentiment appears bearish, with the token experiencing consistent declines across multiple time horizons.
Click to view the current MART market price

MART Market Sentiment Indicator
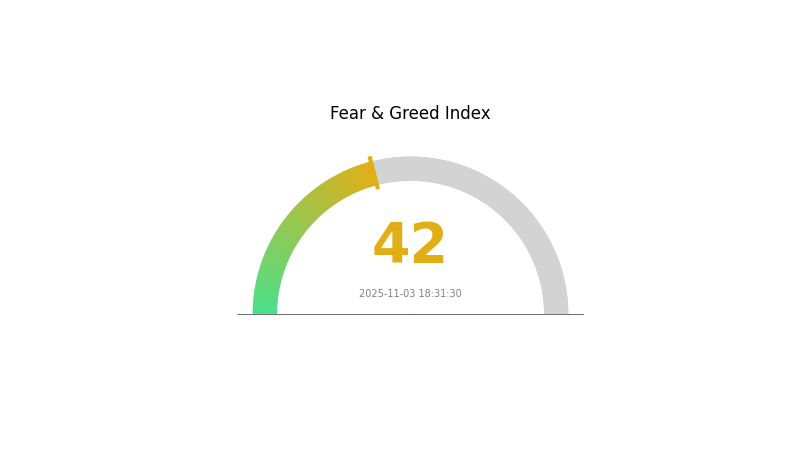
2025-11-03 Fear and Greed Index: 42 (Fear)
Click to view the current Fear & Greed Index
The crypto market sentiment remains cautious as the Fear and Greed Index stands at 42, indicating a state of fear. This suggests investors are still hesitant and risk-averse. During such periods, it's crucial to stay informed and avoid making impulsive decisions. While some may see this as a potential buying opportunity, it's essential to conduct thorough research and consider your risk tolerance. Remember, market sentiment can shift quickly, so keeping a close eye on the index and other market indicators is advisable for making informed investment choices.

MART Holdings Distribution
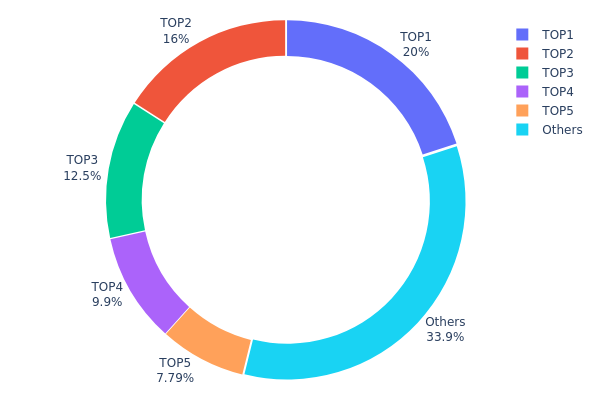
The address holdings distribution chart for MART reveals a notably concentrated ownership structure. The top 5 addresses collectively hold 66.12% of the total supply, with the largest holder possessing 20% of all tokens. This high concentration suggests a potentially oligopolistic market structure, where a small number of large holders could exert significant influence over price movements and market dynamics.
Such a concentrated distribution raises concerns about market volatility and manipulation risks. The top holders have the capacity to impact prices substantially through large buy or sell orders. This concentration also implies a lower degree of decentralization, which may be at odds with the ethos of many cryptocurrency projects. However, it's worth noting that 33.88% of tokens are distributed among smaller holders, providing some counterbalance to the top addresses.
From a market stability perspective, this distribution pattern indicates a potentially fragile ecosystem. Any significant moves by the top holders could trigger cascading effects on MART's price and liquidity. Investors and traders should be aware of this concentration when considering their positions in MART, as it may contribute to heightened price volatility and reduced market depth.
Click to view the current MART Holdings Distribution

| Top | Address | Holding Qty | Holding (%) |
|---|---|---|---|
| 1 | 0x5e5b...c6a974 | 20000.00K | 20.00% |
| 2 | 0xedf7...3f804b | 15987.50K | 15.98% |
| 3 | 0x9c91...8c50ce | 12454.75K | 12.45% |
| 4 | 0xbe9e...ffb634 | 9900.00K | 9.90% |
| 5 | 0x04bb...d9cfe8 | 7791.63K | 7.79% |
| - | Others | 33865.86K | 33.88% |
II. Key Factors Influencing MART's Future Price
Supply Mechanism
- IP Ecosystem: A tiered system of proprietary, exclusive, and non-exclusive IPs diversifies income and mitigates risk.
- Historical Pattern: Successful IP iterations and new launches have historically driven growth.
- Current Impact: New IP releases and collaborations are expected to boost sales and market expansion.
Institutional and Major Player Dynamics
- Institutional Holdings: Major financial institutions have shown optimistic outlooks, with price targets ranging from HK$200 to HK$204.
- Corporate Adoption: Collaborations with Disney, Marvel, and other major brands have expanded POP MART's market reach.
- National Policies: New EU toy safety directives may increase compliance costs by about 30 million yuan annually.
Macroeconomic Environment
- Monetary Policy Impact: Global central bank policies, particularly in major markets like the US and China, will influence consumer spending power.
- Inflation Hedging Properties: POP MART's products may serve as emotional investments during inflationary periods.
- Geopolitical Factors: US-China trade tensions, including potential tariffs, could impact 5-6% of net profits.
Technological Development and Ecosystem Building
- AR Virtual Try-On: Enhancing interactive experiences, driving engagement and sales.
- Blockchain Digital Collectibles: NFT offerings have seen over 300% premiums, opening new revenue streams.
- Ecosystem Applications: The "Dream Home" mobile game reached 800,000 daily active users in 2024, expanding the brand's digital presence.
III. MART Price Prediction for 2025-2030
2025 Outlook
- Conservative prediction: $0.00198 - $0.00248
- Neutral prediction: $0.00248 - $0.00278
- Optimistic prediction: $0.00278 - $0.00298 (requires positive market sentiment)
2027-2028 Outlook
- Market phase expectation: Potential growth phase
- Price range forecast:
- 2027: $0.00275 - $0.00364
- 2028: $0.00337 - $0.00435
- Key catalysts: Increased adoption and technological advancements
2030 Long-term Outlook
- Base scenario: $0.00391 - $0.00461 (assuming steady market growth)
- Optimistic scenario: $0.00461 - $0.00561 (assuming strong market performance)
- Transformative scenario: $0.00561+ (under extremely favorable conditions)
- 2030-12-31: MART $0.00561 (potential peak)
| 年份 | 预测最高价 | 预测平均价格 | 预测最低价 | 涨跌幅 |
|---|---|---|---|---|
| 2025 | 0.00298 | 0.00278 | 0.00198 | 0 |
| 2026 | 0.00374 | 0.00288 | 0.00193 | 3 |
| 2027 | 0.00364 | 0.00331 | 0.00275 | 19 |
| 2028 | 0.00435 | 0.00348 | 0.00337 | 24 |
| 2029 | 0.00446 | 0.00391 | 0.00321 | 40 |
| 2030 | 0.00561 | 0.00419 | 0.0031 | 50 |
IV. MART Professional Investment Strategies and Risk Management
MART Investment Methodology
(1) Long-term Holding Strategy
- Suitable for: Long-term investors and NFT art enthusiasts
- Operation suggestions:
- Accumulate MART tokens during market dips
- Stay informed about ArtMeta platform developments
- Store tokens in a secure hardware wallet
(2) Active Trading Strategy
- Technical analysis tools:
- Moving Averages: Use to identify trends and potential reversal points
- RSI (Relative Strength Index): Monitor overbought/oversold conditions
- Key points for swing trading:
- Set clear entry and exit points based on technical indicators
- Monitor NFT market trends and their impact on MART token value
MART Risk Management Framework
(1) Asset Allocation Principles
- Conservative investors: 1-3% of crypto portfolio
- Moderate investors: 3-5% of crypto portfolio
- Aggressive investors: 5-10% of crypto portfolio
(2) Risk Hedging Solutions
- Diversification: Spread investments across different NFT and metaverse projects
- Stop-loss orders: Implement to limit potential losses
(3) Secure Storage Solutions
- Hot wallet recommendation: Gate Web3 Wallet
- Cold storage solution: Transfer to a hardware wallet for long-term holding
- Security precautions: Enable two-factor authentication, use strong passwords
V. Potential Risks and Challenges for MART
MART Market Risks
- Volatility: High price fluctuations common in small-cap tokens
- Liquidity: Limited trading volume may impact ease of buying/selling
- Competition: Emerging NFT and metaverse projects may impact market share
MART Regulatory Risks
- NFT regulations: Potential changes in NFT classification and taxation
- Cryptocurrency regulations: Evolving global regulatory landscape
- Art market regulations: Compliance with existing and future art-related laws
MART Technical Risks
- Smart contract vulnerabilities: Potential for exploits or bugs
- Scalability issues: Challenges in handling increased network traffic
- Interoperability: Compatibility with other blockchain networks and NFT standards
VI. Conclusion and Action Recommendations
MART Investment Value Assessment
MART presents a unique opportunity in the NFT and digital art space, with potential for long-term growth. However, it faces significant short-term volatility and adoption challenges.
MART Investment Recommendations
✅ Beginners: Start with small positions, focus on learning about NFTs and digital art markets ✅ Experienced investors: Consider a balanced approach, allocating based on risk tolerance ✅ Institutional investors: Evaluate MART as part of a broader NFT and metaverse investment strategy
MART Trading Participation Methods
- Spot trading: Buy and sell MART tokens on Gate.com
- Staking: Participate in staking programs if offered by ArtMeta
- NFT purchases: Use MART tokens to acquire digital art on the ArtMeta platform
Cryptocurrency investments carry extremely high risks, and this article does not constitute investment advice. Investors should make decisions carefully based on their own risk tolerance and are advised to consult professional financial advisors. Never invest more than you can afford to lose.
FAQ
How high can MARA go?
MARA could potentially reach $125-$188, based on its historical 2-3X correlation with Bitcoin price increases.
What is the MARA target price in 2025?
Based on market analysis, the MARA target price in 2025 is projected to be $27.65 on average, with a potential range from $21.21 to $34.10.
What is the 12 month forecast for Moderna stock?
Based on analyst estimates, the 12-month forecast for Moderna stock averages around $206.72, with projections ranging from $100 to $270 by September 2025.
What is MARA 12 month price target?
Based on analyst projections, the average 12-month price target for MARA is $23.87, with estimates ranging from $18 to $34.
Share
Content