DOAI vs ETH: The Battle for Blockchain Supremacy in Decentralized Applications
Introduction: Investment Comparison between DOAI and ETH
In the cryptocurrency market, the comparison between DOAI vs ETH has always been an unavoidable topic for investors. The two not only have significant differences in market cap ranking, application scenarios, and price performance, but also represent different positioning in crypto assets.
DOAI (DOAI): Since its launch, it has gained market recognition for its focus on AI data monetization and GPU training.
Ethereum (ETH): Since 2015, it has been hailed as the foundation for decentralized applications and smart contracts, and is one of the cryptocurrencies with the highest global trading volume and market capitalization.
This article will comprehensively analyze the investment value comparison between DOAI vs ETH, focusing on historical price trends, supply mechanisms, institutional adoption, technological ecosystems, and future predictions, and attempt to answer the question investors care about most:
"Which is the better buy right now?"
I. Price History Comparison and Current Market Status
DOAI and ETH Historical Price Trends
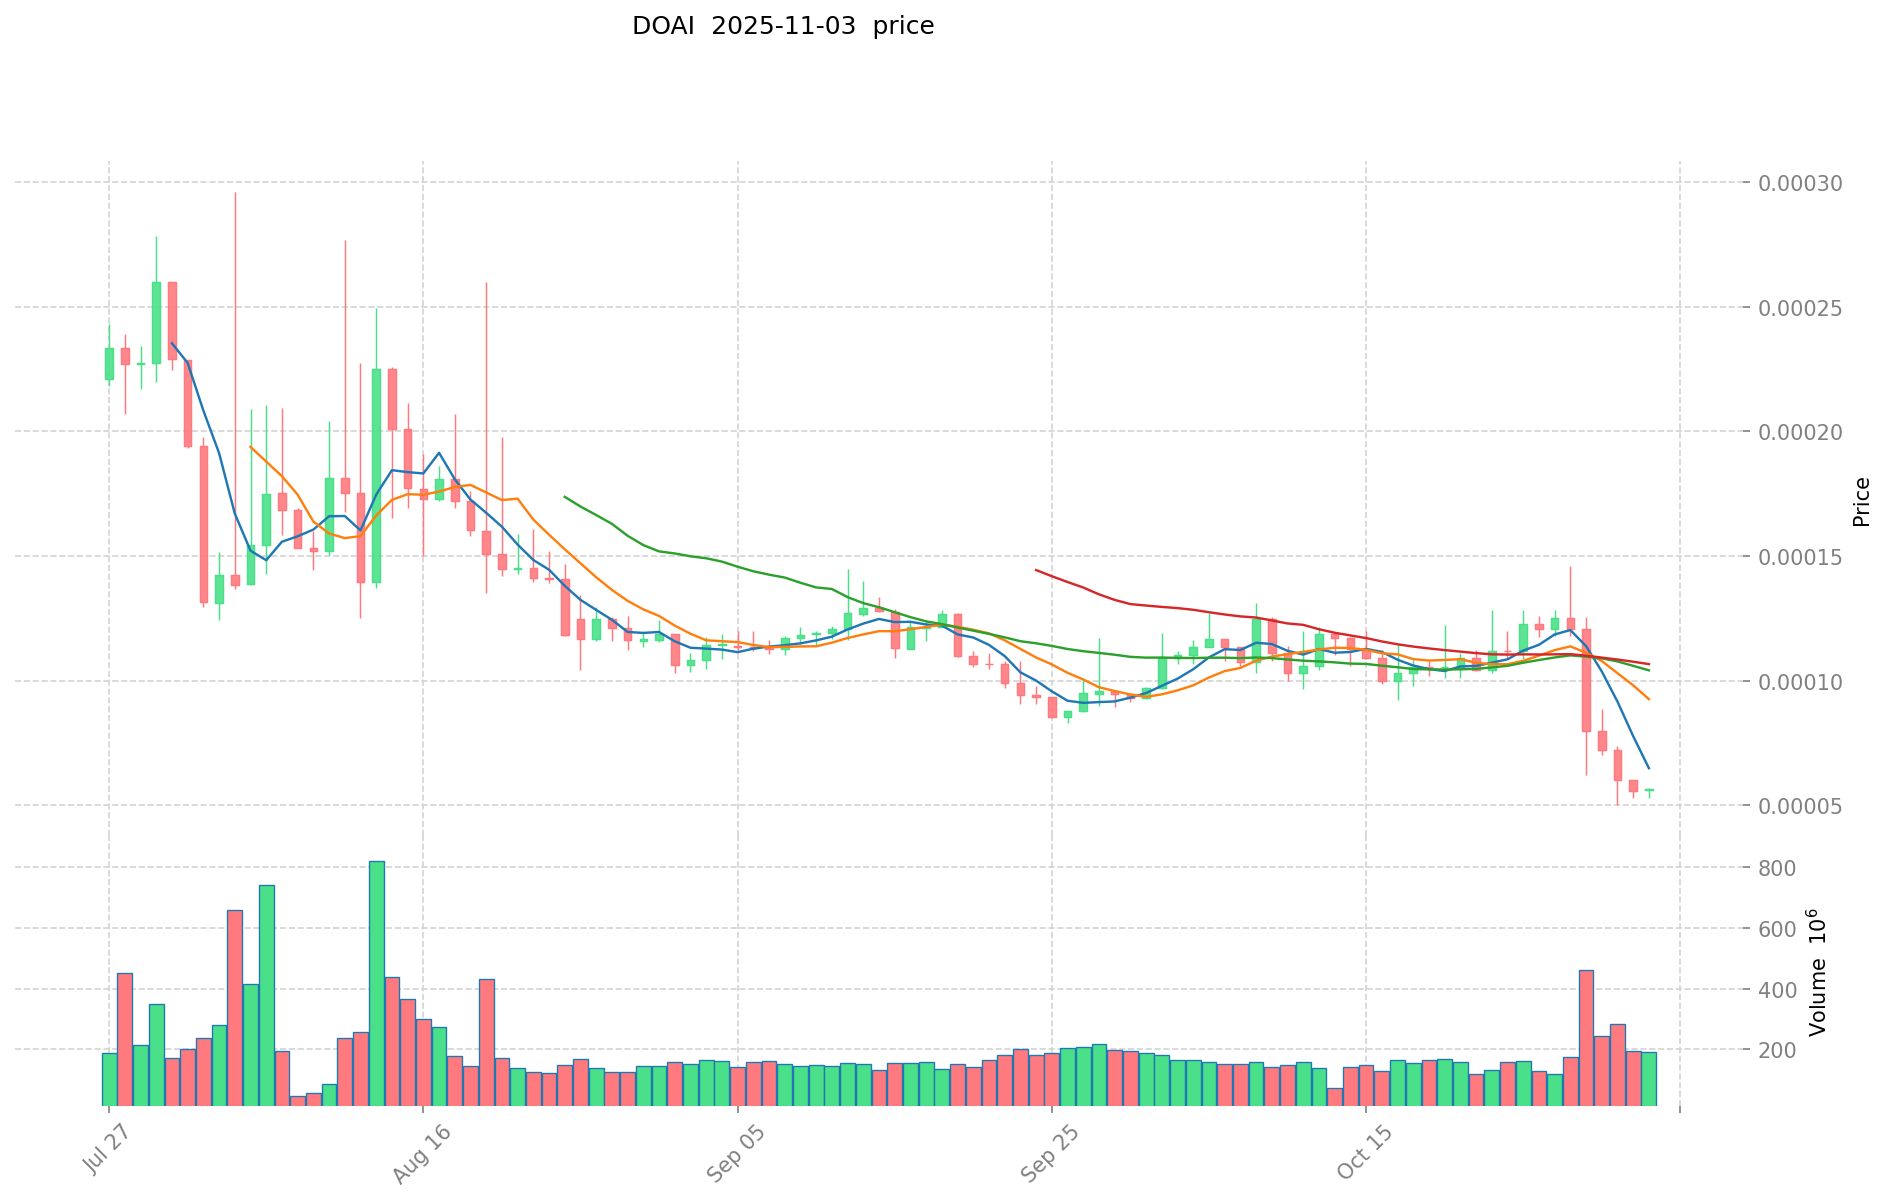
- 2024: DOAI reached its all-time high of $0.03843 on July 29, 2024.
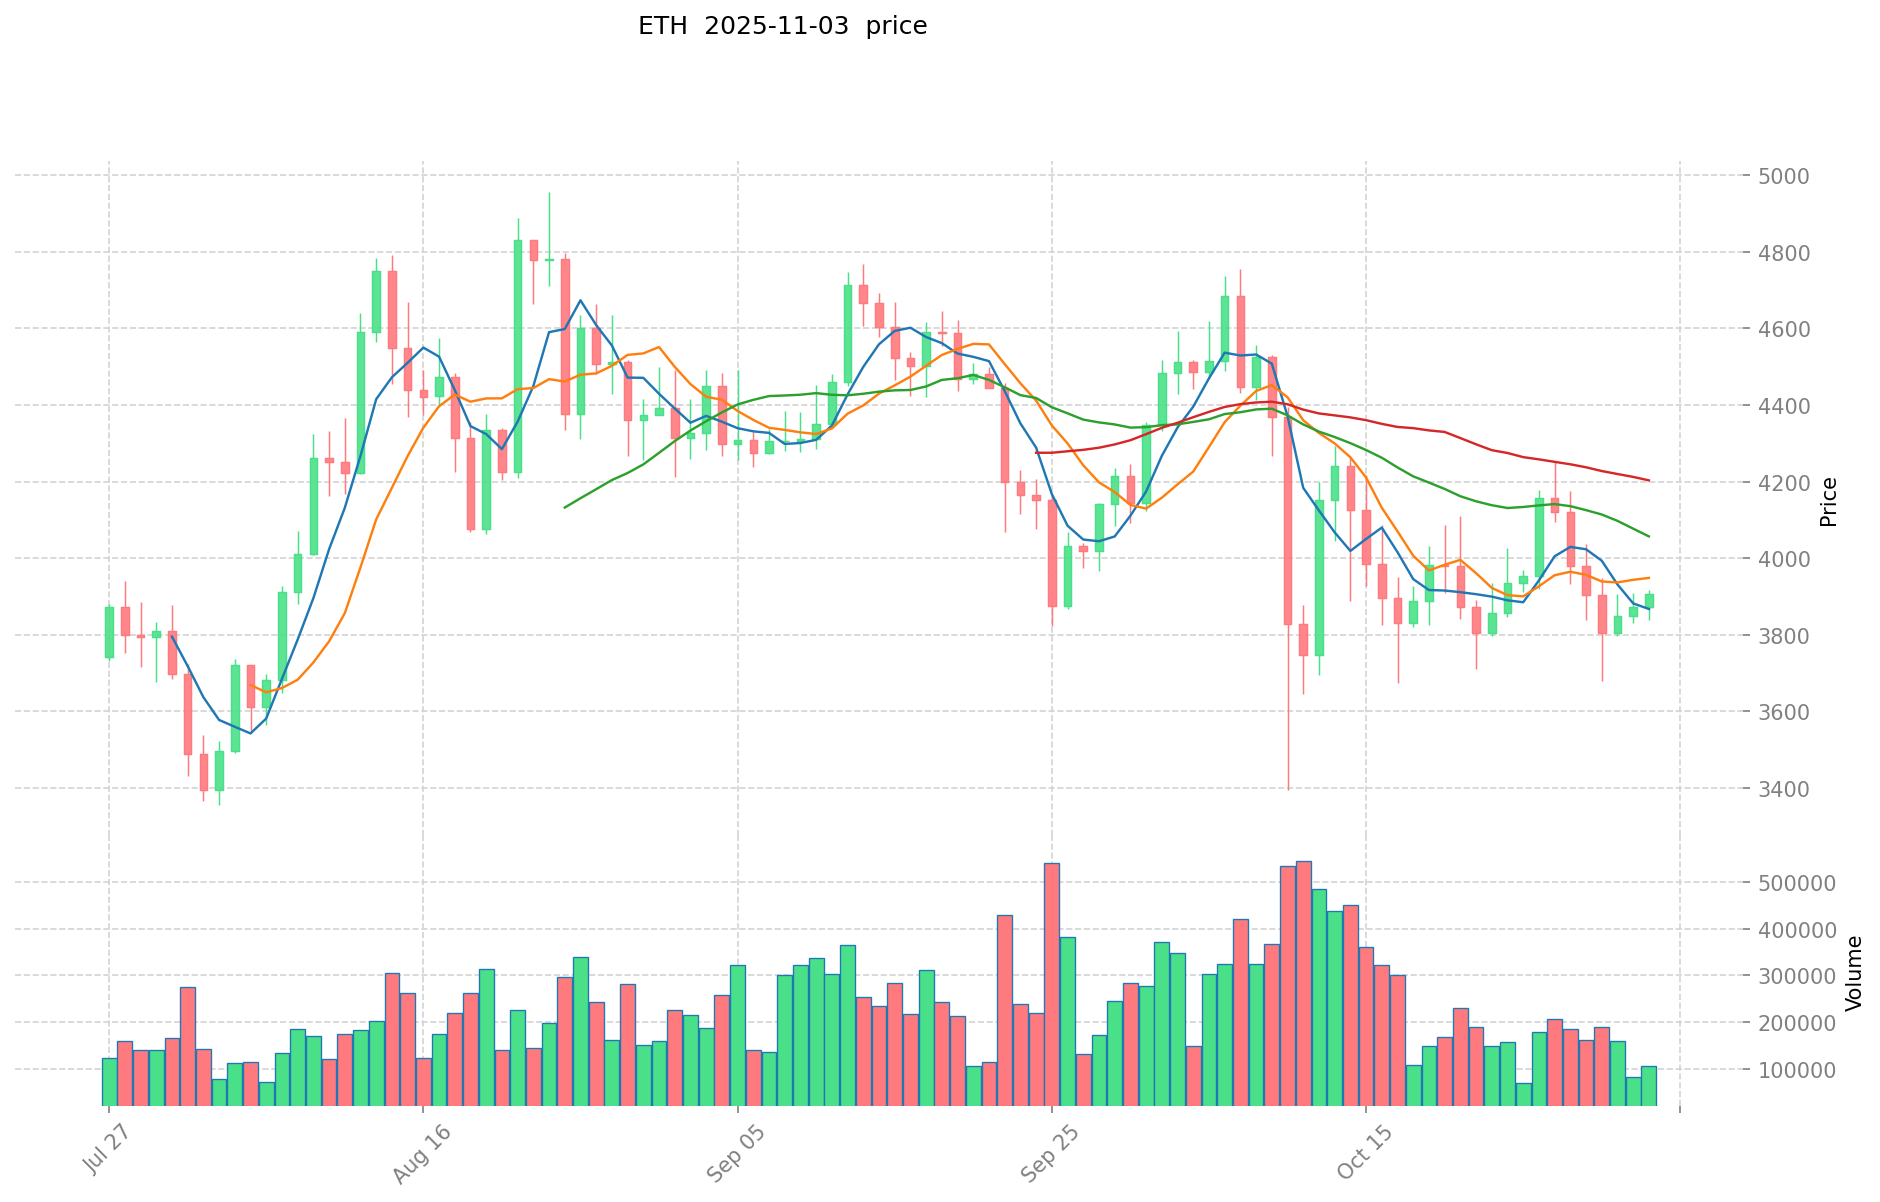
- 2025: ETH hit a new all-time high of $4,946.05 on August 25, 2025.
- Comparative analysis: In the current market cycle, DOAI has dropped from its peak of $0.03843 to a low of $0.00005, while ETH has shown more resilience, maintaining a price above $3,500.
Current Market Situation (2025-11-04)
- DOAI current price: $0.00005098
- ETH current price: $3,574.04
- 24-hour trading volume: $9,781.08 (DOAI) vs $989,387,509.12 (ETH)
- Market Sentiment Index (Fear & Greed Index): 42 (Fear)
Click to view real-time prices:
- View DOAI current price Market Price
- View ETH current price Market Price
Factors Affecting DOAI vs ETH Investment Value
Supply Mechanism Comparison (Tokenomics)
- ETH: Technical infinite supply parameters maintained within a range based on validator activity and burn rate, not equivalent to a fixed supply schedule
- ETH: Burning mechanism through base fees (EIP-1559) affects supply, with potential changes indicated in the roadmap (Endgame EIP 1559 and MEV Burn)
- 📌 Historical pattern: ETH differs from Bitcoin in terms of scarcity and historical record, with ETH's supply parameters potentially fluctuating in unexpected directions
Institutional Adoption and Market Applications
- Institutional holdings: ETH maintains the second-largest market capitalization position consistently
- Enterprise adoption: ETH serves as a payment method on the Ethereum technology platform, with NFT payments consuming the second most Gas fees after DeFi-related transactions
- National policies: USDT (on Ethereum) facing regulatory challenges in the EU due to non-compliance with MiCA regulations, while upcoming US GENIUS Act will bring new regulatory frameworks
Technology Development and Ecosystem Building
- ETH technology upgrades: Rollup scaling solution chosen to address the blockchain trilemma (decentralization, security, scalability), moving transaction execution off-chain
- ETH ecosystem: Leading blockchain platform enabling developers to build decentralized applications with superior programmability compared to Bitcoin, hosting some of the largest and most active applications in the digital asset ecosystem
- Ecosystem comparison: ETH supports advanced DeFi protocols, NFT marketplaces, and extensive smart contract functionality
Macroeconomic Environment and Market Cycles
- Performance in inflationary environments: ETH's value as a store of value is complicated by its supply schedule's potential for future upgrades
- Macroeconomic monetary policy: ETH price relationship with network metrics (like address growth) shows some correlation but without guaranteed future continuity
- Value transfer mechanisms: ETH token economics comprised of three functions (base fees, priority fees, and MEV) that translate use cases into value, potentially appreciating token value as platform usage increases
III. 2025-2030 Price Prediction: DOAI vs ETH
Short-term Prediction (2025)
- DOAI: Conservative $0.0000321174 - $0.00005098 | Optimistic $0.00005098 - $0.0000647446
- ETH: Conservative $2,039.517 - $3,578.1 | Optimistic $3,578.1 - $5,224.026
Mid-term Prediction (2027)
- DOAI may enter a growth phase, with prices expected between $0.0000409665084 - $0.000072906498
- ETH may enter a bullish market, with prices expected between $4,601.3113665 - $5,954.638239
- Key drivers: Institutional capital inflow, ETF, ecosystem development
Long-term Prediction (2030)
- DOAI: Base scenario $0.000064501229356 - $0.000092144613366 | Optimistic scenario $0.000092144613366 - $0.000110573536039
- ETH: Base scenario $6,012.5064960681 - $6,263.0276000709375 | Optimistic scenario $6,263.0276000709375 - $7,077.221188080159375
Disclaimer: The information provided is for informational purposes only and should not be considered financial advice. Cryptocurrency markets are highly volatile and unpredictable. Always conduct your own research before making any investment decisions.
DOAI:
| 年份 | 预测最高价 | 预测平均价格 | 预测最低价 | 涨跌幅 |
|---|---|---|---|---|
| 2025 | 0.0000647446 | 0.00005098 | 0.0000321174 | 0 |
| 2026 | 0.00008100722 | 0.0000578623 | 0.000052654693 | 13 |
| 2027 | 0.000072906498 | 0.00006943476 | 0.0000409665084 | 36 |
| 2028 | 0.00008113451706 | 0.000071170629 | 0.00006334185981 | 39 |
| 2029 | 0.000108136653702 | 0.00007615257303 | 0.000067775789996 | 49 |
| 2030 | 0.000110573536039 | 0.000092144613366 | 0.000064501229356 | 80 |
ETH:
| 年份 | 预测最高价 | 预测平均价格 | 预测最低价 | 涨跌幅 |
|---|---|---|---|---|
| 2025 | 5224.026 | 3578.1 | 2039.517 | 0 |
| 2026 | 6425.55198 | 4401.063 | 3564.86103 | 22 |
| 2027 | 5954.638239 | 5413.30749 | 4601.3113665 | 50 |
| 2028 | 6536.568794175 | 5683.9728645 | 3183.02480412 | 58 |
| 2029 | 6415.784370804375 | 6110.2708293375 | 4154.9841639495 | 70 |
| 2030 | 7077.221188080159375 | 6263.0276000709375 | 6012.5064960681 | 74 |
IV. Investment Strategy Comparison: DOAI vs ETH
Long-term vs Short-term Investment Strategies
- DOAI: Suitable for investors focused on AI data monetization and GPU training potential
- ETH: Suitable for investors seeking stability and ecosystem growth
Risk Management and Asset Allocation
- Conservative investors: DOAI: 5% vs ETH: 95%
- Aggressive investors: DOAI: 20% vs ETH: 80%
- Hedging tools: Stablecoin allocation, options, cross-currency portfolio
V. Potential Risk Comparison
Market Risk
- DOAI: High volatility and low liquidity
- ETH: Market sentiment fluctuations and competition from other smart contract platforms
Technical Risk
- DOAI: Scalability, network stability
- ETH: Network congestion, high gas fees
Regulatory Risk
- Global regulatory policies may impact both differently, with ETH potentially facing more scrutiny due to its larger market presence
VI. Conclusion: Which Is the Better Buy?
📌 Investment Value Summary:
- DOAI advantages: Focus on AI data monetization, potential for growth in GPU training market
- ETH advantages: Established ecosystem, strong institutional adoption, ongoing technological upgrades
✅ Investment Advice:
- New investors: Consider allocating a larger portion to ETH due to its established market position
- Experienced investors: Diversify with a balanced portfolio of both DOAI and ETH
- Institutional investors: Focus on ETH for its liquidity and market depth, with potential small allocation to DOAI for exposure to AI-related blockchain projects
⚠️ Risk Warning: The cryptocurrency market is highly volatile. This article does not constitute investment advice. None
VII. FAQ
Q1: What are the key differences between DOAI and ETH? A: DOAI focuses on AI data monetization and GPU training, while ETH is a foundation for decentralized applications and smart contracts. ETH has a larger market cap, higher trading volume, and a more established ecosystem.
Q2: Which cryptocurrency has shown better price performance recently? A: ETH has shown more resilience in the current market cycle, maintaining a price above $3,500, while DOAI has dropped significantly from its peak of $0.03843 to $0.00005.
Q3: How do the supply mechanisms of DOAI and ETH differ? A: ETH has a technically infinite supply with parameters maintained within a range based on validator activity and burn rate. It also has a burning mechanism through base fees (EIP-1559). DOAI's specific supply mechanism is not detailed in the provided information.
Q4: What are the main factors affecting the investment value of DOAI and ETH? A: Key factors include supply mechanisms, institutional adoption, market applications, technology development, ecosystem building, macroeconomic environment, and market cycles.
Q5: What are the price predictions for DOAI and ETH by 2030? A: For DOAI, the base scenario predicts $0.000064501229356 - $0.000092144613366, with an optimistic scenario of $0.000092144613366 - $0.000110573536039. For ETH, the base scenario predicts $6,012.5064960681 - $6,263.0276000709375, with an optimistic scenario of $6,263.0276000709375 - $7,077.221188080159375.
Q6: How should investors allocate their portfolio between DOAI and ETH? A: Conservative investors might consider 5% DOAI and 95% ETH, while aggressive investors might opt for 20% DOAI and 80% ETH. The exact allocation depends on individual risk tolerance and investment goals.
Q7: What are the main risks associated with investing in DOAI and ETH? A: Risks include market volatility, technical challenges (such as scalability and network congestion), and regulatory uncertainties. ETH may face more regulatory scrutiny due to its larger market presence.
Share
Content
Introduction: Investment Comparison between DOAI and ETH
I. Price History Comparison and Current Market Status
Factors Affecting DOAI vs ETH Investment Value
III. 2025-2030 Price Prediction: DOAI vs ETH
IV. Investment Strategy Comparison: DOAI vs ETH
V. Potential Risk Comparison
VI. Conclusion: Which Is the Better Buy?
VII. FAQ

