FYN vs GRT: A Comparative Analysis of Two Emerging Cryptocurrencies in the Decentralized Finance Ecosystem
Introduction: FYN vs GRT Investment Comparison
In the cryptocurrency market, the comparison between Affyn (FYN) and The Graph (GRT) has been an unavoidable topic for investors. The two not only show significant differences in market cap ranking, application scenarios, and price performance but also represent different positioning in the crypto asset space.
Affyn (FYN): Since its launch in 2022, it has gained market recognition for its sustainable play-to-earn metaverse concept on the Polygon blockchain.
The Graph (GRT): Introduced in 2020, it has been hailed as the "Google of blockchain," becoming one of the most important infrastructures for indexing and querying blockchain data.
This article will comprehensively analyze the investment value comparison between FYN and GRT, focusing on historical price trends, supply mechanisms, institutional adoption, technical ecosystems, and future predictions, attempting to answer the question investors care about most:
"Which is the better buy right now?"
I. Price History Comparison and Current Market Status
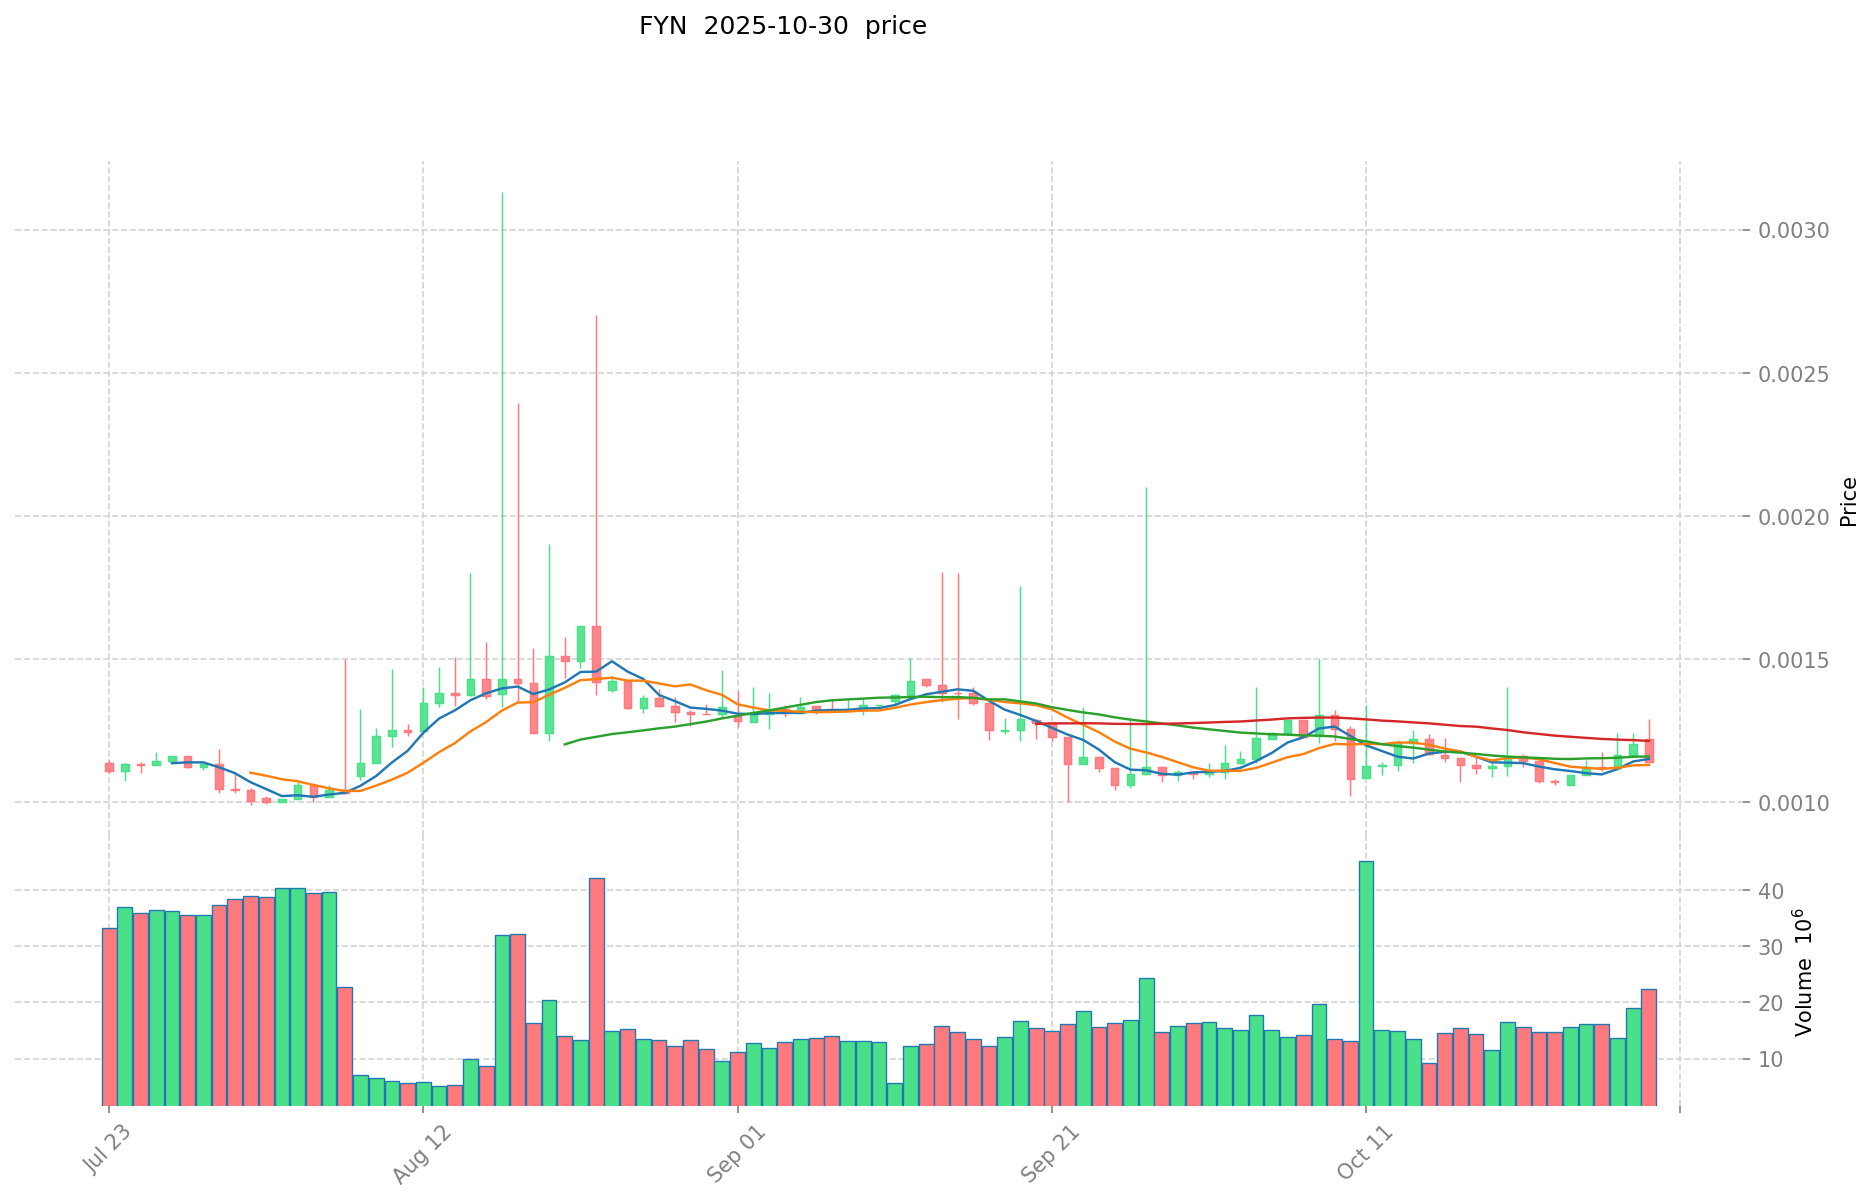
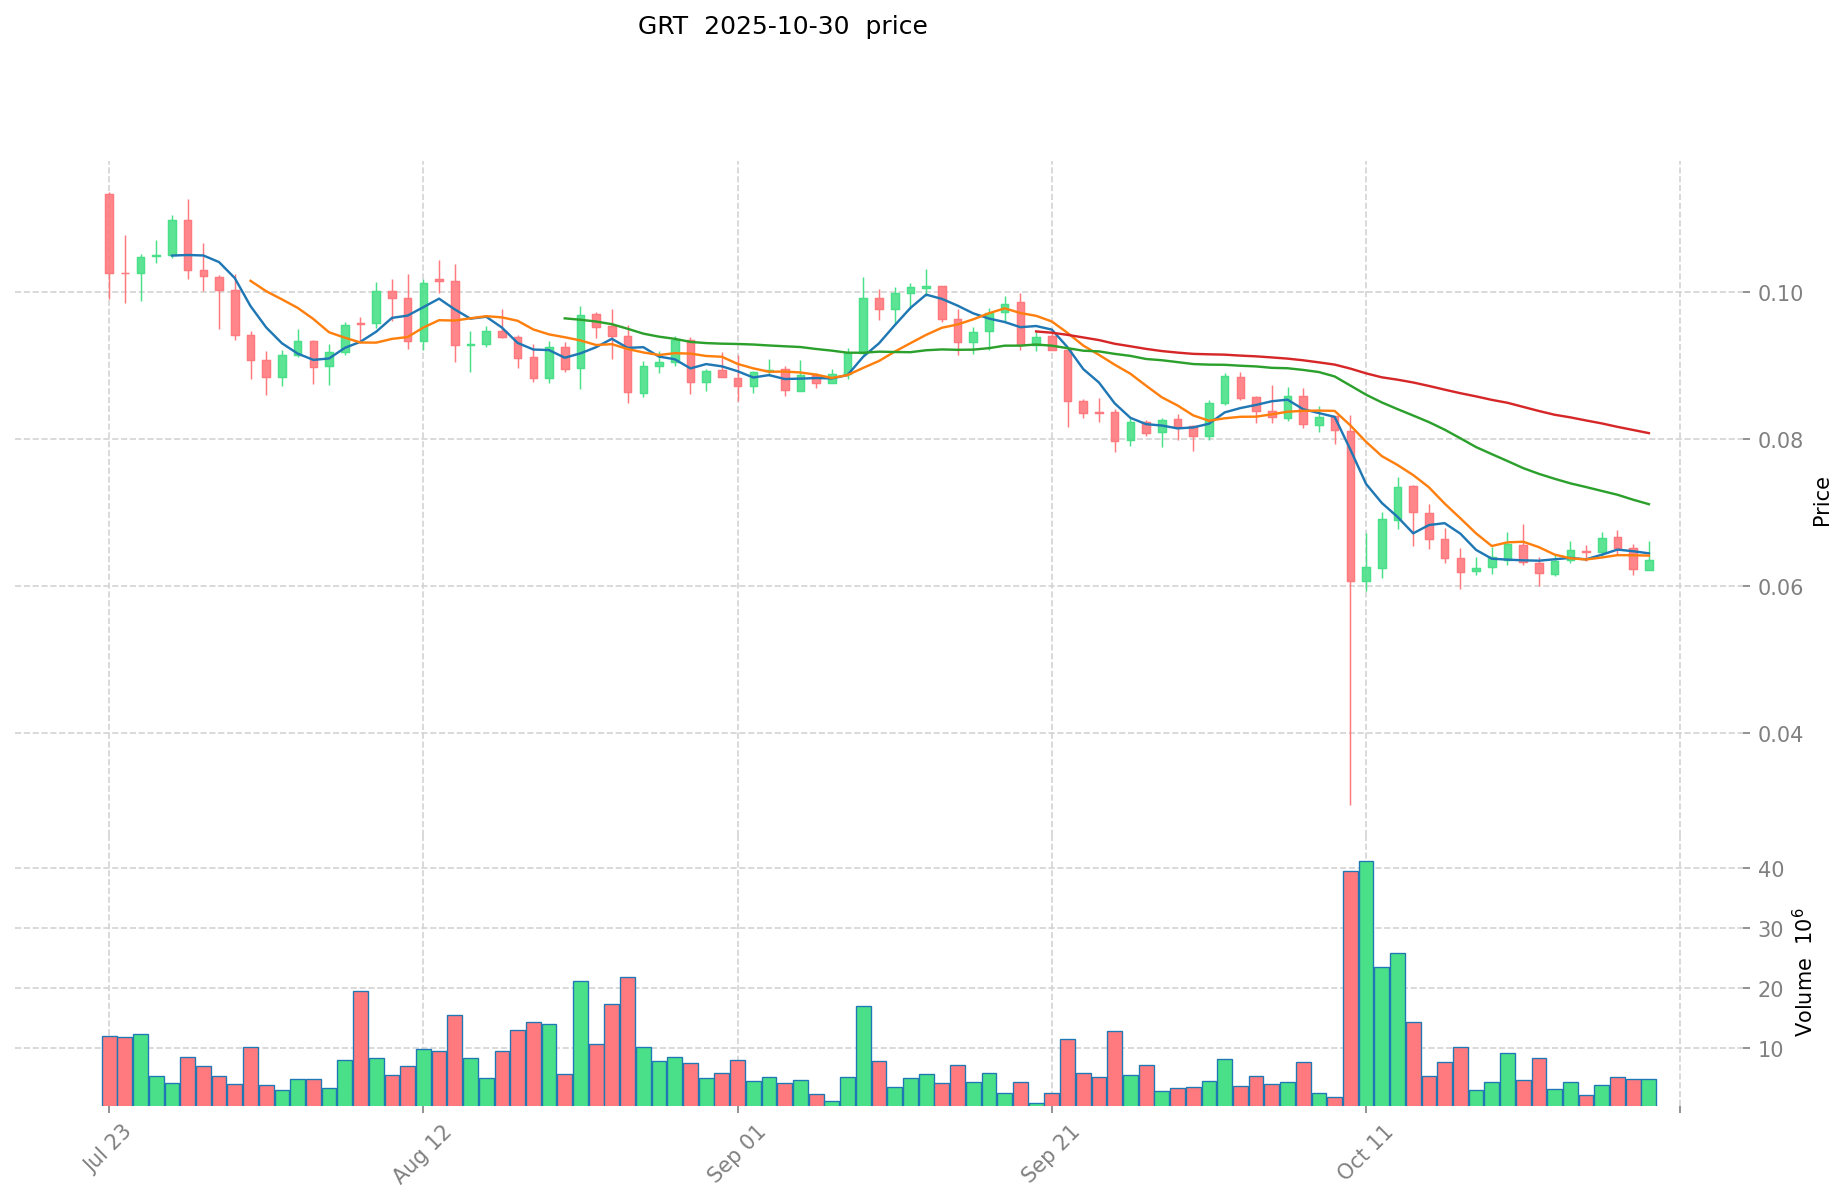
FYN and GRT Historical Price Trends
- 2024: FYN reached its all-time high of $0.193639 on March 22, 2024.
- 2021: GRT reached its all-time high of $2.84 on February 12, 2021.
- Comparative analysis: In the recent market cycle, FYN dropped from its peak of $0.193639 to a low of $0.0008266, while GRT declined from $2.84 to its current price of $0.06076.
Current Market Situation (2025-10-31)
- FYN current price: $0.001116
- GRT current price: $0.06076
- 24-hour trading volume: FYN $19,579.78 vs GRT $537,148.14
- Market Sentiment Index (Fear & Greed Index): 34 (Fear)
Click to view real-time prices:
- Check FYN current price Market Price
- Check GRT current price Market Price


II. Core Factors Affecting FYN vs GRT Investment Value
Technical Analysis and Market Sentiment
- MACD Divergence: Analysis indicates that MACD divergence serves as a key warning signal for potential trend changes, suggesting investors' changing sentiment about price trends versus actual value
- Market Manipulation: Evidence of "wash trading" tactics where major players create price fluctuations to reduce floating chips and concentrate holdings before price increases
- Sentiment Analysis: Investor emotions and perspectives on price trends play a crucial role in determining investment value for both tokens
Market Dynamics and Trading Patterns
- Price Control Mechanisms: The concept of "win rate adjustment" appears to be a significant factor affecting trading patterns
- Liquidity Concentration: Major holders concentrate tokens to facilitate easier price manipulation when most supply is in fewer hands
- Trading Psychology: The preparation for "main upward waves" suggests strategic price movement planning by large holders
Project Fundamentals
- GRT Technology: The Graph operates as a protocol for indexing and querying blockchain data
- Platform Development: Gains Network (potentially related to FYN) operates as a decentralized platform transforming trading, lending, and representation of real-world assets
- Protocol Infrastructure: Gains Network utilizes an open-source framework enabling operations across various blockchains
Economic Indicators
- Value Assessment: Technical indicators suggest discrepancies between market price and perceived actual value
- Investment Signals: Technical divergences provide potential entry/exit signals for investors
- Market Timing: Waiting for market maturity appears to be a recommended strategy for both tokens
III. 2025-2030 Price Prediction: FYN vs GRT
Short-term Prediction (2025)
- FYN: Conservative $0.00059148 - $0.001116 | Optimistic $0.001116 - $0.0012834
- GRT: Conservative $0.0508788 - $0.06057 | Optimistic $0.06057 - $0.0872208
Mid-term Prediction (2027)
- FYN may enter a growth phase, with prices expected in the range of $0.00102790296 - $0.0019987002
- GRT may enter a volatile phase, with prices expected in the range of $0.04543089192 - $0.11279393856
- Key drivers: Institutional capital inflow, ETF, ecosystem development
Long-term Prediction (2030)
- FYN: Base scenario $0.00175600089 - $0.00202818102795 | Optimistic scenario $0.002393253612981
- GRT: Base scenario $0.079952749664553 - $0.1193324621859 | Optimistic scenario $0.175418719413273
Disclaimer: The above predictions are based on historical data and current market trends. Cryptocurrency markets are highly volatile and subject to rapid changes. These forecasts should not be considered as financial advice. Always conduct your own research before making any investment decisions.
FYN:
| 年份 | 预测最高价 | 预测平均价格 | 预测最低价 | 涨跌幅 |
|---|---|---|---|---|
| 2025 | 0.0012834 | 0.001116 | 0.00059148 | 0 |
| 2026 | 0.001655586 | 0.0011997 | 0.001139715 | 7 |
| 2027 | 0.0019987002 | 0.001427643 | 0.00102790296 | 27 |
| 2028 | 0.00179883018 | 0.0017131716 | 0.000959376096 | 53 |
| 2029 | 0.0023003611659 | 0.00175600089 | 0.0012467606319 | 57 |
| 2030 | 0.002393253612981 | 0.00202818102795 | 0.001926771976552 | 81 |
GRT:
| 年份 | 预测最高价 | 预测平均价格 | 预测最低价 | 涨跌幅 |
|---|---|---|---|---|
| 2025 | 0.0872208 | 0.06057 | 0.0508788 | 0 |
| 2026 | 0.082762848 | 0.0738954 | 0.07020063 | 21 |
| 2027 | 0.11279393856 | 0.078329124 | 0.04543089192 | 28 |
| 2028 | 0.1165850681616 | 0.09556153128 | 0.081227301588 | 57 |
| 2029 | 0.132591624651 | 0.1060732997208 | 0.056218848852024 | 74 |
| 2030 | 0.175418719413273 | 0.1193324621859 | 0.079952749664553 | 96 |
IV. Investment Strategy Comparison: FYN vs GRT
Long-term vs Short-term Investment Strategies
- FYN: Suitable for investors focused on metaverse potential and play-to-earn ecosystems
- GRT: Suitable for investors interested in blockchain infrastructure and data indexing solutions
Risk Management and Asset Allocation
- Conservative investors: FYN: 20% vs GRT: 80%
- Aggressive investors: FYN: 40% vs GRT: 60%
- Hedging tools: Stablecoin allocation, options, cross-currency portfolios
V. Potential Risk Comparison
Market Risks
- FYN: High volatility due to relatively low market cap and trading volume
- GRT: Susceptible to overall blockchain market trends and adoption rates
Technical Risks
- FYN: Scalability, network stability in the metaverse ecosystem
- GRT: Indexing accuracy, potential vulnerabilities in the query system
Regulatory Risks
- Global regulatory policies may have different impacts on metaverse tokens (FYN) and blockchain infrastructure tokens (GRT)
VI. Conclusion: Which Is the Better Buy?
📌 Investment Value Summary:
- FYN advantages: Potential growth in the metaverse and play-to-earn sectors
- GRT advantages: Established position in blockchain data indexing, wider adoption
✅ Investment Advice:
- Novice investors: Consider a small allocation to GRT for exposure to blockchain infrastructure
- Experienced investors: Balanced portfolio with both FYN and GRT, adjusting based on risk tolerance
- Institutional investors: Focus on GRT for its established market position, consider FYN for diversification in emerging metaverse sector
⚠️ Risk Warning: The cryptocurrency market is highly volatile. This article does not constitute investment advice. None
VII. FAQ
Q1: What are the key differences between FYN and GRT? A: FYN is focused on the metaverse and play-to-earn ecosystem on the Polygon blockchain, while GRT is a protocol for indexing and querying blockchain data, often referred to as the "Google of blockchain."
Q2: Which token has performed better historically? A: GRT reached a higher all-time high of $2.84 in February 2021, compared to FYN's all-time high of $0.193639 in March 2024. However, both have experienced significant price declines since their peaks.
Q3: What are the current prices and market sentiment for FYN and GRT? A: As of October 31, 2025, FYN's price is $0.001116, and GRT's price is $0.06076. The market sentiment index (Fear & Greed Index) is at 34, indicating "Fear" in the market.
Q4: What are the long-term price predictions for FYN and GRT? A: By 2030, FYN is predicted to reach $0.00175600089 - $0.00202818102795 in the base scenario, while GRT is expected to reach $0.079952749664553 - $0.1193324621859 in the base scenario.
Q5: How should investors allocate their portfolio between FYN and GRT? A: Conservative investors might consider allocating 20% to FYN and 80% to GRT, while more aggressive investors might opt for 40% FYN and 60% GRT. However, this should be adjusted based on individual risk tolerance and market conditions.
Q6: What are the main risks associated with investing in FYN and GRT? A: FYN faces high volatility due to its lower market cap and trading volume, while GRT is more susceptible to overall blockchain market trends. Both face technical risks related to their respective ecosystems and potential regulatory challenges.
Q7: Which token is recommended for different types of investors? A: Novice investors might consider a small allocation to GRT for exposure to blockchain infrastructure. Experienced investors could maintain a balanced portfolio of both FYN and GRT. Institutional investors might focus more on GRT for its established market position while considering FYN for diversification in the emerging metaverse sector.
Share
Content