TCT vs SHIB: Battle of the Meme Coins in the Volatile Crypto Market
Introduction: TCT vs SHIB Investment Comparison
In the cryptocurrency market, TokenClub (TCT) vs Shiba Inu (SHIB) comparison has been an unavoidable topic for investors. The two not only show significant differences in market cap ranking, application scenarios, and price performance, but also represent different positions in the crypto asset landscape.
TokenClub (TCT): Launched in 2018, it has gained market recognition for its digital currency investment service community.
Shiba Inu (SHIB): Since its inception in 2020, it has been hailed as a "Dogecoin-like meme token" and has become one of the most traded and highest market cap cryptocurrencies globally.
This article will comprehensively analyze the investment value comparison between TCT and SHIB, focusing on historical price trends, supply mechanisms, institutional adoption, technological ecosystems, and future predictions, attempting to answer the question investors care about most:
"Which is the better buy right now?"
I. Price History Comparison and Current Market Status
TokenClub (TCT) and Shiba Inu (SHIB) Historical Price Trends
- 2021: SHIB experienced a significant price surge due to increased popularity and market speculation.
- 2022: TCT faced price volatility amid overall cryptocurrency market fluctuations.
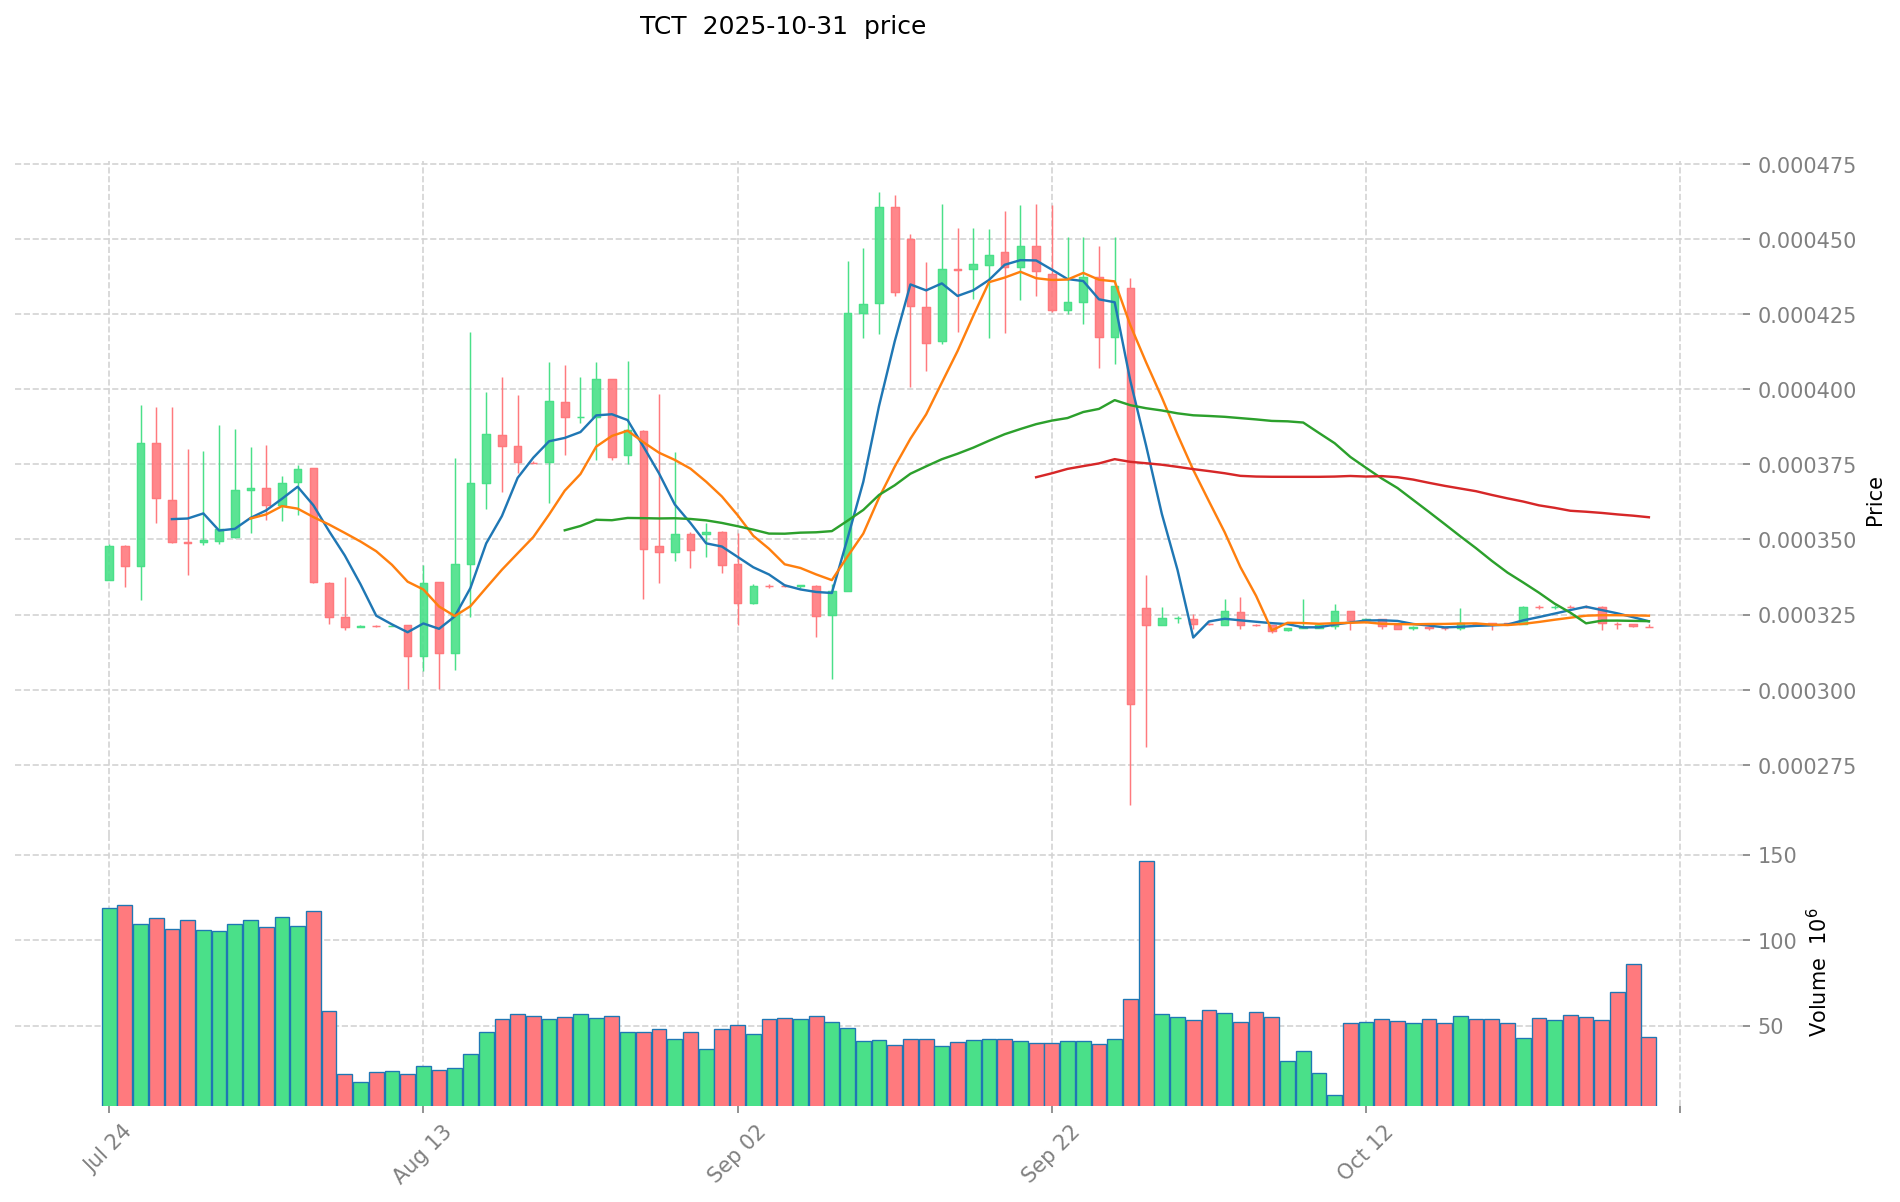
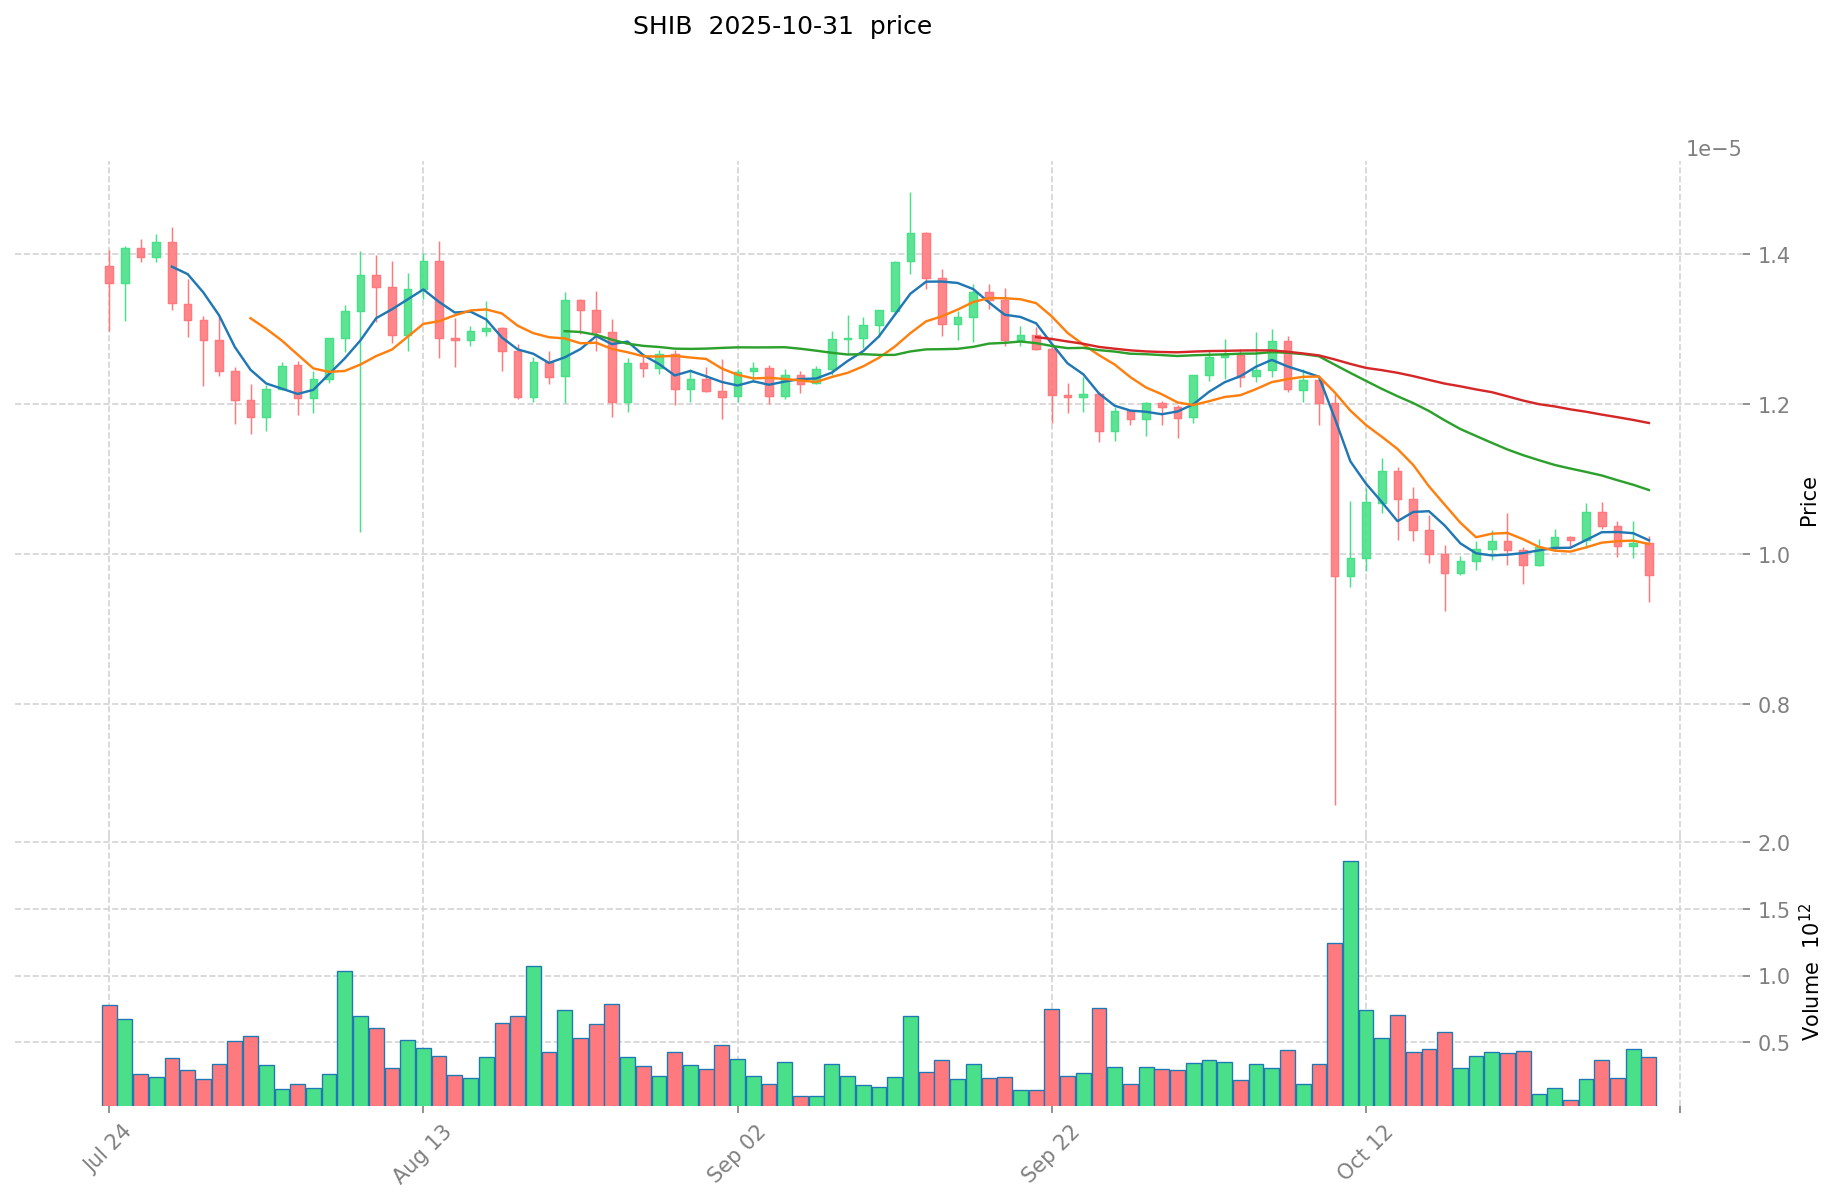
- Comparative analysis: During the recent market cycle, TCT dropped from its all-time high of $0.110162 to a low of $0.00023584, while SHIB showed more resilience in maintaining its market position.
Current Market Situation (2025-11-01)
- TCT current price: $0.000322
- SHIB current price: $0.000009966
- 24-hour trading volume: TCT $9,508.64 vs SHIB $2,434,001.75
- Market Sentiment Index (Fear & Greed Index): 29 (Fear)
Click to view real-time prices:
- View TCT current price Market Price
- View SHIB current price Market Price
Key Factors Influencing TCT vs SHIB Investment Value
Supply Mechanism Comparison (Tokenomics)
- TCT: Limited information available on supply mechanism
- SHIB: Inflationary supply model with large initial circulation
- 📌 Historical pattern: Supply mechanisms typically drive price cycle variations in cryptocurrency markets
Institutional Adoption and Market Applications
- Institutional holdings: Limited information on institutional preference between these tokens
- Enterprise adoption: Both tokens have limited enterprise-level adoption compared to mainstream cryptocurrencies
- National policies: Regulatory approaches vary by country, with most nations still developing specific frameworks for meme coins and utility tokens
Technical Development and Ecosystem Building
- TCT technical upgrades: Insufficient data on specific technical developments
- SHIB technical development: Community-driven development with expansion into DeFi applications
- Ecosystem comparison: SHIB has developed a broader ecosystem including DEX platforms and NFT applications
Macroeconomic Factors and Market Cycles
- Performance in inflationary environments: Both tokens exhibit high volatility during inflationary periods
- Macroeconomic monetary policy: Interest rates and USD index movements tend to impact both tokens significantly
- Geopolitical factors: Cross-border transaction demands and international situations affect market sentiment for both tokens
III. 2025-2030 Price Prediction: TCT vs SHIB
Short-term Prediction (2025)
- TCT: Conservative $0.000269556 - $0.0003209 | Optimistic $0.0003209 - $0.000336945
- SHIB: Conservative $0.00000918712 - $0.000009986 | Optimistic $0.000009986 - $0.00001188334
Mid-term Prediction (2027)
- TCT may enter a growth phase, with an estimated price range of $0.00032862646975 - $0.00043026352225
- SHIB may enter a bullish market, with an estimated price range of $0.000010221729516 - $0.000018963998181
- Key drivers: Institutional capital inflow, ETF, ecosystem development
Long-term Prediction (2030)
- TCT: Base scenario $0.000465267873665 - $0.000572279484607 | Optimistic scenario $0.000572279484607+
- SHIB: Base scenario $0.000020328215756 - $0.000026833244798 | Optimistic scenario $0.000026833244798+
Disclaimer: The above predictions are based on historical data and market analysis. Cryptocurrency markets are highly volatile and subject to various factors. These projections should not be considered as financial advice. Always conduct your own research before making investment decisions.
TCT:
| 年份 | 预测最高价 | 预测平均价格 | 预测最低价 | 涨跌幅 |
|---|---|---|---|---|
| 2025 | 0.000336945 | 0.0003209 | 0.000269556 | 0 |
| 2026 | 0.00034865785 | 0.0003289225 | 0.000279584125 | 2 |
| 2027 | 0.00043026352225 | 0.000338790175 | 0.00032862646975 | 5 |
| 2028 | 0.000465277486836 | 0.000384526848625 | 0.000249942451606 | 19 |
| 2029 | 0.000505633579599 | 0.00042490216773 | 0.000331423690829 | 31 |
| 2030 | 0.000572279484607 | 0.000465267873665 | 0.000339645547775 | 44 |
SHIB:
| 年份 | 预测最高价 | 预测平均价格 | 预测最低价 | 涨跌幅 |
|---|---|---|---|---|
| 2025 | 0.00001188334 | 0.000009986 | 0.00000918712 | 0 |
| 2026 | 0.0000159646182 | 0.00001093467 | 0.0000103879365 | 9 |
| 2027 | 0.000018963998181 | 0.0000134496441 | 0.000010221729516 | 34 |
| 2028 | 0.000019772321791 | 0.00001620682114 | 0.000008265478781 | 62 |
| 2029 | 0.000022666860047 | 0.000017989571466 | 0.000016550405748 | 80 |
| 2030 | 0.000026833244798 | 0.000020328215756 | 0.000014433033187 | 104 |
IV. Investment Strategy Comparison: TCT vs SHIB
Long-term vs Short-term Investment Strategies
- TCT: Suitable for investors focusing on digital currency investment communities
- SHIB: Suitable for investors seeking high-risk, high-reward opportunities in meme coins
Risk Management and Asset Allocation
- Conservative investors: TCT: 30% vs SHIB: 10%
- Aggressive investors: TCT: 50% vs SHIB: 70%
- Hedging tools: Stablecoin allocation, options, cross-currency portfolio
V. Potential Risk Comparison
Market Risks
- TCT: Limited market recognition and trading volume
- SHIB: High volatility and susceptibility to market sentiment
Technical Risks
- TCT: Scalability, network stability
- SHIB: Smart contract vulnerabilities, ecosystem development challenges
Regulatory Risks
- Global regulatory policies may have different impacts on utility tokens (TCT) and meme coins (SHIB)
VI. Conclusion: Which Is the Better Buy?
📌 Investment Value Summary:
- TCT advantages: Digital currency investment service community focus
- SHIB advantages: Larger ecosystem, higher market recognition, and trading volume
✅ Investment Advice:
- New investors: Consider a small allocation to SHIB for exposure to meme coin market
- Experienced investors: Diversify between TCT and SHIB based on risk tolerance
- Institutional investors: Conduct thorough due diligence on both projects before considering allocation
⚠️ Risk Warning: Cryptocurrency markets are highly volatile. This article does not constitute investment advice. None
VII. FAQ
Q1: What are the main differences between TCT and SHIB? A: TCT is focused on digital currency investment services, while SHIB is a meme coin with a larger ecosystem. TCT has a smaller market cap and trading volume, whereas SHIB has higher market recognition and liquidity.
Q2: Which token has performed better historically? A: Based on the available information, SHIB has shown more resilience in maintaining its market position during recent market cycles. It experienced a significant price surge in 2021 due to increased popularity and market speculation.
Q3: How do the supply mechanisms of TCT and SHIB compare? A: Limited information is available on TCT's supply mechanism. SHIB has an inflationary supply model with a large initial circulation. Supply mechanisms typically drive price cycle variations in cryptocurrency markets.
Q4: What are the price predictions for TCT and SHIB in 2030? A: For TCT, the base scenario predicts a range of $0.000465267873665 - $0.000572279484607. For SHIB, the base scenario predicts a range of $0.000020328215756 - $0.000026833244798. These predictions are subject to market volatility and should not be considered financial advice.
Q5: How should investors allocate their portfolio between TCT and SHIB? A: Conservative investors might consider allocating 30% to TCT and 10% to SHIB, while aggressive investors might allocate 50% to TCT and 70% to SHIB. However, individual allocations should be based on personal risk tolerance and investment goals.
Q6: What are the main risks associated with investing in TCT and SHIB? A: TCT faces risks related to limited market recognition and trading volume, while SHIB is subject to high volatility and susceptibility to market sentiment. Both tokens may face technical risks such as scalability issues and regulatory uncertainties.
Q7: Which token is better suited for different types of investors? A: TCT may be suitable for investors focusing on digital currency investment communities. SHIB might appeal to investors seeking high-risk, high-reward opportunities in meme coins. New investors might consider a small allocation to SHIB, while experienced investors could diversify between both tokens based on their risk tolerance.
Share
Content
Introduction: TCT vs SHIB Investment Comparison
I. Price History Comparison and Current Market Status
Key Factors Influencing TCT vs SHIB Investment Value
III. 2025-2030 Price Prediction: TCT vs SHIB
IV. Investment Strategy Comparison: TCT vs SHIB
V. Potential Risk Comparison
VI. Conclusion: Which Is the Better Buy?
VII. FAQ

