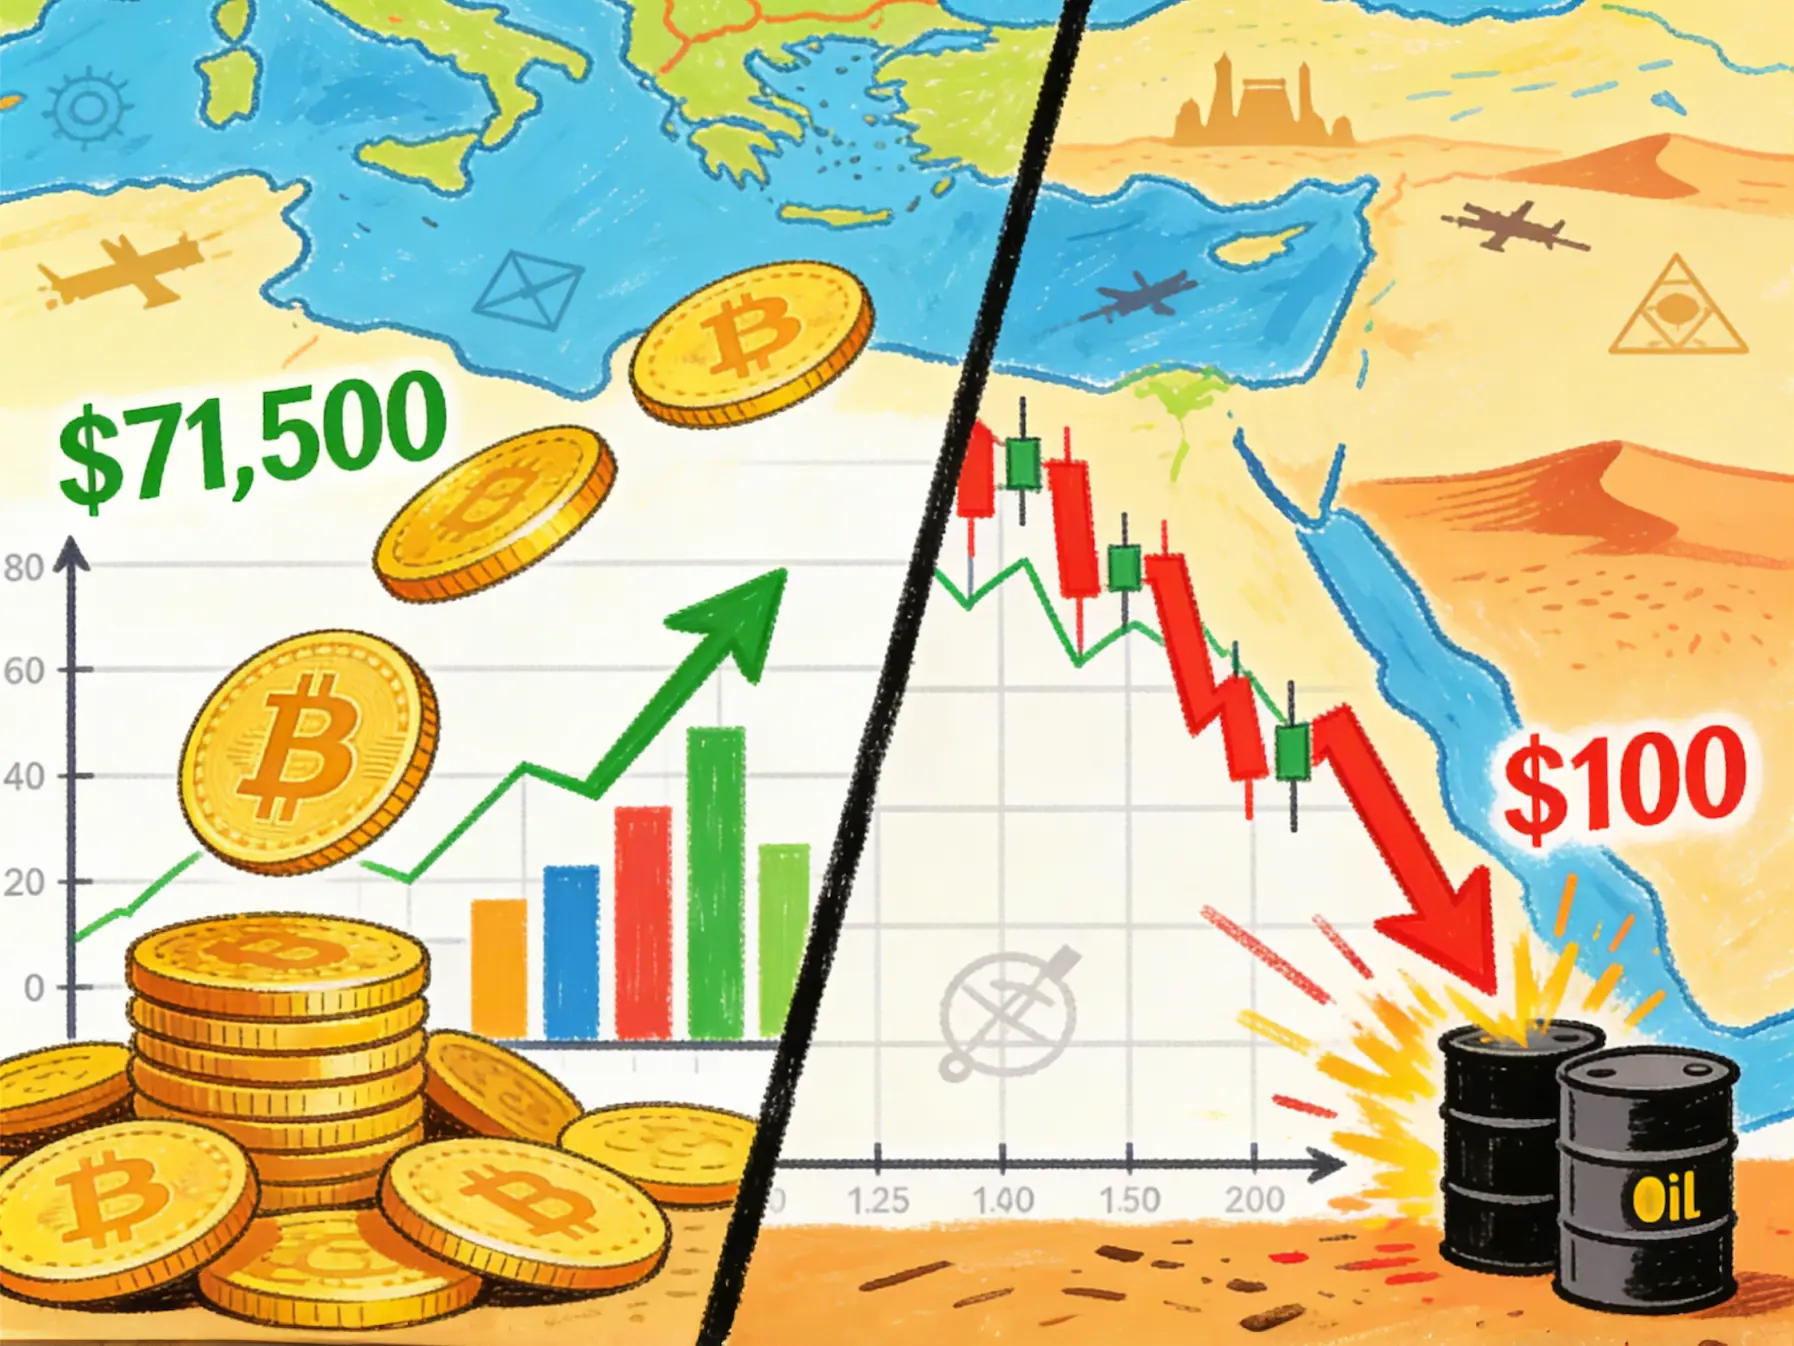
 Bitcoin has climbed 2.6 percent to approximately $71,500, reaching its highest level in a week, defying sharp declines in U.S. equities and a surge in oil prices past $100 per barrel amid escalating Middle East tensions.
Analysts attribute the resilience to crypto-specific demand shocks—including record inflows into Strategy’s yield-bearing STRC product and sustained spot ETF accumulation—rather than a permanent decoupling from macro risks, as technical indicators suggest Bitcoin is approaching key resistance at $72,000.
Bitcoin’s Divergent Performance Amid Geopolitical Chaos
Macro Backdrop: Oil Spikes, Equities Slide
The ongoing U.S.-Israel conflict with Iran, which began on February 28, 2026, has entered its 13th day, disrupting global energy markets. Fears over the security of the Strait of Hormuz—a chokepoint for roughly one-fifth of the world’s oil supply—sent Brent crude futures soaring 9.2 percent on Thursday to surpass $100 per barrel for the first time since 2022, marking its largest one-day gain since the pandemic era.
U.S. President Donald Trump acknowledged the trade-off in a Truth Social post, stating that while higher oil prices benefit the United States as the world’s largest producer, stopping Iran from acquiring nuclear weapons remains the far greater priority.
The spike in energy costs ignited immediate inflation concerns, battering equity markets. The S&P 500 fell 1.52 percent, the Dow dropped 1.56 percent, and the tech-heavy Nasdaq shed 1.73 percent, as rising Treasury yields priced out expectations for near-term Federal Reserve rate cuts.
Bitcoin’s Unexpected Strength
Despite this risk-off environment, Bitcoin has clawed back losses since the conflict erupted, trading at $71,500—a level unseen since March 6. The cryptocurrency briefly touched an intraday high of $71,750, now consolidating near the 23.6 percent Fibonacci retracement level of its recent swing low to high.
This resilience challenges historical patterns. During previous Middle East conflicts, Bitcoin fell sharply and only recovered after de-escalation signals. The inflation hedge narrative has been repeatedly disproven, with Bitcoin currently trading as a risk asset rather than a commodity.
Institutional Floors and Crypto-Native Catalysts
ETF Inflows Act as a Shock Absorber
The presence of regulated spot Bitcoin ETFs has fundamentally altered market structure. Through the first ten days of March, U.S. spot Bitcoin ETFs pulled in roughly $1 billion in net inflows, with BlackRock’s IBIT and Fidelity’s FBTC leading the charge. Even a $227 million outflow on March 5 was absorbed without breaking momentum. Data from March 10 alone showed a combined net inflow of $218.66 million, led by IBIT at $153.49 million.
This institutional capital behaves differently than retail money. ETF-driven markets move slower on the way up but do not break as easily on the way down. The proportion of wealth held by long-term entities remains at historical highs, restricting the circulating supply available for panic liquidation.
The Strategy Effect: STRC Demand Driving Purchases
Bitcoin’s strength relative to equities may reflect less of a macro decoupling and more of a structural demand shock originating within the crypto market itself. Strategy’s (formerly MicroStrategy) preferred equity issuance, STRC, is a variable-rate perpetual preferred stock offering an 11.5 percent annualized yield tied to Bitcoin exposure.
The product has been attracting hundreds of millions of dollars in demand per day since the yield increase, with those inflows ultimately translating into direct purchases of Bitcoin. On March 10, STRC recorded a record $409 million in daily trading volume. By March 11, cumulative estimates suggested Strategy had purchased over 1,200 BTC that day alone through STRC proceeds.
This follows the firm’s disclosure earlier in the week that it acquired nearly 18,000 BTC for $1.28 billion, funded through a combination of common stock and STRC issuance. The potential demand for an 11.5 percent yield product tied to Bitcoin exposure appears extraordinary, with flows of that size capable of lifting not only Bitcoin but the broader crypto market.
Technical Picture: Wedge Pattern Nears Apex
Immediate Resistance at $72,000
On the 2-hour chart, Bitcoin is trading within a rising wedge pattern that has been compressing since early February. The price is currently pressing against the first key resistance zone near $72,000.
A clean break and hold above $72,000 could open the door to $80,000, with subsequent targets at $84,000 and $90,000. However, wedge patterns typically resolve to the downside, and the chart acknowledges this risk with a potential flush toward $64,000 before any sustainable recovery.
Critical Support Levels
Immediate support sits at $70,400, with the psychological $70,000 level acting as a major floor. A break below $70,000 would likely test the $68,800 zone, where the 50 percent Fibonacci retracement of the recent upswing aligns. The last major defense before structural breakdown is $64,000, a demand zone that has held twice within the wedge.
While Bitcoin is showing strength, the deciding factor will ultimately be global liquidity. In 2022, the Bitcoin price drop was driven primarily by the Federal Reserve’s aggressive hiking cycle to curb inflation. If the same scenario plays out and global liquidity tightens, Bitcoin’s current strength could be undermined.
Taleb Weighs In: X Money vs. Bitcoin
Amid the market turbulence, renowned author and “Black Swan” theorist Nassim Nicholas Taleb reignited the debate over Bitcoin’s utility, calling Elon Musk’s forthcoming X Money platform “much, much smarter than Bitcoin.” Responding to Musk’s announcement that X Money will launch early public access in April, Taleb posted that private currencies must compete with one another.
Taleb, a long-time Bitcoin critic who has argued the asset is fragile and has failed as both a currency and a hedge, framed X Money as a legitimate private currency competing with state money. The X Money beta, rolled out earlier this month, uses fiat currency backed by a real bank, is partnered with Visa, and offers a physical debit card—elements Taleb views as providing infrastructural resilience and everyday utility that Bitcoin lacks due to its volatility.
While the crypto community pushed back, noting X Money is structurally similar to PayPal or Zelle, the commentary underscores a persistent narrative divide: Bitcoin’s role as a decentralized store of value versus corporate-backed, fiat-integrated payment systems.
FAQ: Bitcoin’s Rally Amid Geopolitical Tensions
Q: Why is Bitcoin rising while stocks are falling?
A: Analysts point to crypto-specific demand rather than a permanent macro decoupling. Key drivers include record inflows into U.S. spot Bitcoin ETFs—which act as a structural shock absorber—and significant buying pressure from Strategy funded by its 11.5 percent yield STRC preferred stock.
Q: What are the key technical levels for Bitcoin?
A: Immediate resistance is at $72,000. A breakout above this level could target $80,000 and $90,000. Key support lies at $70,000, with stronger floors at $68,800 and $64,000. A failure to hold support could lead to a retest of the wedge’s lower boundary.
Q: How does the oil price surge affect Bitcoin?
A: Rising oil prices increase inflation expectations, which typically lead to higher Treasury yields and reduce the probability of Federal Reserve rate cuts. This tightens global liquidity, historically a headwind for Bitcoin. However, current crypto-native demand is temporarily overwhelming these macro pressures.
Q: Why did Nassim Taleb call X Money “smarter than Bitcoin”?
A: Taleb views private currencies issued by large platforms like X as more practical for everyday transactions due to their stability, integration with traditional banking, and existing user bases. He has long criticized Bitcoin for its volatility, which he argues undermines its utility as a medium of exchange.