Ethereum is showing superior performance compared to Bitcoin as tensions between the U.S., Israel, and Iran continue to impact the global market.
Data shows ETH has increased by 18% since the beginning of March, while Bitcoin has only risen 13% in the same period. The ETH/BTC ratio also increased by 7.6%, rising from 0.0293 to 0.0315 in less than three weeks, reflecting Ethereum’s growing relative strength rather than just following the overall market trend.
This momentum pushed ETH above $2,300 and headed toward its first monthly gain since August 2025. Notably, the rally occurred amid macroeconomic pressures, as risks of conflict and rising energy prices are reshaping inflation and monetary policy expectations.
Military conflicts have pushed Brent crude oil above $102 per barrel and WTI over $95, as markets fear disruptions at the Strait of Hormuz — a shipping route accounting for about 20% of global oil and LNG flows. Rising oil prices often lead to higher inflation expectations, increasing the likelihood that central banks will maintain tightening policies longer.
In previous periods, this environment typically supported Bitcoin as a safe haven asset. However, this time, Ethereum is leading the rally, indicating that capital is focusing on Ethereum-specific factors such as market structure, network activity, and its position with institutional investors, rather than just seeking refuge from geopolitical risks.
According to Matrixport, Ethereum increasingly exhibits characteristics of a financial asset, helping to explain why the crypto market has recently maintained relative strength compared to other asset classes.
Institutional Money Returning to Ethereum
Capital flows from Wall Street are returning to Ethereum at a notable pace. Data from SoSoValue shows that nine spot ETH ETF funds recorded over $160 million in net inflows last week — the highest since mid-January. This trend continued as these funds attracted an additional $35.9 million on March 16.
This movement reinforces the view that institutional investor demand is recovering after a period of weakness.
Notably, BlackRock recently launched an Ethereum staking ETF with ticker ETHB, allowing investors to gain exposure to price volatility while earning staking rewards. The fund raised $104.7 million in seed capital and attracted an additional $45.7 million in just the first two trading days.
This structure positions Ethereum as a cash-flow-generating asset, which is particularly attractive to portfolio managers seeking yields when allocating to alternative assets.
Meanwhile, companies are also accumulating ETH on their balance sheets. BitMine has significantly expanded its Ethereum reserves, aiming to hold up to 5% of the total supply. In just the first two weeks of March, the company purchased over 100,000 ETH, bringing its total holdings close to 4.6 million ETH by mid-month.
Speculative Demand Returns but with Caution
Data from CryptoQuant shows that the derivatives market was “reset” after the flash crash on October 10, when approximately $19 billion in leveraged positions were liquidated within 24 hours.
On Binance, Ethereum’s estimated leverage ratio decreased by 27% following this event, reflecting a sharp reduction in speculative activity. However, by mid-March, leverage had gradually increased again along with improved market sentiment, indicating that speculative capital is returning more cautiously than in previous cycles.
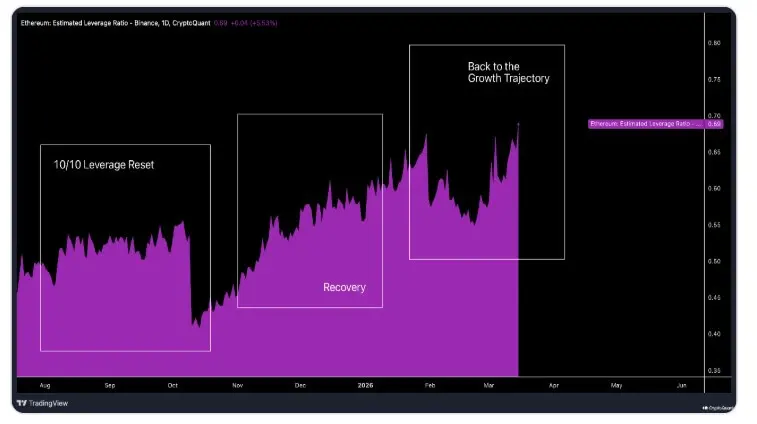 *Estimated leverage ratio of Ethereum on Binance (Source: CryptoQuant)*Data from BlockScholes also shows that ETH’s risk appetite index has recovered from its lows, indicating increased willingness to hold this asset as market conditions stabilize.
From a market structure perspective, short-term selling pressure is easing. The amount of ETH deposited on Binance over the past 30 days has fallen to around $20.2 billion — the lowest since May 2025 — suggesting fewer tokens are being put on the exchange for sale.
At the same time, many investors are transferring ETH to private wallets and staking, reducing circulating supply on spot markets and making prices more sensitive to new buying interest.
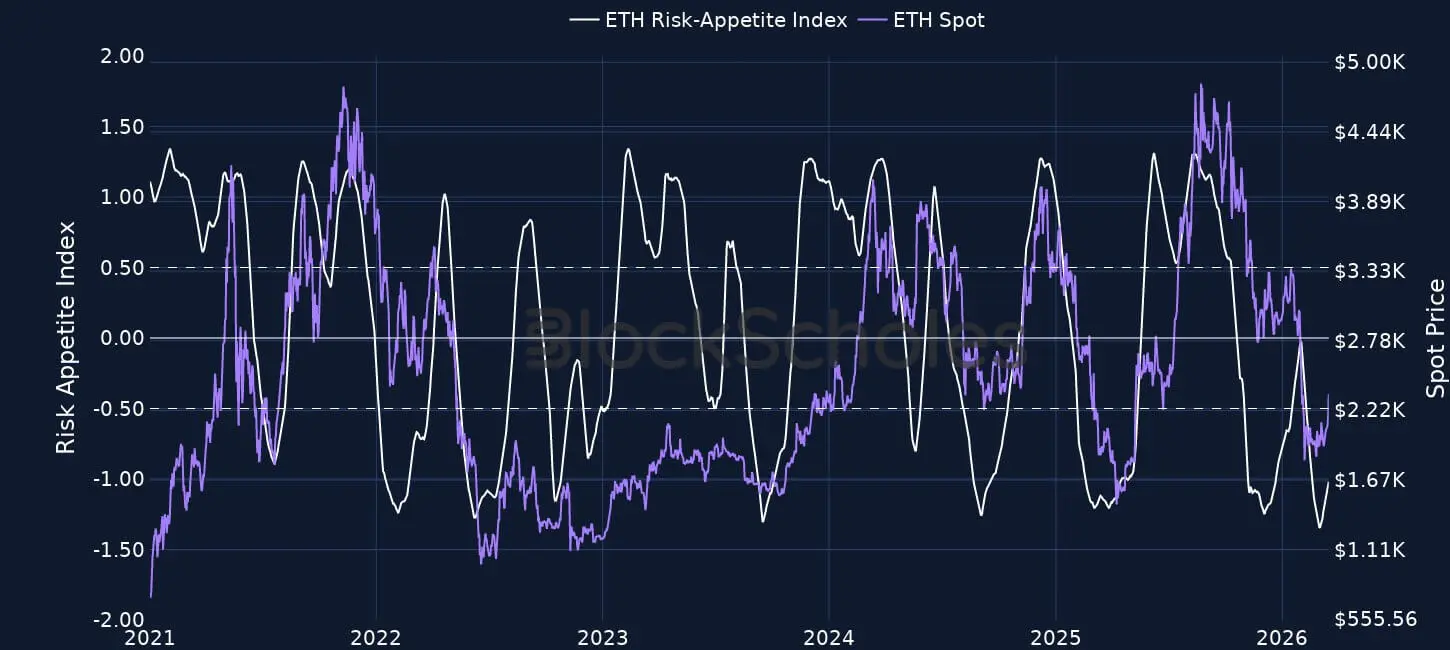 Ethereum risk acceptance index (Source: BlockScholes)## Network Fundamentals Support the Uptrend
Ethereum’s underlying fundamentals are also supporting the upward trend. According to Everstake, the network is on track to record its most active quarter in over a year.
Ethereum has processed over 150 million transactions and has 27.7 million active addresses in the current quarter — both higher than the 2025 annual averages. Throughput has also hit a record 2.52 million gas per second, reflecting increased demand for decentralized applications.
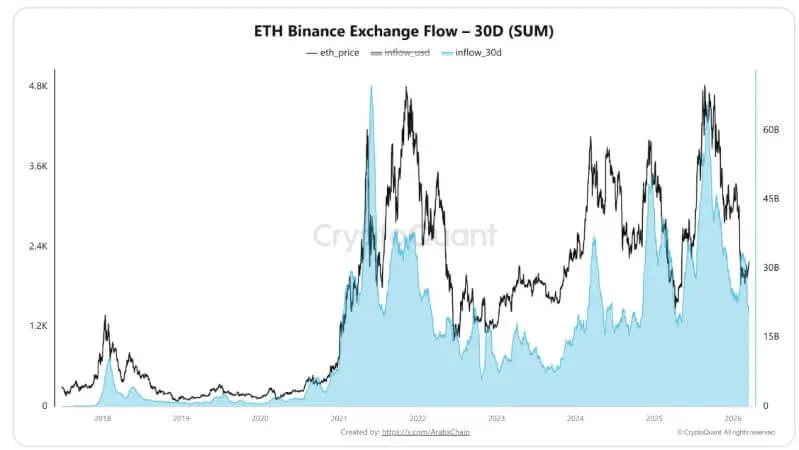 *Ethereum capital inflow into Binance (Source: CryptoQuant)*Part of the momentum comes from Ethereum’s role in the tokenization of real-world assets (RWA). Data from Token Terminal shows Ethereum is handling approximately $200 billion in tokenized financial assets, capturing 61% of the market share.
Regarding supply, after transitioning to proof-of-stake, ETH’s issuance rate is about 0.24% per year — significantly lower than Bitcoin’s 1.28% after its most recent halving, according to Lisk analysis.
Combining these factors, Ethereum is gathering multiple drivers: increasing real-world usage, returning institutional capital, slow supply growth, and improving market structure. This helps ETH maintain its outperformance against Bitcoin in the current phase.
Disclaimer: The information on this page may come from third parties and does not represent the views or opinions of Gate. The content displayed on this page is for reference only and does not constitute any financial, investment, or legal advice. Gate does not guarantee the accuracy or completeness of the information and shall not be liable for any losses arising from the use of this information. Virtual asset investments carry high risks and are subject to significant price volatility. You may lose all of your invested principal. Please fully understand the relevant risks and make prudent decisions based on your own financial situation and risk tolerance. For details, please refer to
Disclaimer.
