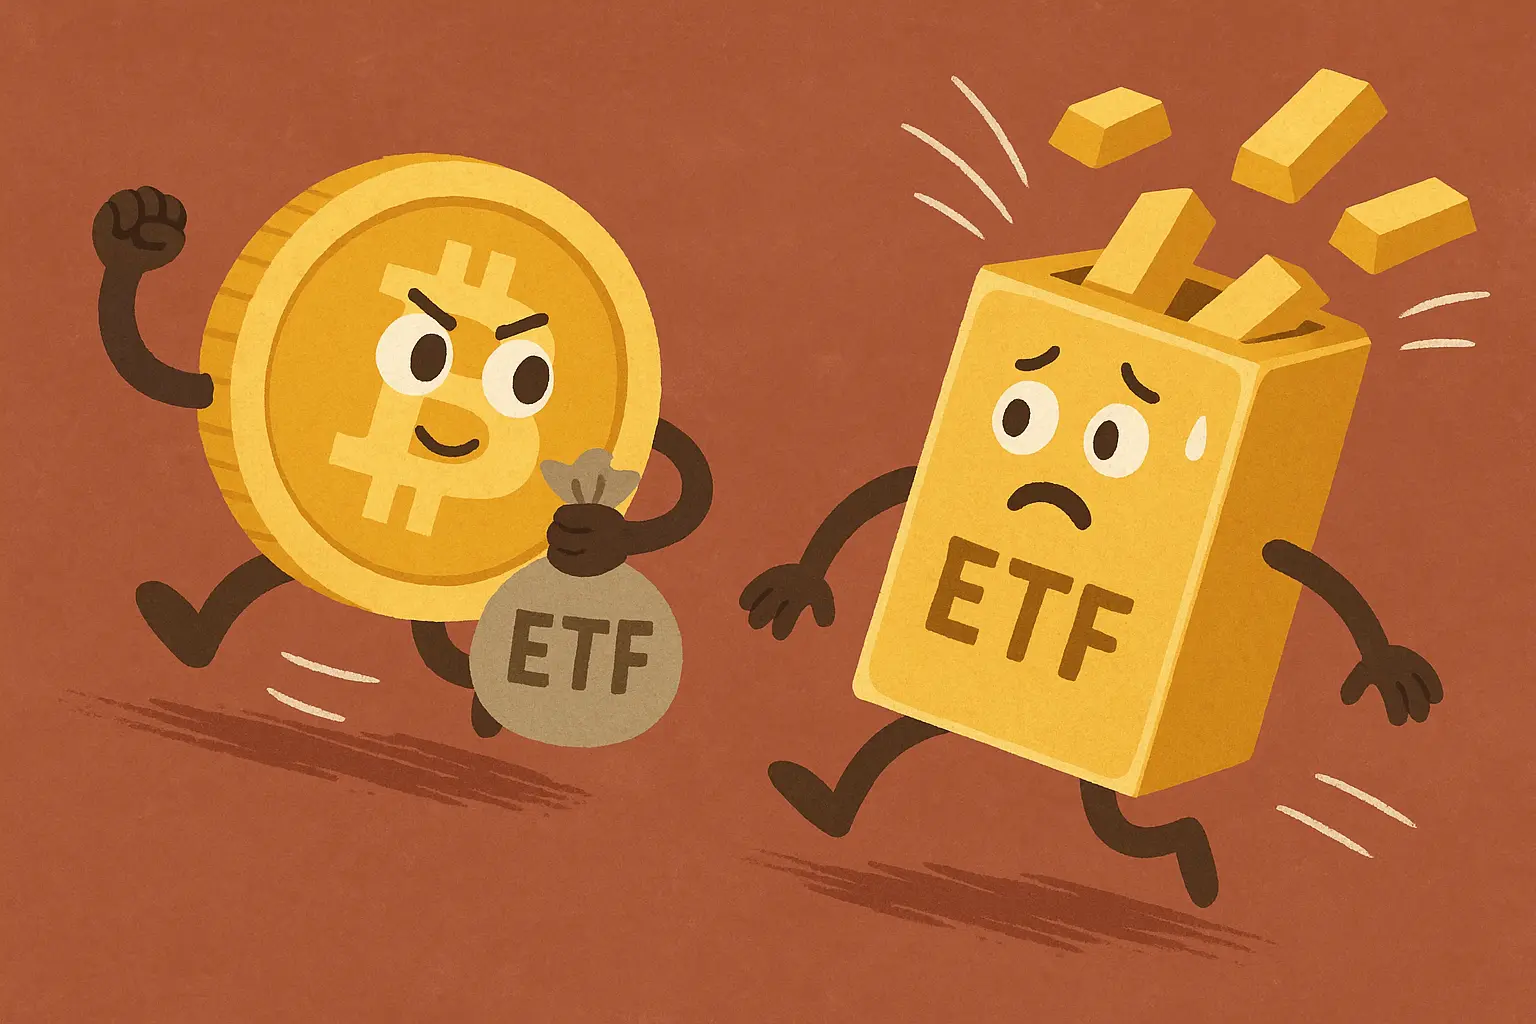
On March 23, the U.S. spot Bitcoin ETF recorded a net inflow of $167 million, ending a streak of three consecutive days of capital outflows. Meanwhile, the SPDR Gold Trust (GLD) experienced its largest single-day outflow since 2016, amounting to $2.91 billion on March 4. According to CryptoQuant data, the correlation between Bitcoin and gold has fallen to -0.88.
Bitcoin ETF Recovers Investor Favor: Over $1.53 Billion in Four Weeks
 (Source: X)
According to SoSoValue data, as of March 20, U.S. Bitcoin spot ETFs have seen four consecutive weeks of net capital inflows, totaling approximately $1.53 billion. The $167 million inflow on March 23 marks a clear reversal after three days of outflows.
In contrast, Ethereum (ETH) ETFs experienced a net outflow of $16.18 million on the same day, marking the fourth consecutive day of capital exiting. The stark contrast between Bitcoin ETF inflows and ETH ETF outflows indicates that institutional capital is selectively rotating—flowing specifically into Bitcoin-related products rather than the broader cryptocurrency asset class. Bitwise also notes that since March 1, the overall performance of Bitcoin and major cryptocurrencies has outperformed U.S. stocks and gold.
Gold ETF Outflows: Structural Pressure Under the Federal Reserve’s Rate Path
Major Fund Outflows from Gold Funds in March 2026
March 4: GLD experienced a single-day outflow of $2.91 billion, the largest since 2016.
For the week ending March 18: Global gold funds lost approximately $5.19 billion (LSEG Lipper data).
Money Market Funds: Also saw outflows of $32.57 billion.
The structural driver behind gold outflows is the Federal Reserve’s interest rate policy: maintaining rates in March and projecting the benchmark rate to stay at 3.4% through the end of 2026. Elevated real interest rates increase the opportunity cost of holding non-yielding gold, prompting institutional capital to actively shift toward assets with different risk profiles. Notably, the World Gold Council indicates that in 2025, global physical gold demand will surpass 5,000 tons for the first time, with central banks purchasing 863 tons, suggesting that the capital outflows from financial markets are not due to a fundamental collapse in physical gold demand.
Reversal in Correlation Between Bitcoin and Gold: Structural Rotation or Short-term Divergence?
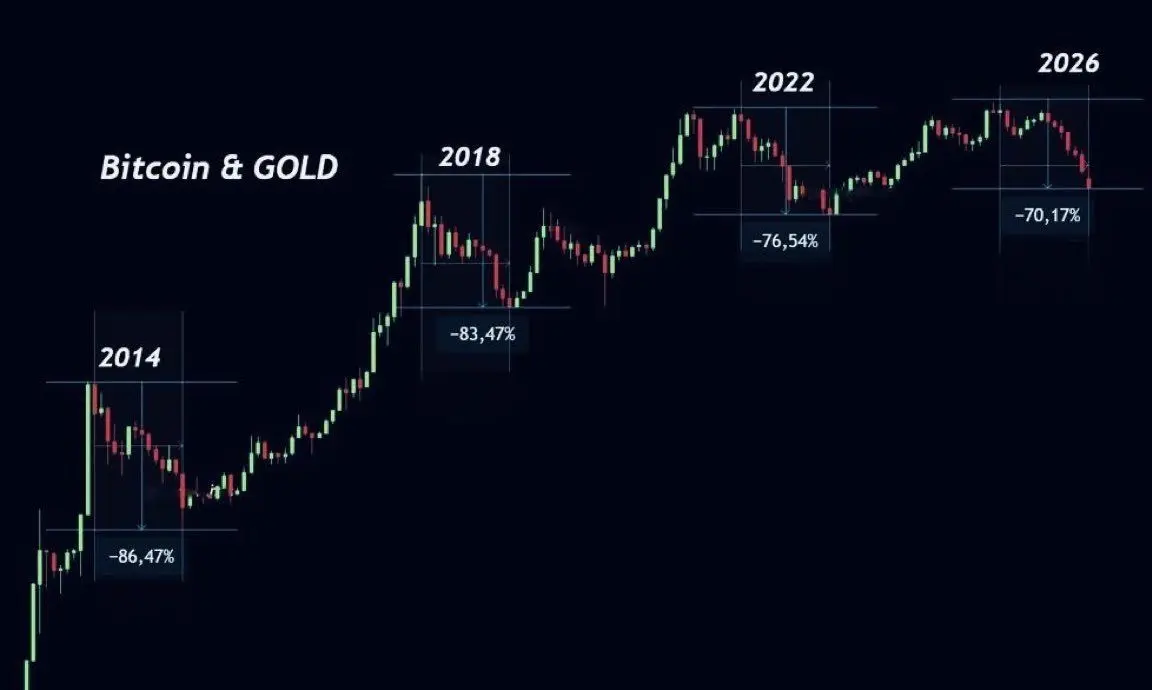
The correlation between Bitcoin and gold has fallen to -0.88, indicating a strong statistical negative relationship. Currently, Bitcoin remains above $70,000, while gold has significantly retreated from its highs this year. The divergence in their price movements is among the most pronounced in years.
Bitwise points out that historically, gold prices lead Bitcoin by 4 to 7 months. If this pattern holds, the recent correction in gold could foreshadow potential pressure on Bitcoin in the future. However, some analysts believe that the current trend more likely reflects active rebalancing by institutional investors in a high-interest-rate environment rather than a cyclical asset correlation reversion. Whether this divergence signifies a lasting asset rotation or a temporary deviation depends on the Fed’s rate trajectory and developments in the Middle East conflict in Q2.
FAQs
Why did Bitcoin ETFs attract capital during a period of significant gold ETF outflows?
The Federal Reserve’s sustained high interest rates increased the opportunity cost of holding non-yielding gold, prompting institutional funds to shift into assets like Bitcoin with different yield characteristics. Additionally, since March 1, Bitcoin ETFs have outperformed U.S. stocks and gold overall, providing tangible return incentives for capital reallocation.
What does a correlation of -0.88 between Bitcoin and gold imply?
A -0.88 correlation indicates a strong negative relationship—when one rises, the other tends to fall. This is the lowest since the FTX collapse in November 2022, reflecting a fundamental shift in investor behavior and capital flows between these two assets.
Does the outflow from gold funds indicate a long-term reversal in gold’s trend?
Not necessarily. Data from the World Gold Council shows that in 2025, global physical gold demand will exceed 5,000 tons for the first time, with central banks purchasing 863 tons, indicating robust long-term physical demand. The current ETF outflows mainly reflect institutional rebalancing in a high-interest-rate environment rather than a fundamental shift in gold’s long-term demand.
Disclaimer: The information on this page may come from third parties and does not represent the views or opinions of Gate. The content displayed on this page is for reference only and does not constitute any financial, investment, or legal advice. Gate does not guarantee the accuracy or completeness of the information and shall not be liable for any losses arising from the use of this information. Virtual asset investments carry high risks and are subject to significant price volatility. You may lose all of your invested principal. Please fully understand the relevant risks and make prudent decisions based on your own financial situation and risk tolerance. For details, please refer to
Disclaimer.
