Bitcoin (BTC) is currently trading around $71,342, continuing to face strong resistance at $72,000. However, the bulls still maintain significant pressure. Trader Daan Crypto Trades on X stated that BTC needs to break through and hold above this level to have a chance to “retest the $80,000 mark.”
The capital market dislikes uncertainty, but BTC’s ability to hold its price since the US and Israel–Iran tensions escalated shows traders are not ready to sell at low levels. According to CryptoQuant analyst Darkfost, March saw most BTC withdrawals from exchanges. Although demand isn’t strong enough to form a new uptrend, this movement reflects ongoing accumulation.
An supporting factor for the accumulation trend is the belief that BTC is currently attractively valued. Charles Edwards, founder of Capriole Investments, believes BTC is in a “deep value zone” according to the BTC Yardstick index. Notably, in February, this index fell below the 2022 bear market lows.
The question is whether BTC and large-cap altcoins can sustain their upward momentum and break through higher resistance levels. The section below will analyze the top 10 cryptocurrencies in detail.
Technical Analysis of BTC
BTC continues to trade within an ascending triangle pattern — a sign that the bulls are trying to regain control.
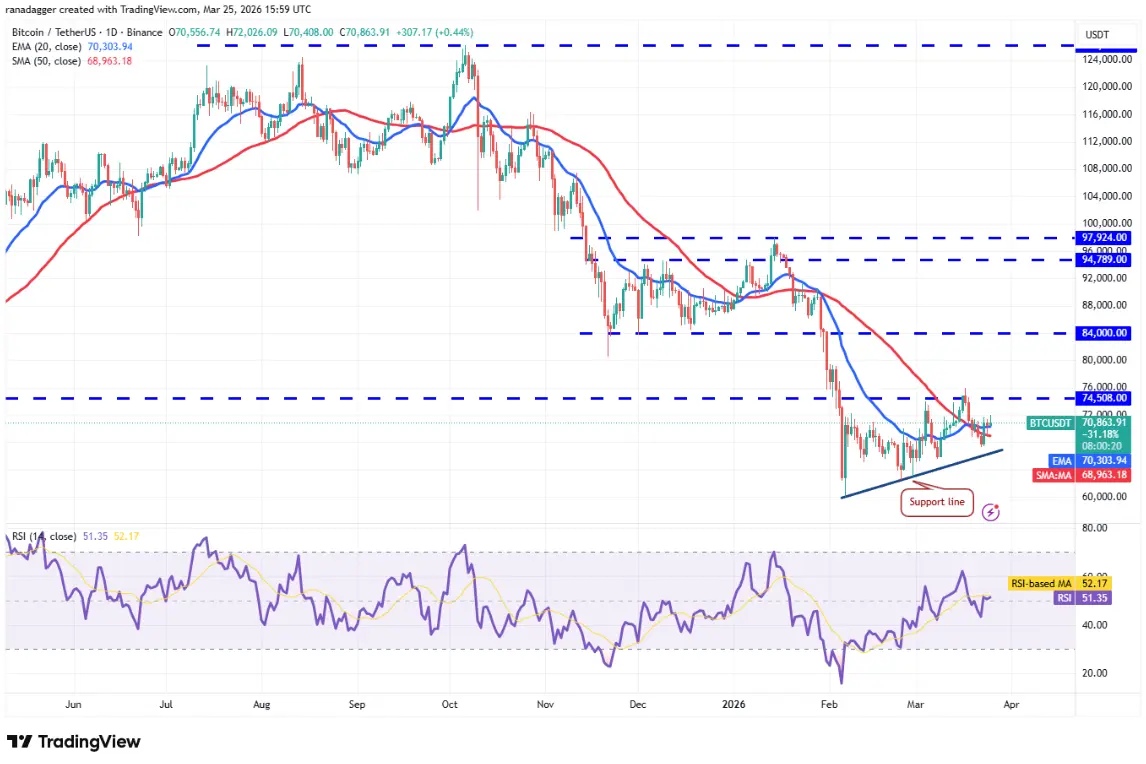 Daily BTC/USDT chart | Source: TradingView
The 20-day EMA ($70,303) is flat, and RSI is near the midpoint, indicating no clear advantage for either side. If the price breaks and sustains above $74,508, the pattern will complete, potentially pushing BTC/USDT to $84,000.
Daily BTC/USDT chart | Source: TradingView
The 20-day EMA ($70,303) is flat, and RSI is near the midpoint, indicating no clear advantage for either side. If the price breaks and sustains above $74,508, the pattern will complete, potentially pushing BTC/USDT to $84,000.
Conversely, if the price declines and breaks below the support line, the bulls may have given up. In that case, the price could drop sharply to the $62,500–$60,000 zone.
Technical Analysis of ETH
ETH has bounced from the 50-day SMA ($2,042), indicating positive sentiment.
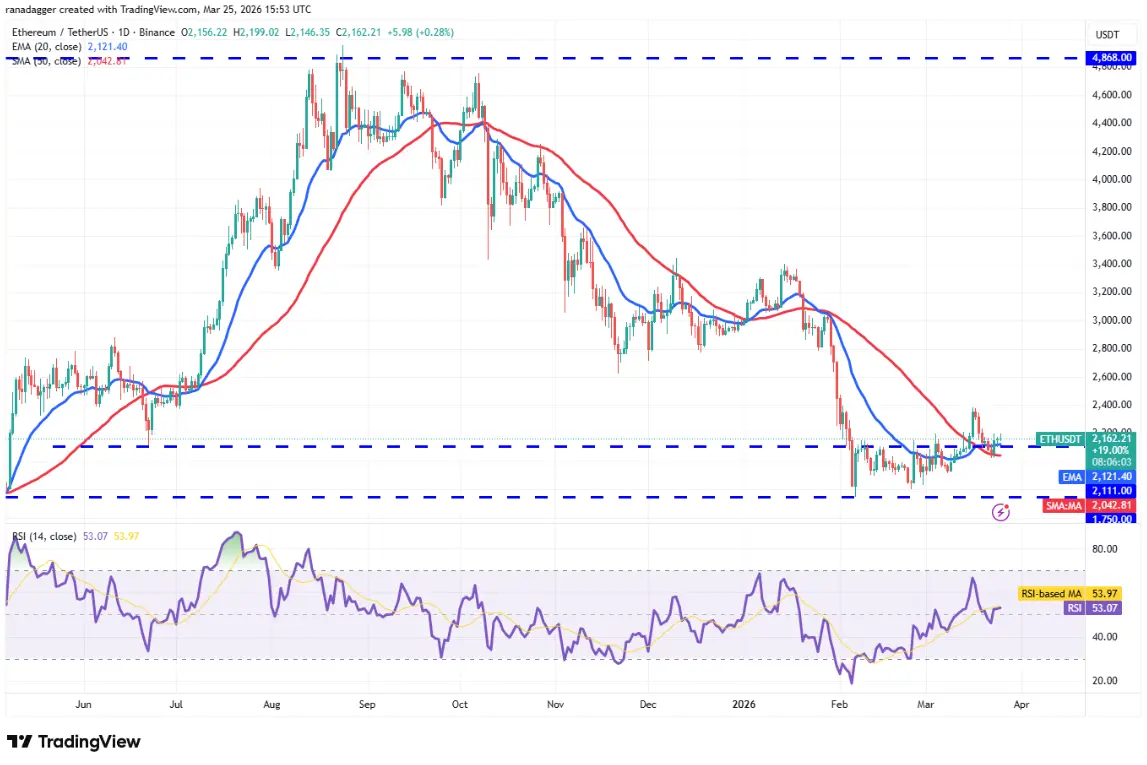 Daily ETH/USDT chart | Source: TradingView
The 20-day EMA ($2,121) is flat, and RSI is neutral, reflecting a balance of supply and demand. If ETH surpasses $2,400, it could rise to $2,600 and then to $3,050.
Daily ETH/USDT chart | Source: TradingView
The 20-day EMA ($2,121) is flat, and RSI is neutral, reflecting a balance of supply and demand. If ETH surpasses $2,400, it could rise to $2,600 and then to $3,050.
On the other hand, if the price drops and breaks below the 50-day SMA, it suggests the market is rejecting higher prices above $2,111. ETH could then fall to $1,900 and eventually to $1,750.
Technical Analysis of BNB
BNB bulls are trying to keep the price above the 20-day EMA ($643), but bears are exerting strong pressure.
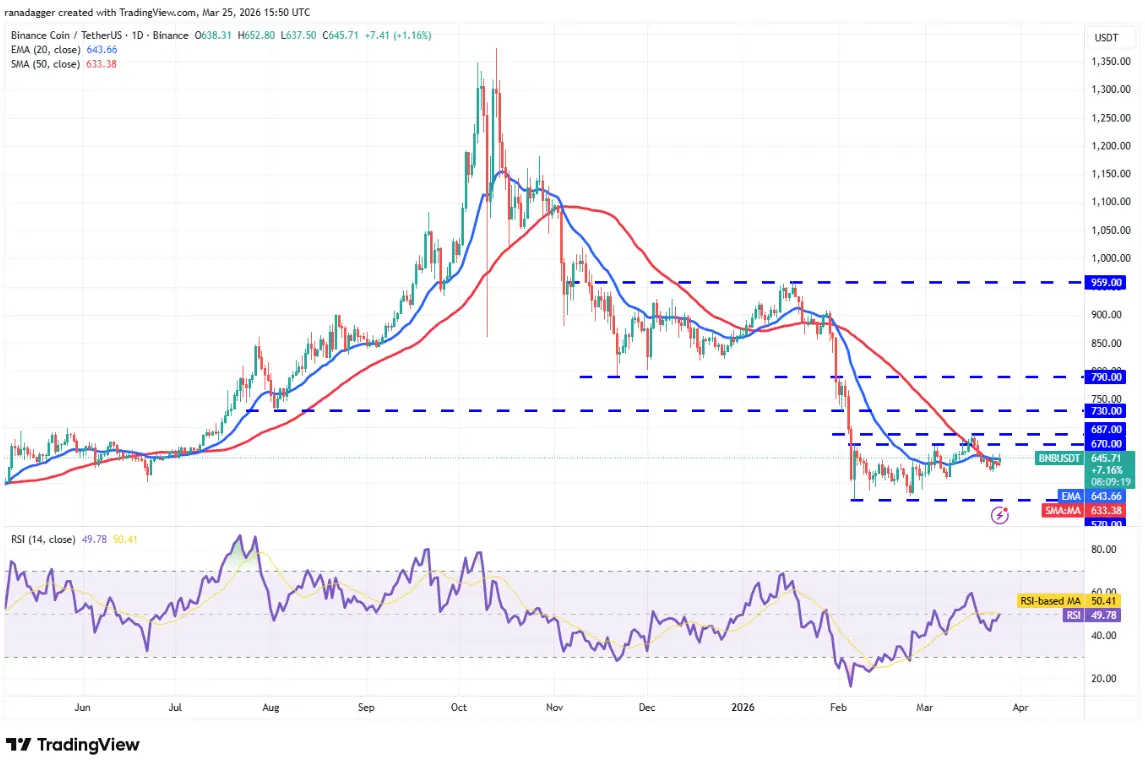 Daily BNB/USDT chart | Source: TradingView
The 20-day EMA is flat, and RSI is below average, indicating the price may continue to fluctuate between $570 and $687. The longer the accumulation, the stronger the potential breakout.
Daily BNB/USDT chart | Source: TradingView
The 20-day EMA is flat, and RSI is below average, indicating the price may continue to fluctuate between $570 and $687. The longer the accumulation, the stronger the potential breakout.
If the price breaks above $687, it could rise to $730 and then to $790. Conversely, if it falls below $600, bears will dominate, and the price could drop back to $570.
Technical Analysis of XRP
XRP bears are trying to keep the price below the moving averages, but bulls are still exerting pressure.
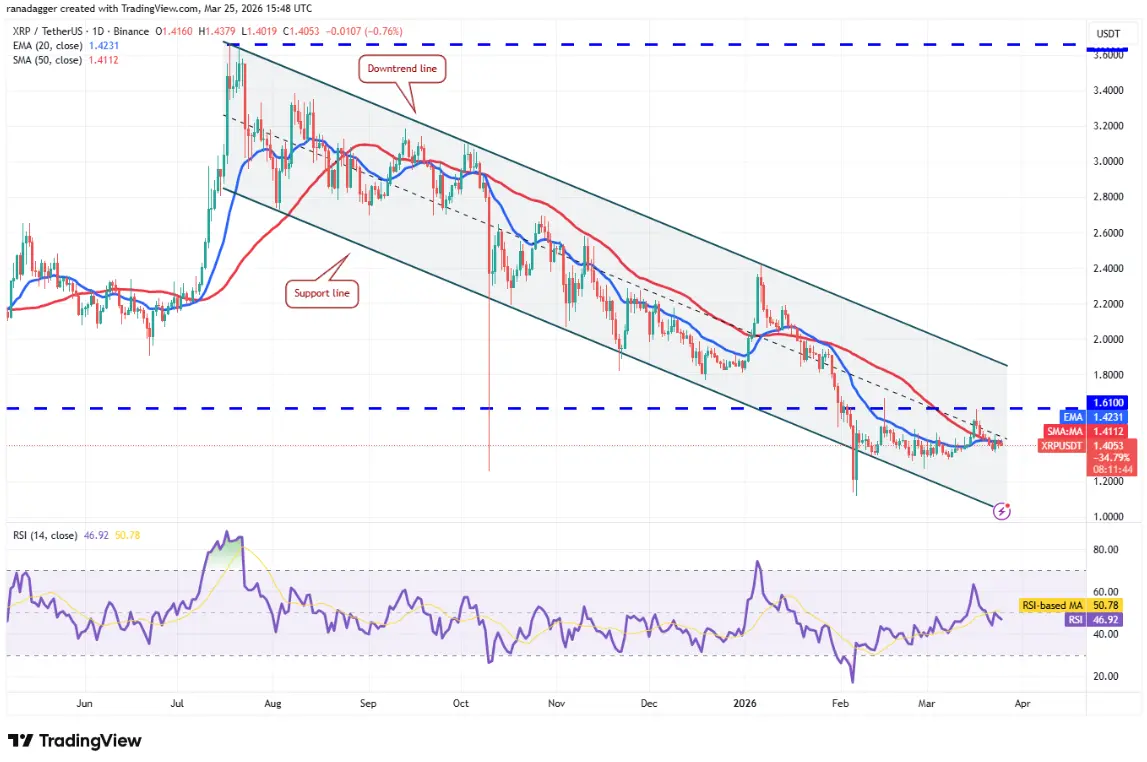 Daily XRP/USDT chart | Source: TradingView
If the price breaks above and holds above the moving averages, XRP could rise to $1.61 and continue its downward trend. Breaking this level could signal a trend reversal.
Daily XRP/USDT chart | Source: TradingView
If the price breaks above and holds above the moving averages, XRP could rise to $1.61 and continue its downward trend. Breaking this level could signal a trend reversal.
On the other hand, if the price drops below $1.27, bears will maintain control, and the price could fall to the channel support line.
Technical Analysis of SOL
SOL is oscillating between the 50-day SMA ($86) and resistance at $95.
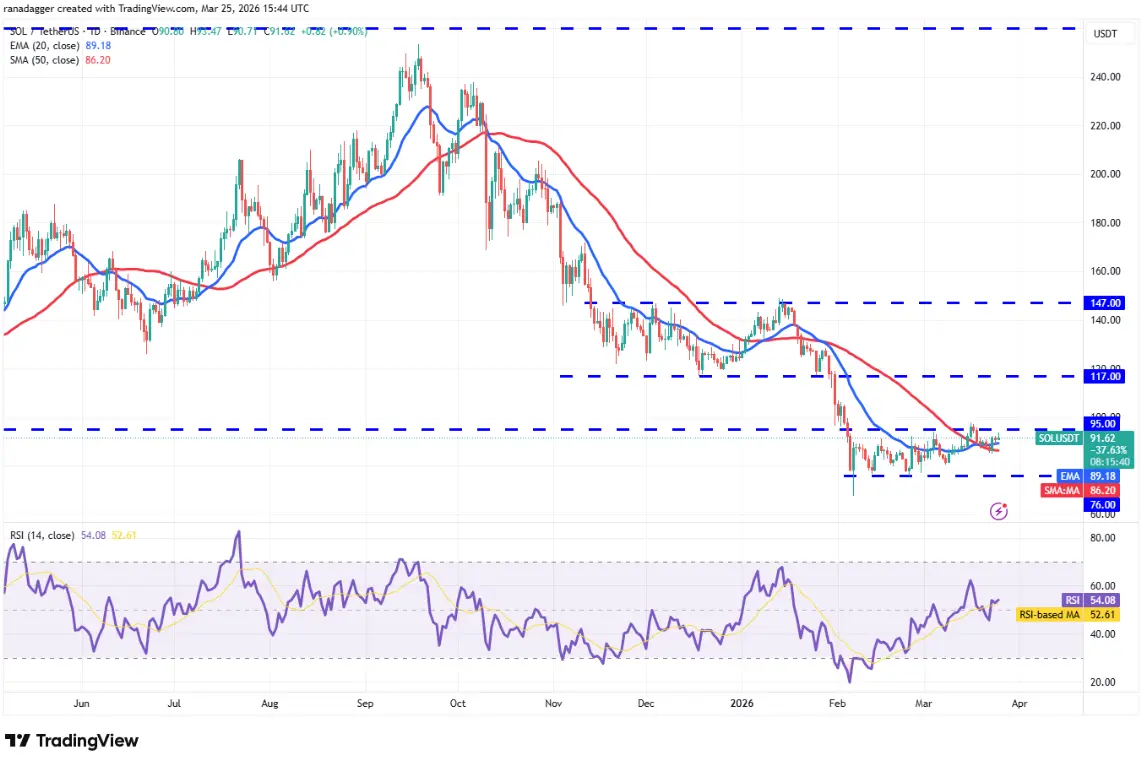 Daily SOL/USDT chart | Source: TradingView
The 20-day EMA is slightly upward sloping, and RSI is above average, indicating bulls are slightly in control. If SOL surpasses $95, it could rise to $117.
Daily SOL/USDT chart | Source: TradingView
The 20-day EMA is slightly upward sloping, and RSI is above average, indicating bulls are slightly in control. If SOL surpasses $95, it could rise to $117.
If the price drops below the 50-day SMA, bears will regain control, and the price could retreat to the $76–$95 range.
Technical Analysis of DOGE
DOGE bounced from support at $0.09 but has yet to break above the moving averages.
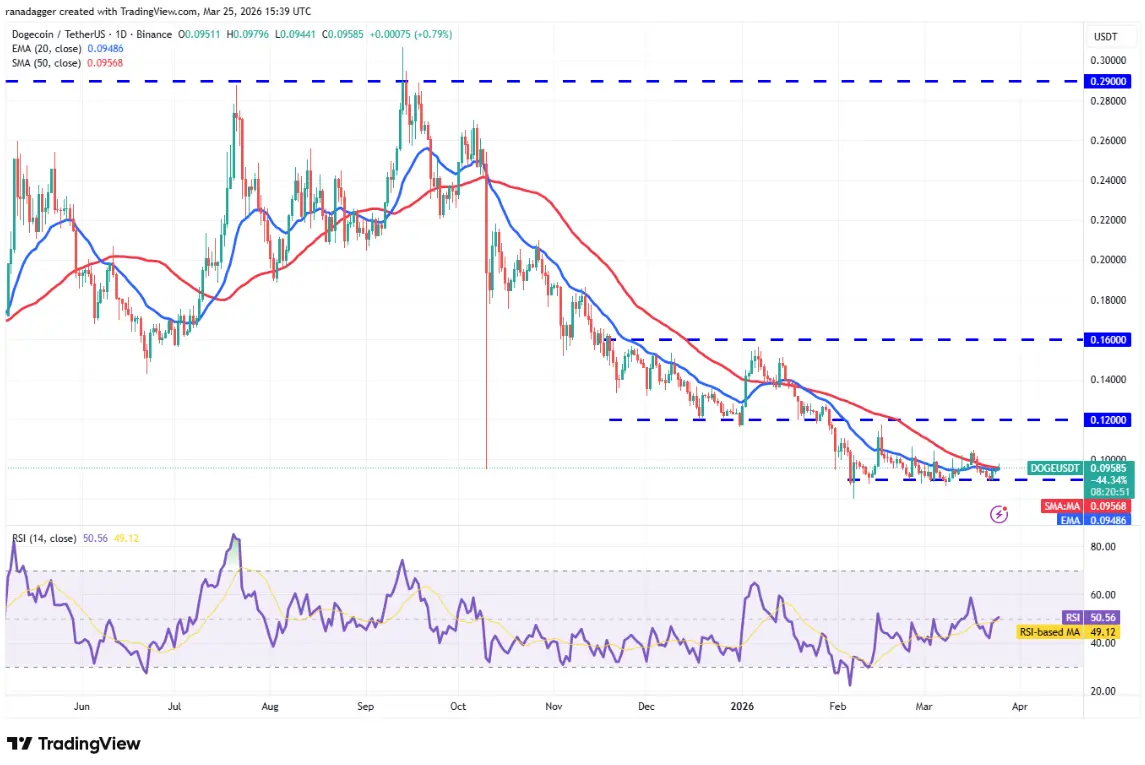 Daily DOGE/USDT chart | Source: TradingView
If it gets rejected here, the likelihood of breaking below $0.09 increases, pushing the price down to $0.06.
Daily DOGE/USDT chart | Source: TradingView
If it gets rejected here, the likelihood of breaking below $0.09 increases, pushing the price down to $0.06.
Conversely, if it closes above the moving averages, it indicates strong buying pressure at $0.09. DOGE could then rise to $0.10 and $0.12 — significant resistance zones.
Disclaimer: The information on this page may come from third parties and does not represent the views or opinions of Gate. The content displayed on this page is for reference only and does not constitute any financial, investment, or legal advice. Gate does not guarantee the accuracy or completeness of the information and shall not be liable for any losses arising from the use of this information. Virtual asset investments carry high risks and are subject to significant price volatility. You may lose all of your invested principal. Please fully understand the relevant risks and make prudent decisions based on your own financial situation and risk tolerance. For details, please refer to
Disclaimer.
