Trade
Basic
Futures
Futures
Hundreds of contracts settled in USDT or BTC
TradFi
Gold
Trade global traditional assets with USDT in one place
Options
Hot
Trade European-style vanilla options
Unified Account
Maximize your capital efficiency
Demo Trading
Futures Kickoff
Get prepared for your futures trading
Futures Events
Participate in events to win generous rewards
Demo Trading
Use virtual funds to experience risk-free trading
Earn
Launch
CandyDrop
Collect candies to earn airdrops
Launchpool
Quick staking, earn potential new tokens
HODLer Airdrop
Hold GT and get massive airdrops for free
Launchpad
Be early to the next big token project
Alpha Points
Trade on-chain assets and enjoy airdrop rewards!
Futures Points
Earn futures points and claim airdrop rewards
Investment
Simple Earn
Earn interests with idle tokens
Auto-Invest
Auto-invest on a regular basis
Dual Investment
Buy low and sell high to take profits from price fluctuations
Soft Staking
Earn rewards with flexible staking
Crypto Loan
0 Fees
Pledge one crypto to borrow another
Lending Center
One-stop lending hub
VIP Wealth Hub
Customized wealth management empowers your assets growth
Private Wealth Management
Customized asset management to grow your digital assets
Quant Fund
Top asset management team helps you profit without hassle
Staking
Stake cryptos to earn in PoS products
Smart Leverage
New
No forced liquidation before maturity, worry-free leveraged gains
GUSD Minting
Use USDT/USDC to mint GUSD for treasury-level yields
More
ZhouXingxing'sDream
Participate in horse racing betting, complete tasks to earn horse racing tickets, and enjoy a million red envelope rain daily, sharing a prize pool of 100,000 USDT at the Gate 2026 Spring Festival Celebration. https://www.gate.com/competition/year-of-horse-2026?ref_type=165&utm_cmp=7EQB9Jba&ref=VLRBAW9BBW
View Original
- Reward
- 2
- Comment
- Repost
- Share
DOGE Alarm Is Sounding: Is the Countdown for a Rally Starting?
Exciting developments in Dogecoin are coming one after another.
So, can this momentum really push DOGE higher?
Elon Musk Factor Returns to DOGE
According to social data platform LunarCrush, mentions of Dogecoin have increased by 33.19% in the past month compared to the previous month.
This significant rise indicates that interest in meme coins is strongly returning.
According to LunarCrush reports, discussions are centered around three main topics:
Technical analysis of DOGE, Elon Musk’s influence on the token, and DOGE’s deeper in
DOGE-0,16%

- Reward
- 2
- 1
- Repost
- Share
BananaBallaBigOrange :
:
Elon Musk is waiting for you on the Moon
CXU
宸光序
Created By@GateUser-3c8482cc
Subscription Progress
0.00%
MC:
$0
More Tokens
🔹 Institutional Move: Harvard University Q4 Reveals Bitcoin Reduction, Ethereum Increase, and Notable Losses
458
- Reward
- like
- Comment
- Repost
- Share
- Reward
- 1
- Comment
- Repost
- Share
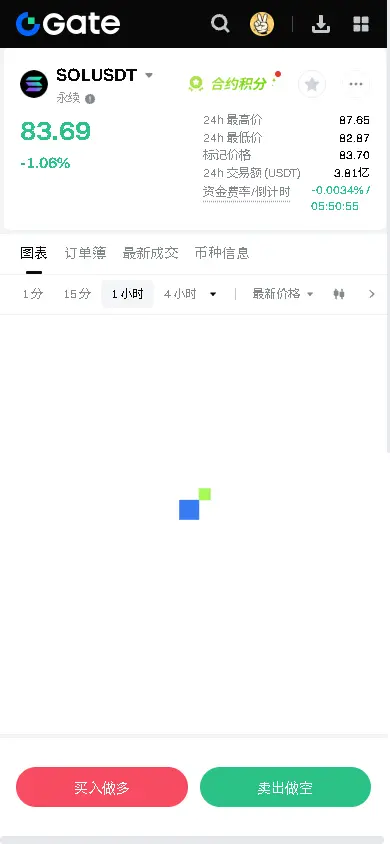
【$SOL Signal】Pullback to Long! 1H RSI Bottom Divergence + 4H Key Support, Clear Signs of Main Force Protecting the Market
$SOL The 1H timeframe is oscillating around a critical support zone (83.0-83.5). RSI( on the 1H chart has dropped to 38.5, showing early signs of bottom divergence, indicating selling exhaustion. Although the 4H chart is below the EMA50, the price has retested the recent support zone's lower boundary, and open interest (OI) remains stable, with no signs of panic selling. Coupled with negative funding rates, there is potential for a short squeeze rebound. Currently, the orde
View Original$SOL The 1H timeframe is oscillating around a critical support zone (83.0-83.5). RSI( on the 1H chart has dropped to 38.5, showing early signs of bottom divergence, indicating selling exhaustion. Although the 4H chart is below the EMA50, the price has retested the recent support zone's lower boundary, and open interest (OI) remains stable, with no signs of panic selling. Coupled with negative funding rates, there is potential for a short squeeze rebound. Currently, the orde
- Reward
- 2
- Comment
- Repost
- Share

- Reward
- 2
- Comment
- Repost
- Share
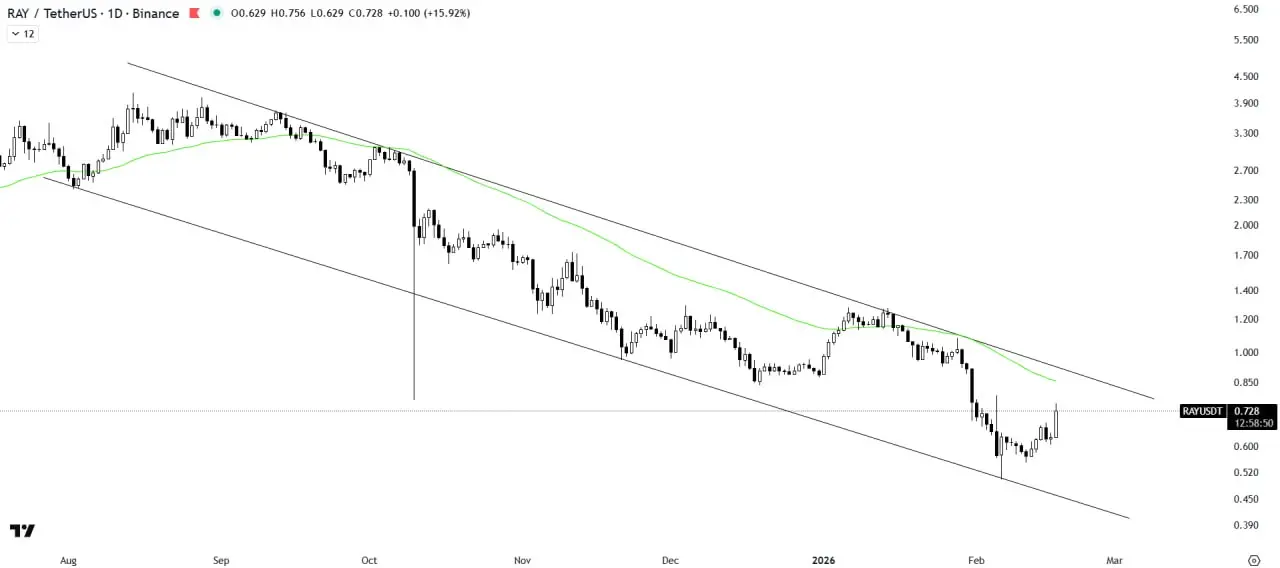
$RAY /USDT ANALYSIS
RAY is holding the descending channel support and showing early strength. The 50MA is the key barrier right below the upper trendline.
Clear breakout above both levels could trigger aggressive upside momentum. Rejection there keeps the structure intact and consolidation in play.$RAY
#GateSpringFestivalHorseRacingEvent #HongKongPlansNewVAGuidelines
RAY8,69%
- Reward
- 2
- Comment
- Repost
- Share
- Reward
- 2
- 4
- Repost
- Share
GateUser-84958c48 :
:
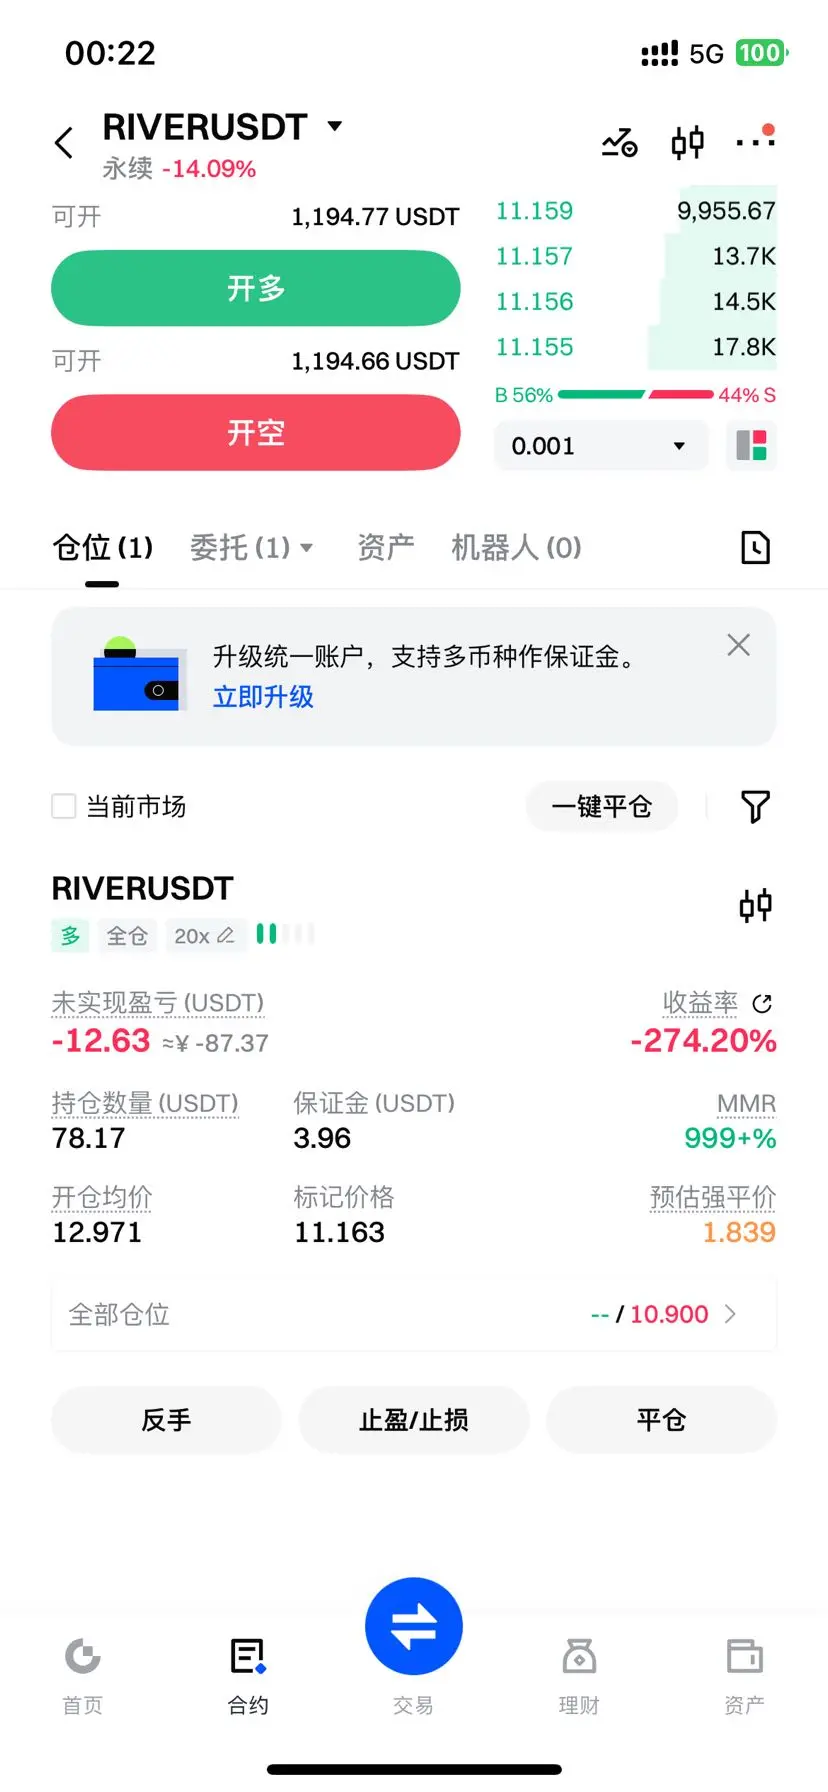
Close your position quickly; once you close it, it will soar.View More
Participate in horse racing betting, complete tasks to earn horse racing tickets, and enjoy a million red envelope rain daily, sharing a prize pool of 100,000 USDT at the Gate 2026 Spring Festival Celebration. https://www.gate.com/competition/year-of-horse-2026?ref_type=165&utm_cmp=7EQB9Jba&ref=VVEWV1AJUQ
View Original
- Reward
- 2
- Comment
- Repost
- Share
Bling Snacks
blingblingsnacks
Created By@PiHomework
Listing Progress
0.00%
MC:
$0.1
More Tokens
Participate in horse racing betting, complete tasks to earn horse racing tickets, and enjoy a million red envelope rain daily, sharing a prize pool of 100,000 USDT at Gate 2026 Spring Festival Celebration. https://www.gate.com/competition/year-of-horse-2026?ref_type=165&utm_cmp=7EQB9Jba&ref=VQJEA1TCUG
View Original
- Reward
- 2
- Comment
- Repost
- Share

- Reward
- 2
- Comment
- Repost
- Share
Participate in horse racing betting, complete tasks to earn horse racing tickets, and enjoy a million red envelope rain daily, sharing a prize pool of 100,000 USDT at the Gate 2026 Spring Festival Celebration. https://www.gate.com/competition/year-of-horse-2026?ref_type=165&utm_cmp=7EQB9Jba&ref=AgJCA18
View Original
- Reward
- 2
- Comment
- Repost
- Share
Participate in horse racing betting, complete tasks to earn horse racing tickets, and enjoy a million red envelope rain daily, sharing a prize pool of 100,000 USDT at the Gate 2026 Spring Festival Celebration. https://www.gate.com/competition/year-of-horse-2026?ref_type=165&utm_cmp=7EQB9Jba&ref=VQDEBFFAAQ
View Original
- Reward
- 2
- Comment
- Repost
- Share
Crypto market remains range bound. with total market cap rebounding 0.2 in the past 24 hours
173
- Reward
- like
- Comment
- Repost
- Share
Start the Year of the Horse with a win! Gate Plaza's $50,000 Red Envelope Rain is waiting for you to post and smash https://www.gate.com/campaigns/4044?ref=UldFUFgK&ref_type=132
View Original
- Reward
- 2
- Comment
- Repost
- Share
Join the horse racing predictions, complete tasks to earn horse racing tickets, enjoy daily million Gift Coins giveaways, and share a 100,000 USDT prize pool—all at the Gate 2026 Spring Festival Celebration. https://www.gate.com/competition/year-of-horse-2026?ref_type=165&utm_cmp=7EQB9Jba&ref=VVURUQWNCQ

- Reward
- 2
- Comment
- Repost
- Share
Load More
Join 40M users in our growing community
⚡️ Join 40M users in the crypto craze discussion
💬 Engage with your favorite top creators
👍 See what interests you
Trending Topics
View More180.79K Popularity
37.68K Popularity
35.23K Popularity
77.78K Popularity
16.34K Popularity
Hot Gate Fun
View More- MC:$2.48KHolders:10.00%
- MC:$0.1Holders:10.00%
- MC:$0.1Holders:00.00%
- MC:$0.1Holders:10.00%
- MC:$2.48KHolders:10.00%
News
View MoreTesla stock price drops to a more than one-week low, down 3%
4 m
Bal: The neutral interest rate level has slightly increased but has not changed dramatically
5 m
Bahr: The expected impact of tariffs on inflation is projected to diminish by the end of the year
27 m
Baal: Evidence must show that commodity price inflation continues to decline before interest rate cuts.
27 m
Bahr: The persistent inflation rate above 2% poses significant risks
29 m
Pin