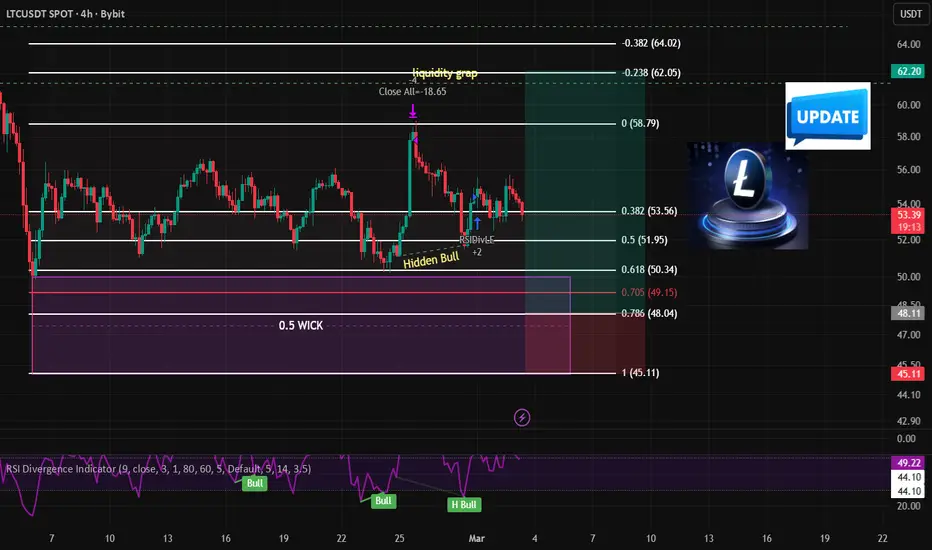


$LTC — Bullish Update: Hidden Divergence at Structural Support
Litecoin (LTC) is exhibiting strong bullish resilience as it consolidates above a critical structural zone. After a successful "liquidity sweep" near the local highs ($58.79), the price has retraced to test the 0.5 - 0.618 Fibonacci retracement levels, which align perfectly with previous price action support.
A key technical highlight is the formation of a "Hidden Bull" divergence on the RSI. While the price has maintained a higher low compared to the mid-February swing, the RSI has printed a lower low, suggesting a powerful continuation signal for the underlying trend.
LTC looks primed for a continuation. The confluence of the Fibonacci golden pocket and the Hidden Bullish divergence provides a high-probability setup. We expect a retest of the $60.00 psychological level followed by a push toward the extensions.
Disclaimer: This is for educational purposes only. Always manage your risk.