
Kaspa (KAS) has been sliding for months, but some analysts believe the worst of the correction may already be behind it. The token reached a key technical zone where several indicators are beginning to line up.
Crypto analyst Finance Freeman shared a chart suggesting the Kaspa price may be close to forming a bottom. The setup combines Fibonacci levels, long-term trend support, and price movement inside a falling channel.
This does not guarantee an immediate rally, but the chart shows a structure traders often watch closely when a market is trying to stabilize.
Here’s What The Kaspa Chart Is Showing
The Kaspa price has touched the 0.886 Fibonacci retracement level, a high retracement level that is commonly found at major bottoms.
Kaspa’s price has also touched an area around $0.24, which is near the lower boundary of the descending channel and a long-term trendline that was established before Kaspa’s All-Time High.
When multiple technical levels converge to a single location, traders take notice. These areas sometimes act as strong support where selling pressure begins to fade. The chart suggests the market may need more time to stabilize before making its next major move.
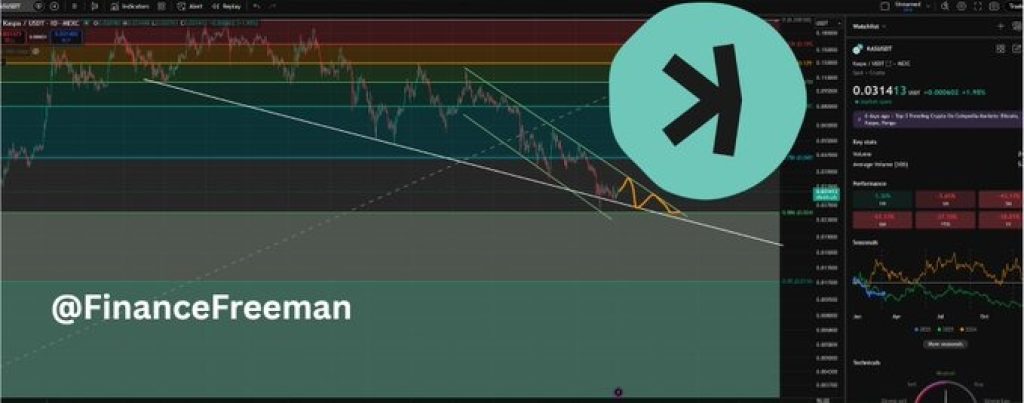
Source: X/FinanceFreeman
Finance Freeman also outlined a possible short-term path for Kaspa. On the chart, an orange path shows a scenario where the price moves sideways and forms a double bottom near the current support area.
This type of structure often appears when a market tests the same support level twice before reversing direction.
In this stage, the price movement may appear slow and choppy. The markets may be taking their time to digest the selling pressure, allowing the buyers to come back into the markets again. This, if the pattern develops correctly, may indicate that the downtrend is about to come to an end.
_****Hedera Gets Adopted At Central Bank Level As HBAR Superior Technology Stands Out**
What the KAS Chart Suggests for the Bigger Picture
After the possible double bottom forms, the analyst believes Kaspa could begin a larger move upward.
The long-term projection on the chart shows a path where the price could eventually move close to the $1 level. That would represent a huge increase from the current price range.
Of course, this type of scenario would take time and would depend on broader market conditions, continued growth in the Kaspa ecosystem, and stronger demand returning to the market.
For now, the most important level remains the $0.24 support zone. If that level holds, it strengthens the idea that the Kaspa price may already be building a base for its next cycle.
If the support fails, the market could still see further downside before a true bottom forms.
Disclaimer: The information on this page may come from third parties and does not represent the views or opinions of Gate. The content displayed on this page is for reference only and does not constitute any financial, investment, or legal advice. Gate does not guarantee the accuracy or completeness of the information and shall not be liable for any losses arising from the use of this information. Virtual asset investments carry high risks and are subject to significant price volatility. You may lose all of your invested principal. Please fully understand the relevant risks and make prudent decisions based on your own financial situation and risk tolerance. For details, please refer to
Disclaimer.
Related Articles
ETH 15-minute up 0.66%: On-chain large transfers in sync drove a net inflow of funds, boosting spot buying pressure
2026-04-15 00:00 to 00:15 (UTC), ETH shows a local anomaly. The 15-minute return rate is +0.66%. The trading price range is 2321.93–2343.2 USDT, with a range of 0.92%. During this period, market attention increased, volatility slightly intensified, buy pressure in the order book shifted upward in the short term, and quickly pushed spot prices up into a key resistance area.
The main drivers of this anomaly are large on-chain transfers and inflows of capital in combination. At the beginning of the window, multiple large ETH transfers appeared, including 8,676 ETH and 6,551 ETH, respectively, transferring from a large source to the
GateNews18m ago
BTC 15-minute drop of 0.54%: Liquidity worsens and whales actively reduce positions, putting short-term pressure on the market
From 22:15 to 22:30 (UTC) on 2026-04-14, BTC saw a short-term pullback of 0.54% within the high-range band of 73911.6 - 74314.4 USDT, with a return of -0.54%. During this period, market swings were evident, volatility intensified, attention from the market quickly increased, and downward pressure on the order book was prominent.
The main drivers behind this unusual move were the continued deterioration of market liquidity and a clear lack of order book depth, which made the BTC price extremely sensitive to large sell orders. At the same time, during the key time window, whale wallets carried out large transfers and also engaged in active de-risking,
GateNews2h ago
ETH 15-minute drop of 0.61%: Sell orders concentrate and release while bearish sentiment intensifies, increasing downward pressure
2026-04-14 22:15 to 2026-04-14 22:30 (UTC) during this period, on the 15-minute K-line, ETH recorded a -0.61% return, with a price range of 2313.68 to 2328.54 USDT and a fluctuation of 0.64%. During this period, market attention increased, trading volume expanded noticeably, and heightened short-term volatility sparked strong interest in the subsequent trend.
The main drivers behind this unusual move are the concentrated release of sell orders and continued net outflows of on-chain funds. Specifically, the sell volume share rose to 52%, higher than the buy side at 48%, indicating heavy selling pressure
GateNews2h ago
TAO Falls 6.9% in 24 Hours as Covenant Exit and Market Rotation Weigh on Price
Bittensor's TAO token fell 6.9% to $238.91 amid a week-long decline linked to Covenant AI's exit due to centralized control concerns. Competing AI tokens had smaller declines. Despite the downturn, TAO remains the top AI token by market cap, with Grayscale increasing its allocation.
GateNews2h ago
Bitmine advances to the NYSE main board! Tom Lee: The US stock market may have bottomed out, and selling pressure on Ether could ease
Bitmine has officially moved from the NYSE American board to the main board in the United States, marking a major milestone for the company. Despite a sharp drop in its stock price, it has still increased its share buyback plan by raising the authorization to $4 billion. The company holds a large amount of Ethereum, and predicts that a rebound in the crypto market will help improve its assets and stock performance.
CryptoCity2h ago
Solana Foundation Partners Triton One to Redesign Onchain Data Layer as SOL Gains 3%
The Solana Foundation is collaborating with Triton One to enhance its on-chain data access layer, improving scalability and data retrieval. The redesign features two core modules: Accounts for adaptive indexing and Ledger for efficient historical data management. SOL is currently trading around $84.
GateNews4h ago
