 Solana ETFs have accumulated $1.45 billion in net inflows since their July 2025 launch, despite SOL’s price collapsing approximately 57 percent over the same period, according to Bloomberg Intelligence data.
The divergence between sustained institutional accumulation and retail capitulation suggests a “serious investor base” is building positions, with inflows adjusted for market cap equivalent to $54 billion for Bitcoin—roughly double what Bitcoin ETFs attracted at the same stage.
ETF Inflow Analysis and Market Context
Inflow Resilience Amid Price Decline
Solana’s spot ETFs have defied brutal market mechanics since going live in July 2025, attracting $1.45 billion in net inflows while the token’s price fell from approximately $300 to current levels near $85. Bloomberg Intelligence analyst Eric Balchunas characterized the launch timing as “about as unlucky timing as you’ll ever see,” yet noted that funds have not only accumulated capital but retained it without significant outflows.
“They managed to not only accumulate $1.5 billion in flows but also not really give any of it up,” Balchunas wrote on X. “Both are really good signs for the future.”
Market Cap Adjusted Comparison
When scaled for market capitalization differences, Solana’s inflow data appears even more significant. Balchunas noted that if adjusted for the size of Solana versus Bitcoin’s market cap, the $1.45 billion haul is the equivalent of $54 billion in net new flows for Bitcoin—roughly double what Bitcoin ETFs managed at the same stage.
This metric suggests buying pressure that effectively decouples institutional demand from spot price action, with capital continuing to enter even as the asset experiences severe price compression.
Institutional Investor Profile
13F Filing Evidence
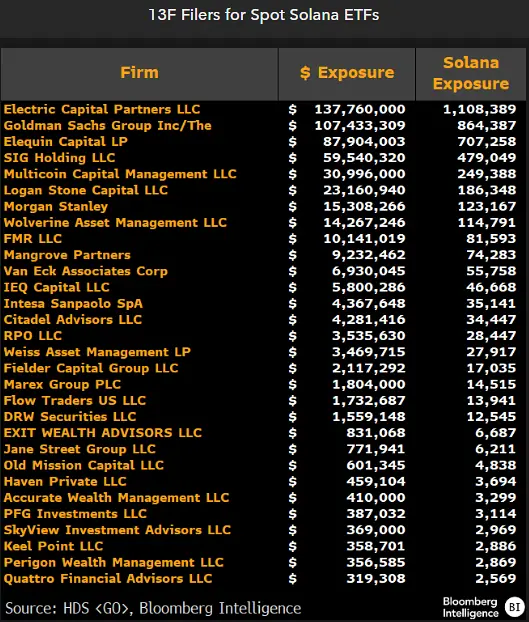
According to 13F filings, the majority of Solana ETF holders are institutions, hedge funds, pension funds, and asset managers operating with multi-year time horizons. This investor profile differs significantly from typical retail traders who might capitulate during extended drawdowns.
(Source: X)
These institutions are buying the long-term thesis rather than weekly price action, viewing the $85 range as a deep value zone. Their refusal to sell during the steep slide from $300 effectively establishes a high-conviction floor and creates a “diamond hand” dynamic where a significant portion of the floating supply moves into cold storage custody vehicles.
Smart Money Positioning
The data indicates that sophisticated capital views current Solana prices as a buying opportunity rather than a warning sign, absorbing selling pressure from FTX-era unwinds and broader market corrections. This behavior suggests that institutional investors have completed their due diligence and are comfortable building positions despite near-term price weakness.
Supply Dynamics and Potential Squeeze
Exchange Supply Implications
The combination of sustained ETF inflows and price decline creates conditions for a potential supply squeeze. When custody holdings rise while price drops, the asset becomes more illiquid on the sell side, with a growing portion of supply moving into vehicles designed for long-term holding rather than active trading.
If market sentiment eventually flips neutral or bullish, the lack of liquid supply could force violent repricing to the upside. The $100 level represents a key psychological barrier; sustained ETF inflows at current pace could trigger a squeeze against late shorts betting on continued downtrend.
Parallel to Bitcoin Dynamics
The Solana accumulation pattern mirrors broader market trends where Bitcoin is vanishing from exchanges at rates suggesting a looming supply shock. For Solana, the setup is potentially more aggressive given the market cap disparity and the proportion of inflows relative to total network value.
Stablecoin Volume Milestone
Flipping Ethereum and Tron
In a separate development, Solana’s network processed approximately $650 billion in stablecoin transfers during February 2026, surpassing both Ethereum and Tron to lead all blockchains in this metric. Tron has historically dominated stablecoin transfers, particularly USDT, with Ethereum also serving as a major settlement layer.
This milestone suggests the network is evolving beyond its reputation for meme coins and speculation. Stablecoins function as the plumbing of crypto markets, powering trading, payments, DeFi, and cross-border transfers. Dominance in this area typically indicates growing real usage behind the scenes.
Low Fees as Driver
Solana’s low transaction fees and fast settlement appear to be driving the shift in stablecoin activity, with more transfers choosing the network as a settlement layer. This technical advantage positions Solana to capture increasing volumes of stablecoin-based economic activity.
Price Levels and Technical Structure
Current Trading Range
SOL currently trades within a rising structure established after the February bounce, with price consistently printing higher lows and buyers repeatedly stepping in around $80. The $92 level remains the primary obstacle, having rejected multiple advance attempts and demonstrating seller defense of the range top.
Key Levels to Watch
The $80 support level aligns with the rising trendline supporting the recovery. If that level holds, the market could attempt another run at $92. A breakout above $92 would open the path to $106, with $120 coming into view if momentum builds.
Conversely, failure at $80 would weaken the structure quickly, potentially allowing price to slide toward $75 or $70. The sustained ETF inflows provide a counterbalancing force to technical weakness, creating unusual divergence between custody flows and spot price action.
FAQ: Solana ETFs and Market Dynamics
Q: How much have Solana ETFs accumulated since launch?
A: Solana ETFs have attracted $1.45 billion in net inflows since July 2025, despite SOL’s price declining approximately 57 percent over the same period.
Q: How does Solana ETF inflow compare to Bitcoin when adjusted for market cap?
A: Adjusted for market capitalization differences, Solana’s $1.45 billion inflow is equivalent to $54 billion for Bitcoin—roughly double what Bitcoin ETFs attracted at the same stage.
Q: Who is buying Solana ETFs?
A: According to 13F filings, the majority of Solana ETF holders are institutions, hedge funds, pension funds, and asset managers operating with multi-year investment horizons.
Q: What stablecoin milestone did Solana achieve in February 2026?
A: Solana processed approximately $650 billion in stablecoin transfers during February, surpassing both Ethereum and Tron to lead all blockchains in this metric, driven by low fees and fast transaction settlement.
Q: What are the key price levels for SOL?
A: Key support is at $80, aligning with the rising trendline. Resistance sits at $92, with upside targets of $106 and $120 above that level. A break below $80 could lead to $75 or $70.