


Currently leaning towards shorting, summarized with two plans and analysis logic.
Plan 1: High-level interception (left-side trading - highest efficiency, minimal stop loss)
• Entry point: Wait for the price to surge again to the $3,260 - $3,275 range (near previous high and upper band of the daily Bollinger Bands).
• Stop loss: $3,290.
• Reason: If it breaks through $3,290, it indicates that the upward space on the daily chart is open, and short positions must be exited immediately to stop loss.
• First target: $3,180 (middle band of the 1-hour Bollinger Bands).
• Second target: $3,120 (lower band of the 4-hour Bollinger Bands).
Plan 2: Break confirmation (right-side trading - most stable)
• Entry point: Wait for the 15-minute K-line to break below and close under $3,210 (i.e., break short-term support).
• Stop loss: $3,240 (hold if it rebounds but does not break).
• Target: $3,130 - $3,150 area.
Shorting taboos (must pay attention)
1. Strictly prohibit "holding through": The current major trend is upward; shorting is only to eat the retracement. If the price forcibly breaks through $3,300, it indicates the market is entering an accelerated upward phase, and absolutely no holding of short positions.
2. Step-by-step profit-taking: Since it is against the trend, when the price falls to a support level (such as $3,180), reduce positions or move the stop loss to the entry point to ensure principal safety.
3. Observe volume: If the price hovers around $3,260 but does not decline, and trading volume shrinks, this often signals a buildup for another rally. At this time, short positions should be withdrawn.
Order placement logic analysis:
1. Market trend in-depth analysis
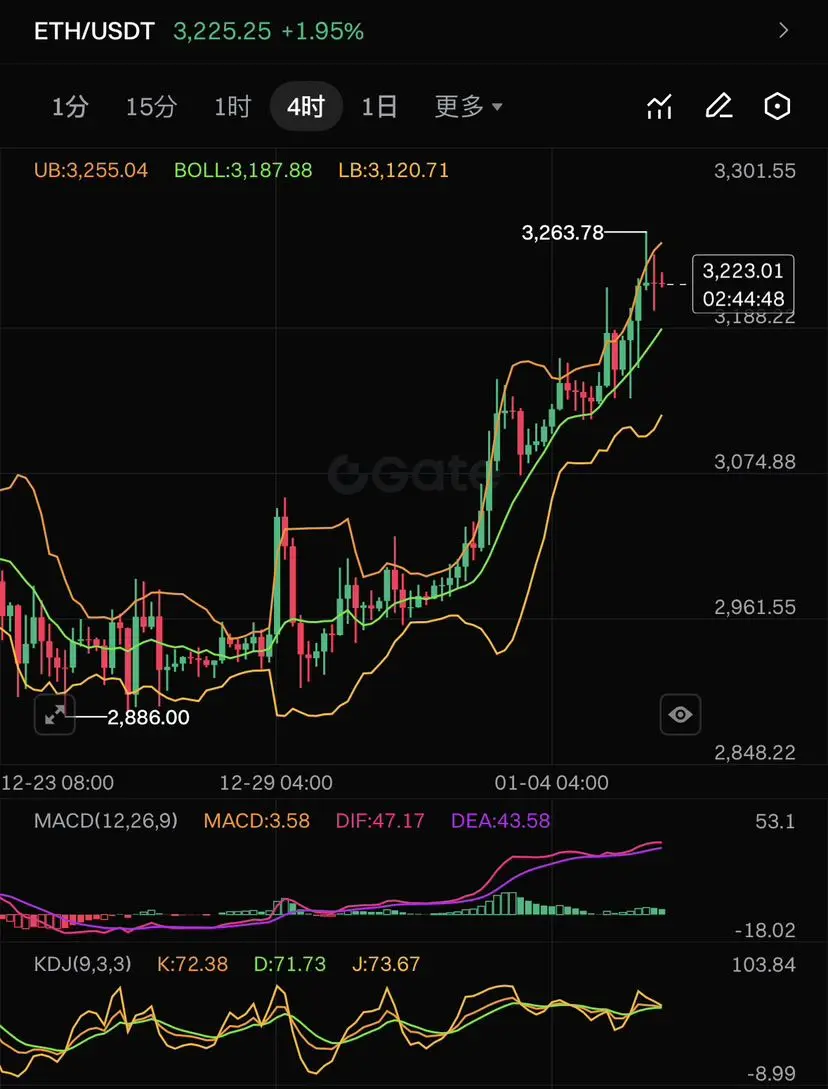
Ethereum is currently in a strong upward trend but faces short-term overbought correction pressure:
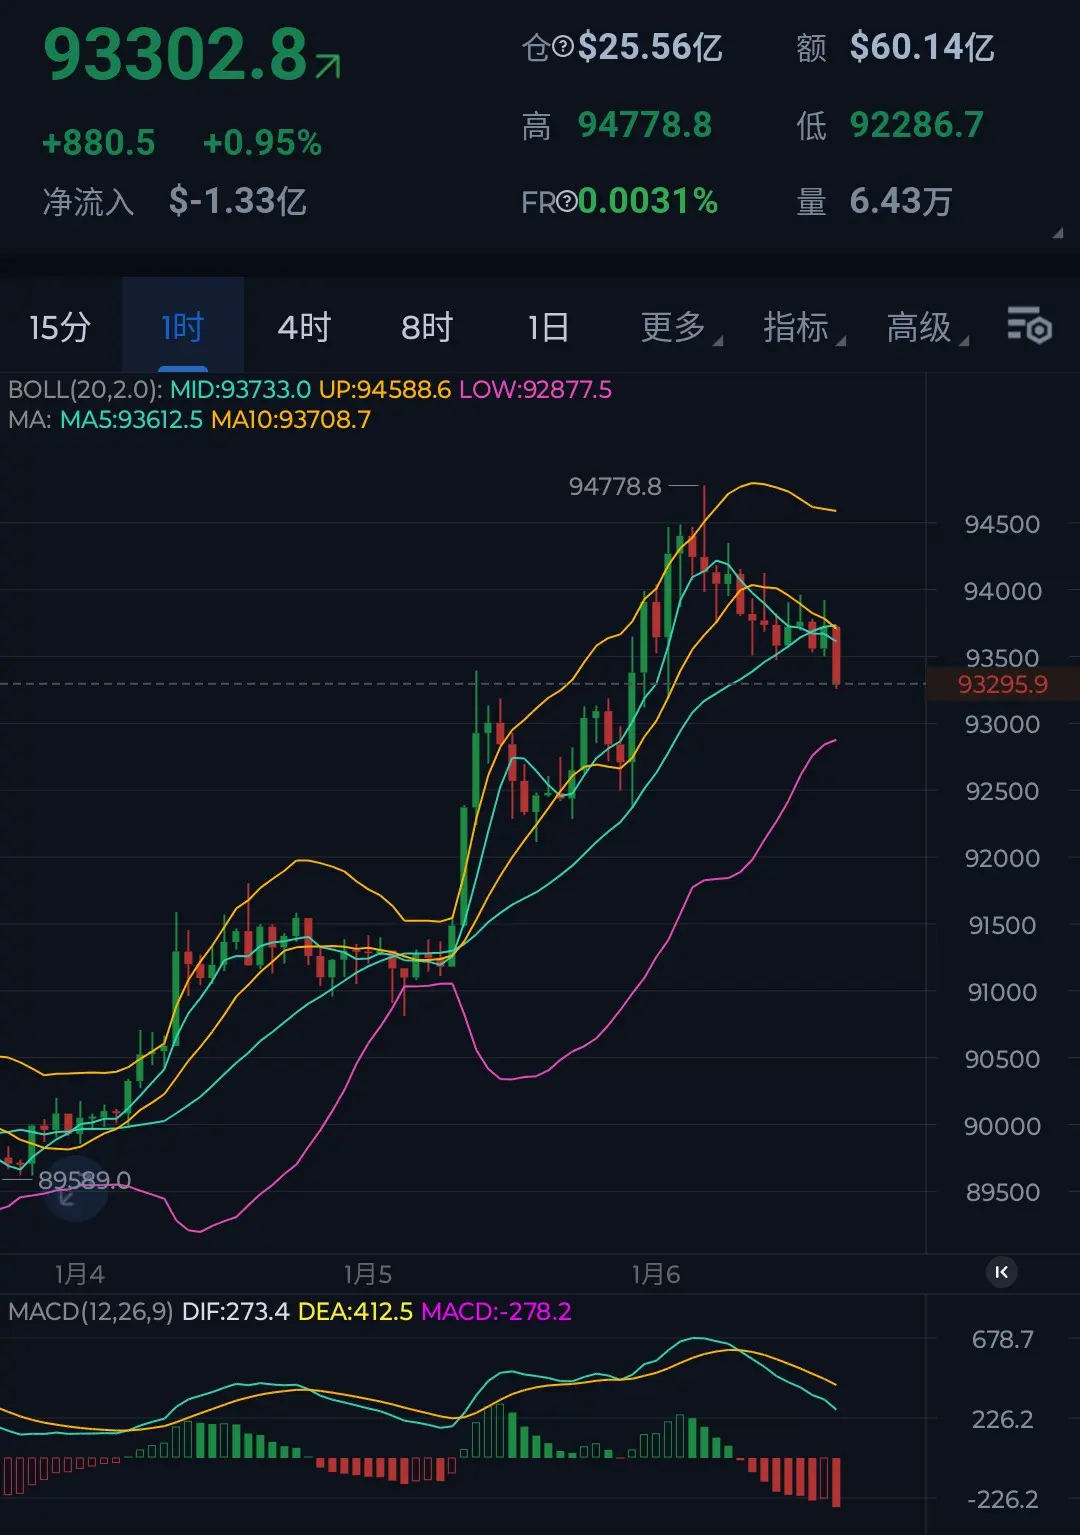
1. Daily level: The price is in a large rebound channel, currently touching the upper band of Bollinger Bands (around 3281). The J value in the KDJ indicator has already broken 100 (101.95), indicating a serious overbought state. This means that although the trend is bullish, chasing high at the current price has an unfavorable risk-reward ratio.
2. 4-hour level: Typical bullish arrangement. The price runs along the upper Bollinger Band, with MACD showing a golden cross with increasing volume. The key point is the recent high at 3,263.78; if it cannot break through with volume, it may form a short-term "double top" or high-level consolidation.
3. 1-hour/15-minute levels: Volatility begins to converge, and Bollinger Bands are flattening. This is often a sign of a trend reversal. On the 1-hour chart, MACD shows shrinking red bars, indicating weakening short-term upward momentum.
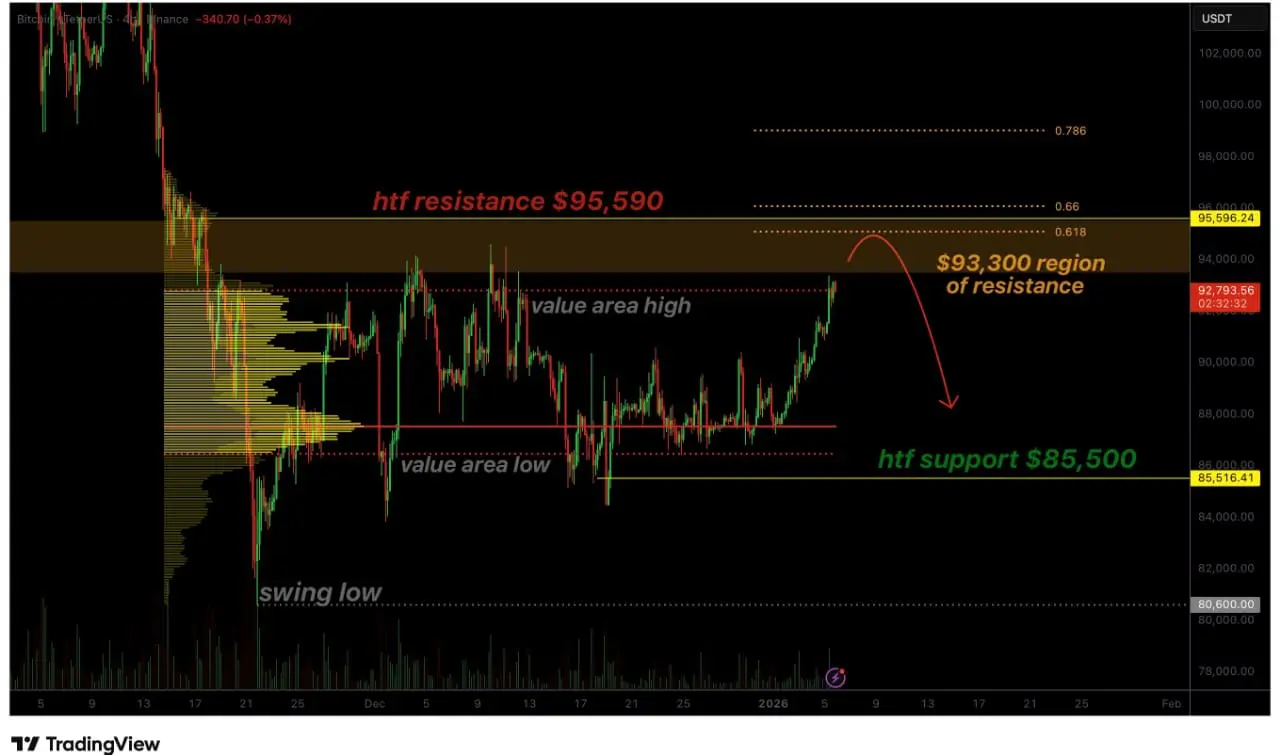
Strong resistance level: 3264-3300, previous high pressure + integer level + daily Bollinger upper band
First support level: 3180-3200, middle bands of 1-hour and 4-hour Bollinger Bands, with psychological support
Strong support level: 3120-3130, lower band of 4-hour Bollinger Bands ➕15-minute previous low
1. Do not chase highs: Currently, KDJ is at a high level; the current price of 3,223 is very close to the upper resistance. Opening a position now results in a risk-reward ratio less than 1:1, which does not meet high-efficiency principles.
2. Watch for volume increase: If the price breaks through 3,264 with volume, consider entering on a pullback rather than chasing at the moment of breakout.
Supporting shorting logic (why consider short now?)
1. Clear resistance: 3,263.78 is a short-term clear high point. If the price attempts to break this level again and fails, it will form a "double top" structure.
2. Serious overbought: The J value in the daily KDJ exceeds 100, indicating market overheating, and a technical correction may occur at any time to fix excessive divergence.
3. Momentum weakening: On the 15-minute and 1-hour charts, MACD red bars are shrinking, indicating the bullish momentum is weakening.
#策略 #加密市场开年反弹 #我的2026第一条帖 #今日你看涨还是看跌? #Gate广场 $ETH
Plan 1: High-level interception (left-side trading - highest efficiency, minimal stop loss)
• Entry point: Wait for the price to surge again to the $3,260 - $3,275 range (near previous high and upper band of the daily Bollinger Bands).
• Stop loss: $3,290.
• Reason: If it breaks through $3,290, it indicates that the upward space on the daily chart is open, and short positions must be exited immediately to stop loss.
• First target: $3,180 (middle band of the 1-hour Bollinger Bands).
• Second target: $3,120 (lower band of the 4-hour Bollinger Bands).
Plan 2: Break confirmation (right-side trading - most stable)
• Entry point: Wait for the 15-minute K-line to break below and close under $3,210 (i.e., break short-term support).
• Stop loss: $3,240 (hold if it rebounds but does not break).
• Target: $3,130 - $3,150 area.
Shorting taboos (must pay attention)
1. Strictly prohibit "holding through": The current major trend is upward; shorting is only to eat the retracement. If the price forcibly breaks through $3,300, it indicates the market is entering an accelerated upward phase, and absolutely no holding of short positions.
2. Step-by-step profit-taking: Since it is against the trend, when the price falls to a support level (such as $3,180), reduce positions or move the stop loss to the entry point to ensure principal safety.
3. Observe volume: If the price hovers around $3,260 but does not decline, and trading volume shrinks, this often signals a buildup for another rally. At this time, short positions should be withdrawn.
Order placement logic analysis:
1. Market trend in-depth analysis
Ethereum is currently in a strong upward trend but faces short-term overbought correction pressure:
1. Daily level: The price is in a large rebound channel, currently touching the upper band of Bollinger Bands (around 3281). The J value in the KDJ indicator has already broken 100 (101.95), indicating a serious overbought state. This means that although the trend is bullish, chasing high at the current price has an unfavorable risk-reward ratio.
2. 4-hour level: Typical bullish arrangement. The price runs along the upper Bollinger Band, with MACD showing a golden cross with increasing volume. The key point is the recent high at 3,263.78; if it cannot break through with volume, it may form a short-term "double top" or high-level consolidation.
3. 1-hour/15-minute levels: Volatility begins to converge, and Bollinger Bands are flattening. This is often a sign of a trend reversal. On the 1-hour chart, MACD shows shrinking red bars, indicating weakening short-term upward momentum.
Strong resistance level: 3264-3300, previous high pressure + integer level + daily Bollinger upper band
First support level: 3180-3200, middle bands of 1-hour and 4-hour Bollinger Bands, with psychological support
Strong support level: 3120-3130, lower band of 4-hour Bollinger Bands ➕15-minute previous low
1. Do not chase highs: Currently, KDJ is at a high level; the current price of 3,223 is very close to the upper resistance. Opening a position now results in a risk-reward ratio less than 1:1, which does not meet high-efficiency principles.
2. Watch for volume increase: If the price breaks through 3,264 with volume, consider entering on a pullback rather than chasing at the moment of breakout.
Supporting shorting logic (why consider short now?)
1. Clear resistance: 3,263.78 is a short-term clear high point. If the price attempts to break this level again and fails, it will form a "double top" structure.
2. Serious overbought: The J value in the daily KDJ exceeds 100, indicating market overheating, and a technical correction may occur at any time to fix excessive divergence.
3. Momentum weakening: On the 15-minute and 1-hour charts, MACD red bars are shrinking, indicating the bullish momentum is weakening.
#策略 #加密市场开年反弹 #我的2026第一条帖 #今日你看涨还是看跌? #Gate广场 $ETH