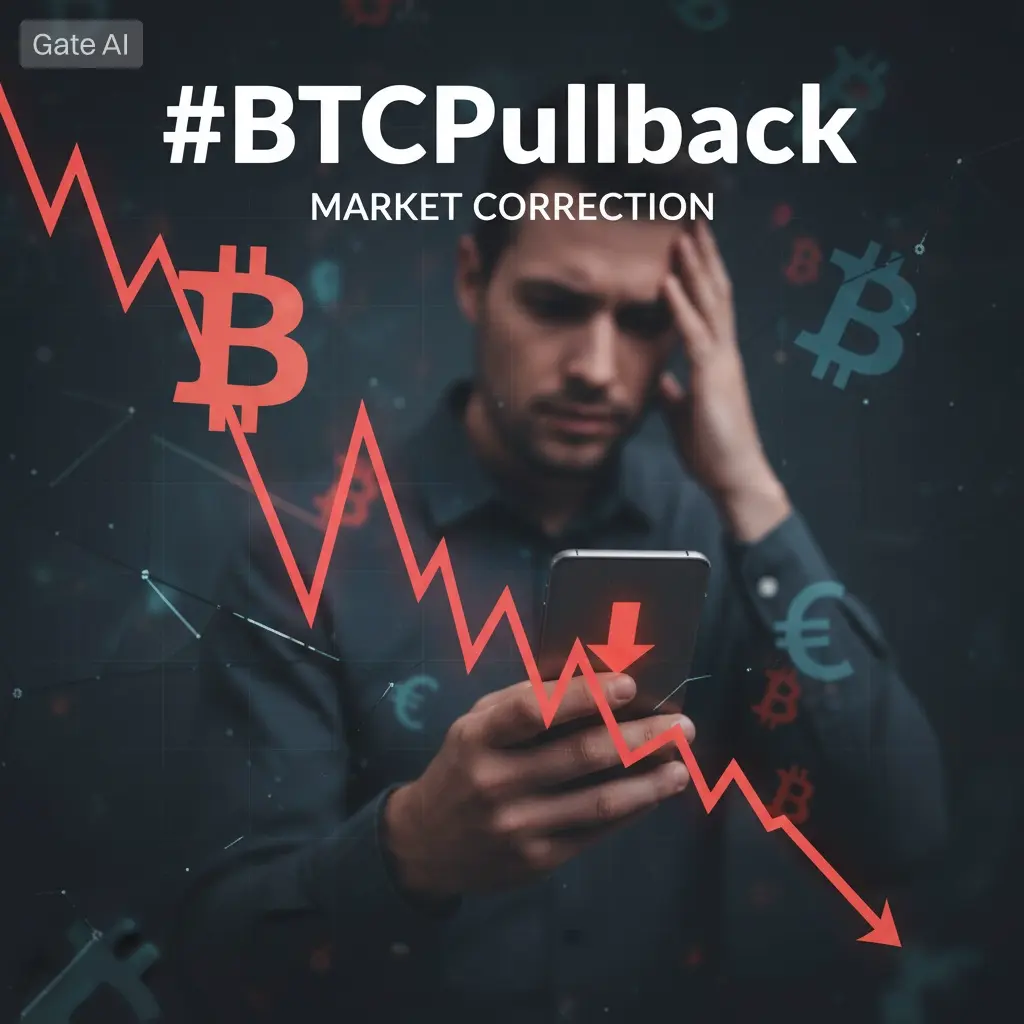
#BTCPullback
The recent pullback in Bitcoin has become one of the most closely watched developments across the cryptocurrency market. After a strong upward movement fueled by institutional participation, ETF inflows, improving macro sentiment, and increasing trader confidence, Bitcoin has entered a temporary corrective phase that is creating mixed emotions among investors. Some traders see the current situation as a healthy market reset, while others remain cautious about possible deeper volatility ahead. Understanding the structure behind a Bitcoin pullback is extremely important because corrections are a natural part of every major financial market cycle.
A pullback does not automatically mean the bullish trend is over. In most cases, strong markets move in waves. Prices rise aggressively, early investors secure profits, leverage becomes overheated, and then the market temporarily cools down before deciding its next direction. This process helps remove weak positions from the market and creates healthier price stability. The current Bitcoin pullback appears to be following this classic cycle structure where traders are closely monitoring whether support zones can hold during increased volatility.
One of the biggest reasons behind the recent BTC pullback is profit-taking pressure. After Bitcoin experienced rapid upward momentum, many short-term traders and leveraged positions began securing gains near local resistance areas. When large numbers of traders close profitable positions at the same time, temporary selling pressure increases across exchanges. This often creates cascading liquidations in highly leveraged futures markets, which can accelerate downside movement for a short period. However, experienced market participants understand that these phases are common during strong bullish environments.
Macroeconomic conditions are also playing a major role in current Bitcoin price behavior. Global financial markets continue reacting to inflation expectations, central bank interest rate discussions, bond yield movements, and overall liquidity conditions. Whenever uncertainty increases in traditional markets, risk assets like cryptocurrencies often experience temporary weakness. Rising treasury yields, stronger U.S. dollar movements, or cautious Federal Reserve commentary can influence crypto sentiment because institutional investors monitor these factors very carefully before allocating additional capital into volatile assets.
Another important factor during this BTC pullback is futures market positioning. Funding rates, open interest, and liquidation clusters heavily influence short-term Bitcoin volatility. When too many traders become aggressively bullish using high leverage, the market often experiences sudden corrections that force overleveraged positions to close. This creates rapid downward candles even if long-term market structure remains positive. Current market conditions suggest that traders are now watching whether leverage levels stabilize before Bitcoin attempts another major directional move.
Technically, Bitcoin traders are focusing heavily on support and resistance structures. Support zones are areas where buyers historically return into the market and slow down selling pressure. Resistance zones represent areas where sellers become more active and price struggles to move higher. During a pullback, the most important question is whether Bitcoin can maintain higher lows while defending key support regions. If support levels continue holding despite volatility, many analysts interpret this as a sign of underlying market strength rather than full trend reversal.
Market sentiment during pullbacks usually becomes highly emotional. Social media discussions often shift rapidly between fear and optimism depending on short-term price action. Retail traders sometimes panic during corrections because they focus too heavily on short-term candles instead of broader market structure. Professional traders, however, often approach pullbacks with patience. They monitor volume behavior, liquidity zones, whale accumulation patterns, and institutional activity before making major decisions. Emotional reactions frequently create opportunities for disciplined traders who follow structured risk management strategies.
Institutional behavior remains one of the most important themes in the current Bitcoin cycle. Large investment firms, ETFs, and long-term holders continue influencing market direction more than previous retail-driven cycles. Even during pullbacks, institutional accumulation can quietly continue in the background. This creates situations where market corrections appear aggressive in the short term while long-term accumulation trends remain intact underneath surface volatility. Many investors therefore watch blockchain data, exchange outflows, and ETF activity closely during corrections.
Another critical aspect of the BTC pullback is market psychology surrounding fear and greed. In bullish environments, excessive optimism can push prices higher very quickly, but unsustainable momentum eventually requires cooling periods. Pullbacks help reset trader expectations and reduce speculative overheating. Historically, Bitcoin has experienced multiple corrections even during its strongest bull markets. Long-term investors understand that volatility is part of Bitcoin’s market identity, and temporary fear often appears before the next major directional expansion phase.
Altcoins are also heavily affected whenever Bitcoin enters a pullback phase. Since BTC dominates overall crypto market sentiment, many alternative cryptocurrencies experience even larger percentage declines during corrections. Traders often reduce exposure to smaller assets first because they carry higher risk during uncertain periods. However, if Bitcoin stabilizes successfully after the pullback, capital frequently rotates back into altcoins later in the cycle. This relationship between Bitcoin dominance and altcoin movement remains a major focus for active market participants.
Volume analysis is another essential factor when studying Bitcoin pullbacks. Healthy corrections often show declining sell volume over time, suggesting that aggressive panic selling is fading gradually. On the other hand, extremely high bearish volume combined with breaking long-term support can signal stronger downside continuation risk. Traders therefore monitor whether buyers begin defending important zones with stronger participation. Recovery candles supported by rising spot volume are generally considered more constructive signals for market stabilization.
Risk management becomes especially important during volatile periods like the current BTC pullback. Successful traders avoid emotional overtrading and focus instead on position sizing, stop-loss discipline, and structured entry planning. High leverage during uncertain conditions can increase liquidation risk significantly. Many experienced traders prefer waiting for confirmation signals before entering aggressive positions during correction phases. Patience often becomes more valuable than chasing short-term volatility in rapidly changing market conditions.
The broader long-term Bitcoin narrative still remains connected to adoption growth, institutional acceptance, blockchain innovation, and global digital asset expansion. Despite short-term corrections, Bitcoin continues attracting attention as both a speculative asset and a long-term store-of-value discussion point. Regulatory developments, ETF growth, sovereign interest, and technological improvements continue shaping the broader investment landscape surrounding cryptocurrency markets.
Looking ahead, traders are closely monitoring whether Bitcoin can establish stability above major support levels and rebuild bullish momentum. If buyers regain confidence and macroeconomic conditions improve, the current pullback could eventually be viewed as a healthy consolidation phase before another upward expansion. However, if volatility intensifies and key support zones fail, the market may enter a longer consolidation period before the next major trend emerges.
For now, the BTC pullback represents a critical moment where patience, disciplined analysis, and risk control are far more important than emotional decision-making. Cryptocurrency markets remain highly dynamic, and understanding market structure during corrections can help traders navigate volatility more effectively while preparing for future opportunities in the evolving digital asset landscape.