#STRCHitsAllTimeLow
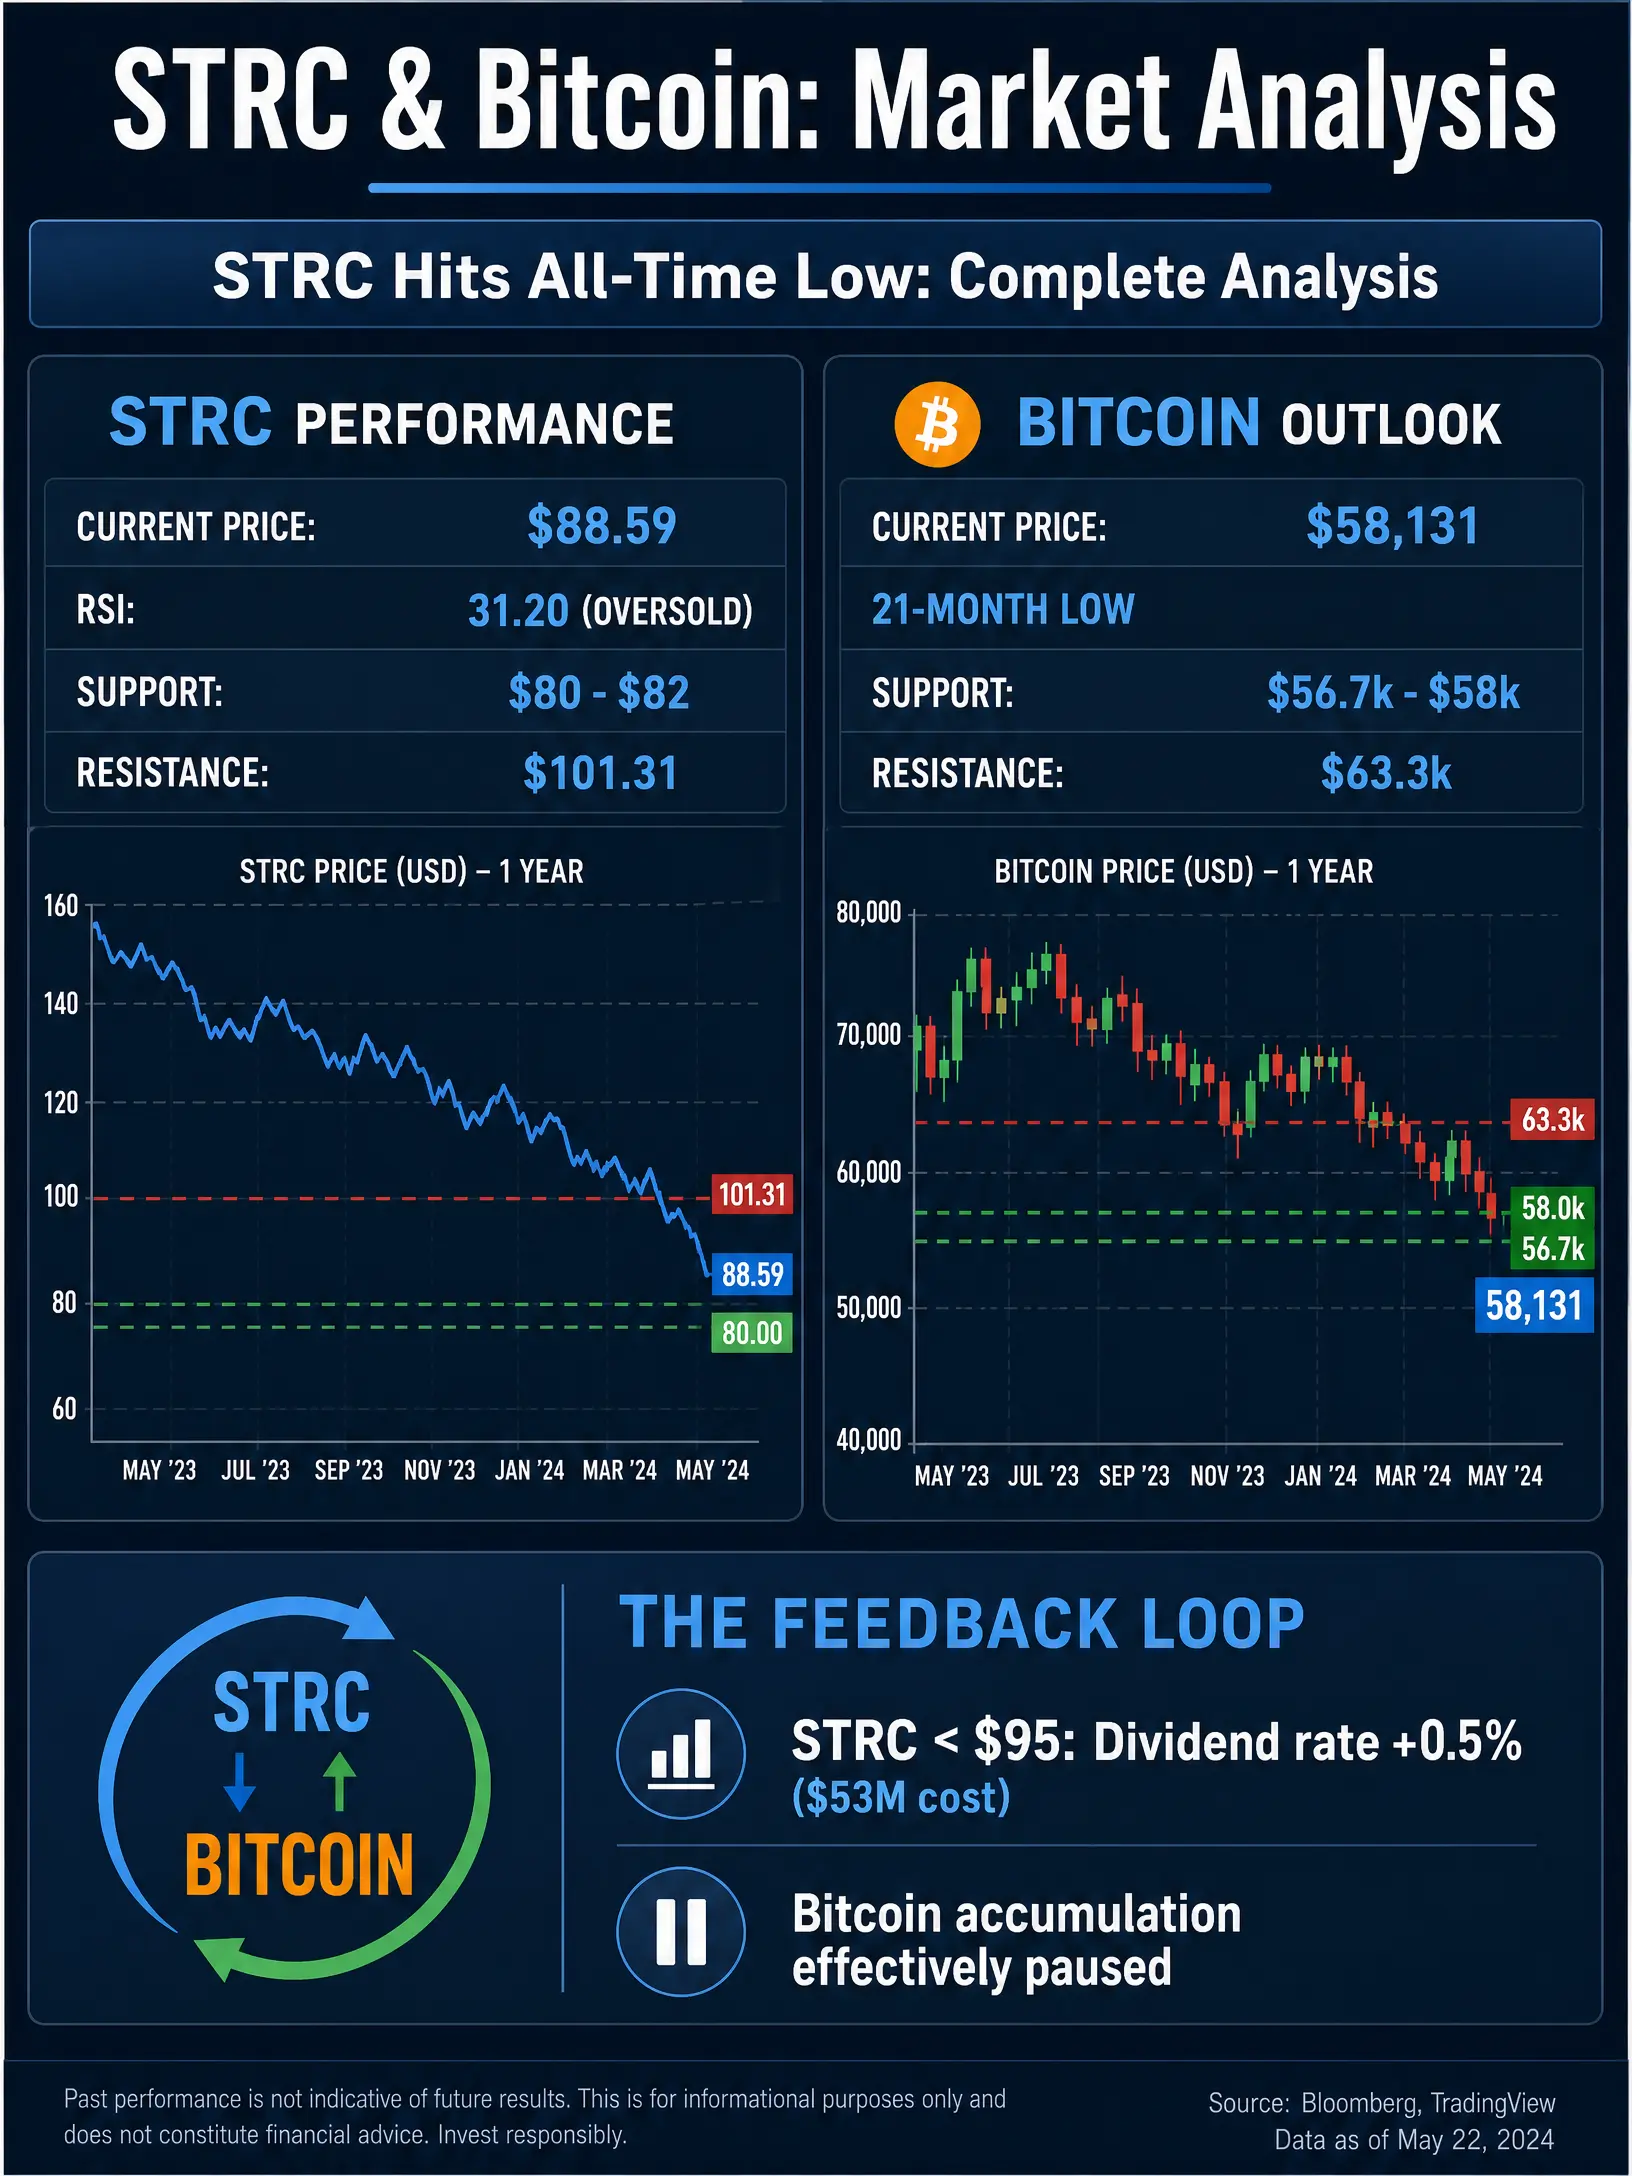
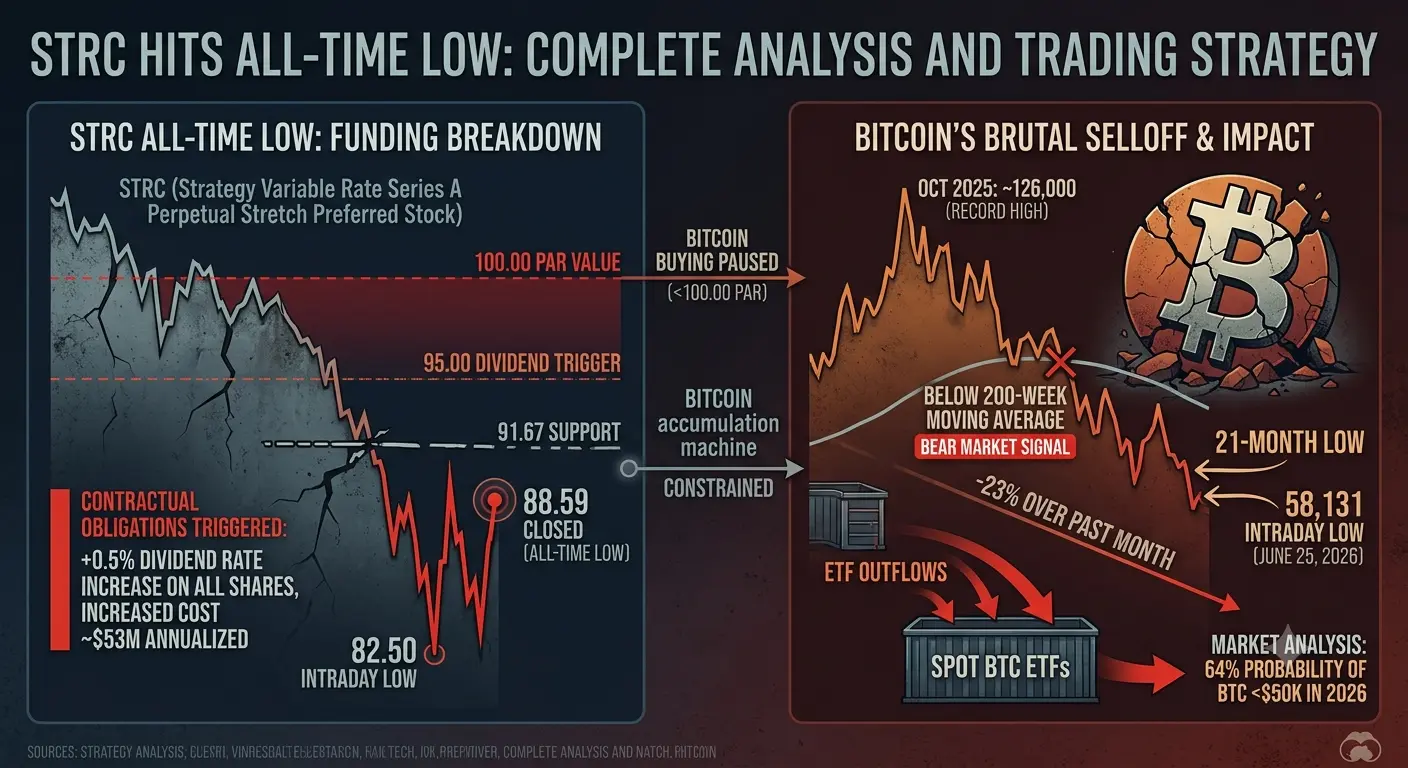
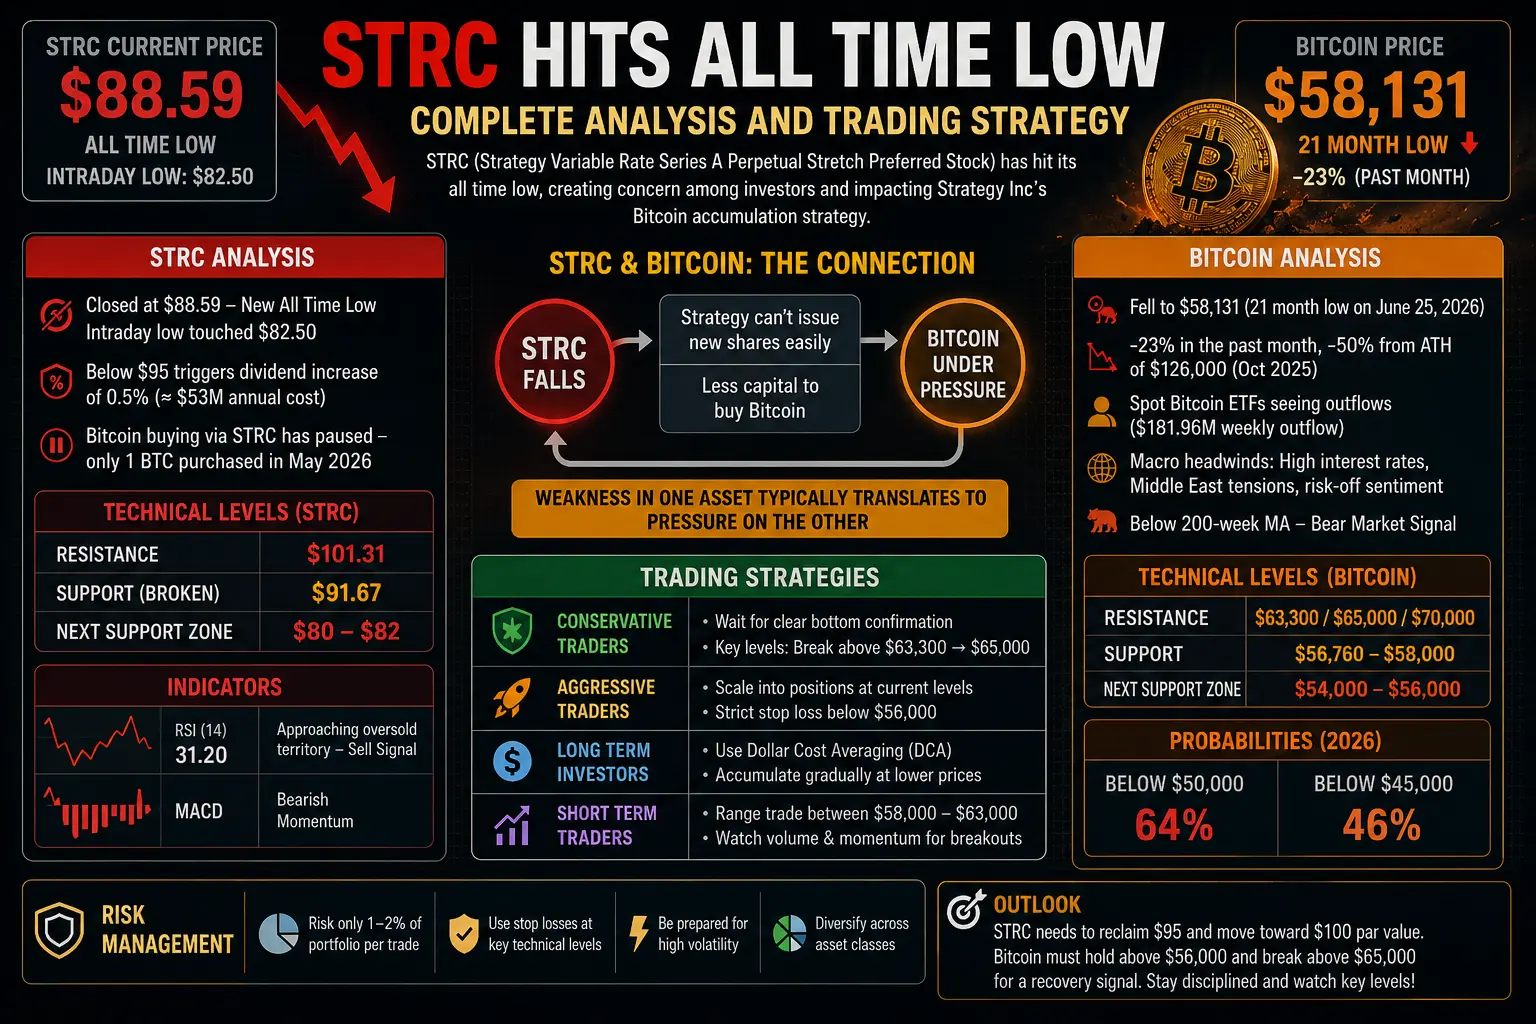
STRC which stands for Strategy Variable Rate Series A Perpetual Stretch Preferred Stock has officially hit its all time low position in the market creating significant concern among investors and traders. This financial instrument was launched by Strategy Inc formerly known as MicroStrategy in July 2025 and has become a critical component of the company's Bitcoin accumulation strategy. The stock recently closed at 88.59 dollars marking a new all time low with an intraday low touching 82.50 dollars during the trading session. This represents a substantial de-anchoring from its 100 dollar par value which has triggered several contractual obligations and raised questions about the sustainability of Strategy's Bitcoin buying mechanism.
The relationship between STRC and Bitcoin is deeply interconnected and understanding this correlation is essential for any trader or investor. STRC was designed specifically as a funding vehicle to finance Strategy's aggressive Bitcoin accumulation strategy. When STRC trades above its par value Strategy can issue new shares at favorable terms to raise capital for purchasing more Bitcoin. However when STRC falls below 95 dollars the company becomes contractually obligated to increase the dividend rate by 0.5 percent on all outstanding shares which raises annual dividend costs by approximately 53 million dollars. This creates a challenging scenario where Bitcoin buying has effectively paused since STRC fell below 100 dollars par value with only 1 Bitcoin purchased through this mechanism in May 2026.
From a technical analysis perspective STRC is currently trading in a precarious position with well defined support at 91.67 dollars and resistance at 101.31 dollars. However given that the stock has broken below this support level the next critical support zone appears to be around 80 to 82 dollars based on recent price action. The Relative Strength Index for STRC over the 14 day period is currently at 31.20 which technically suggests the stock is approaching oversold territory but still indicates a sell signal. Traders should watch for any potential bounce from current levels but be prepared for further downside if the 80 dollar level fails to hold. The Moving Average Convergence Divergence indicator is showing bearish momentum which aligns with the overall negative sentiment surrounding the stock.
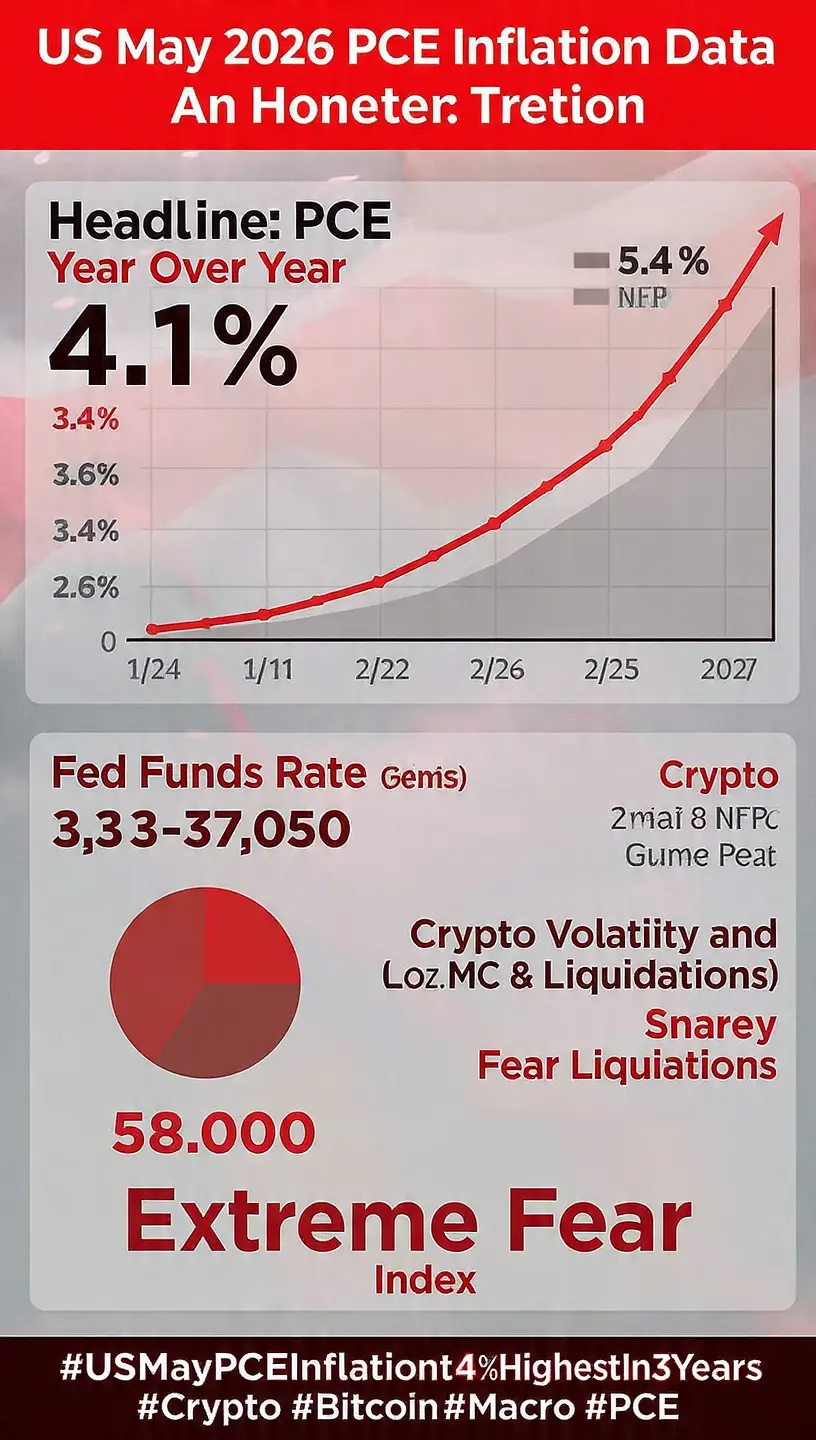
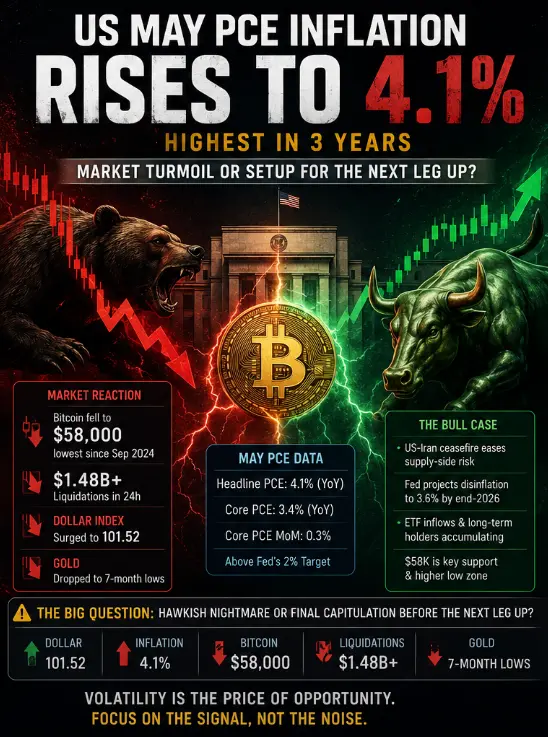
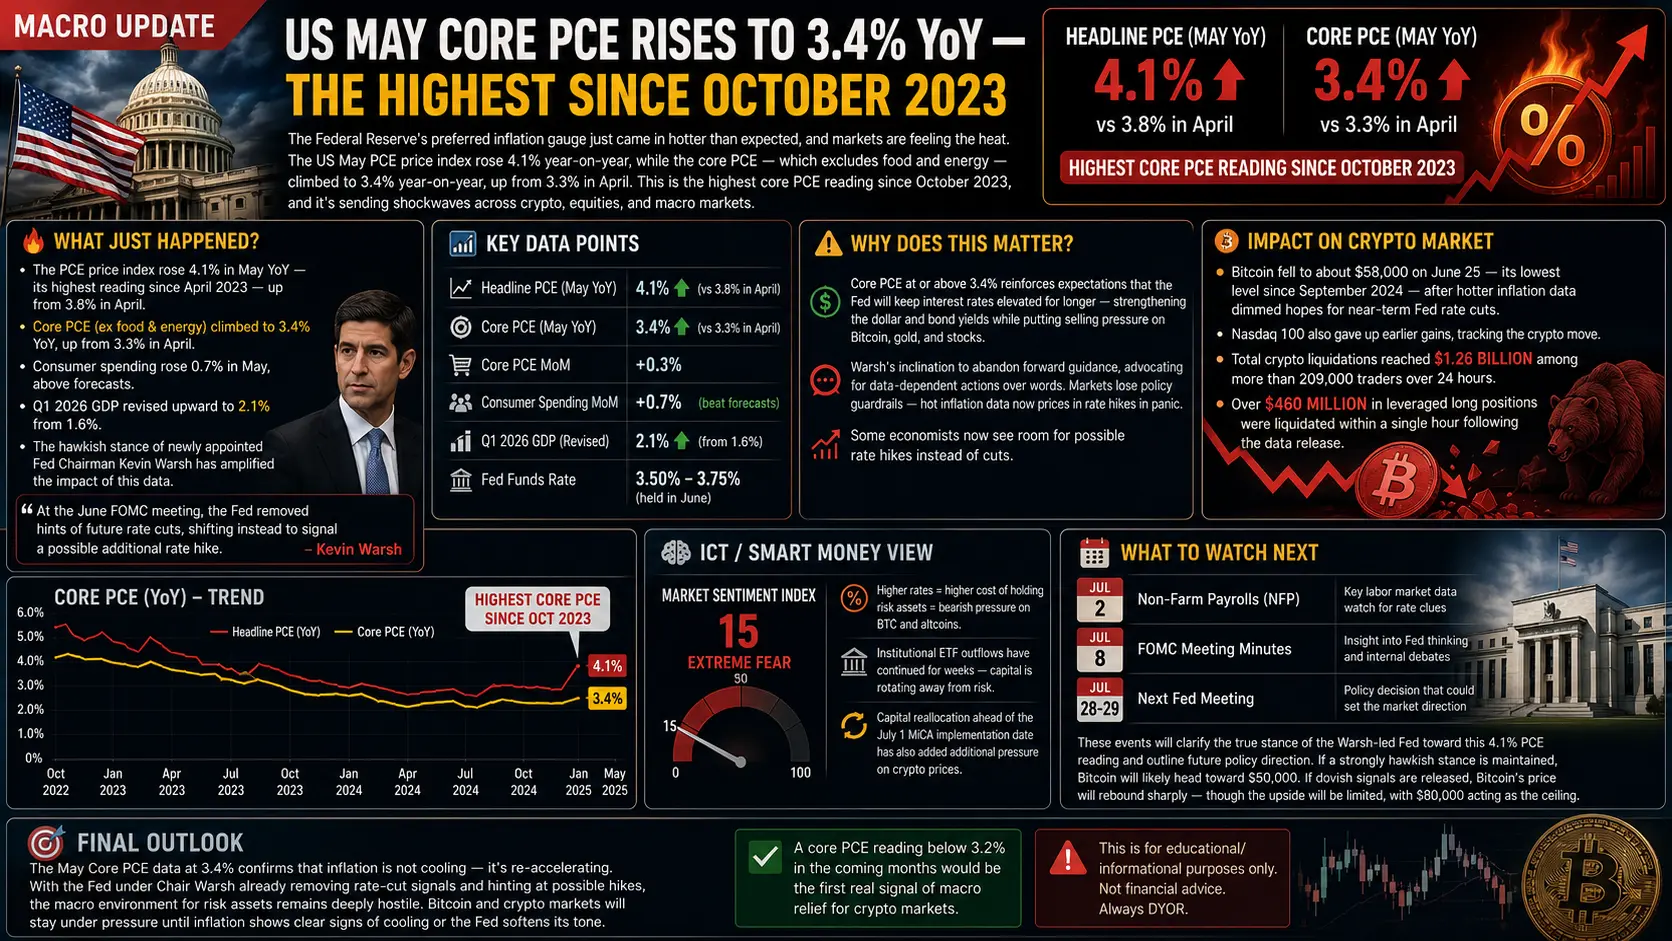
Bitcoin's current price action has been equally challenging with the cryptocurrency experiencing a brutal selloff that has sent shockwaves through the entire digital asset market. Bitcoin recently fell to an intraday low of 58,131 dollars on June 25 2026 marking its lowest level since September 2024 and representing a 21 month low. This extends a 6.6 percent decline over the last week with the cryptocurrency now down approximately 23 percent over the past month. The price has dropped more than 50 percent from its record high of just over 126,000 dollars reached in October 2025 creating significant pain for holders and forcing many investors to reassess their positions.
Several key factors have contributed to Bitcoin's dramatic decline and understanding these drivers is crucial for developing an effective trading strategy. First and foremost continued money outflows from spot Bitcoin ETFs have created persistent selling pressure with United States spot Bitcoin ETFs recording net outflows of 113.78 million dollars as of June 23 while weekly outflows stood at 181.96 million dollars. This institutional exodus represents a major shift in sentiment among large investors who had previously been accumulating Bitcoin through these regulated vehicles. Additionally expectations that interest rates could remain higher for longer have made investors more cautious about riskier assets including Bitcoin as the Federal Reserve maintains a hawkish stance on monetary policy.
Macroeconomic headwinds have also played a significant role in Bitcoin's decline with geopolitical tensions and uncertainty surrounding the Middle East conflict creating risk off sentiment across global markets. The cryptocurrency has fallen below its 200 week moving average which technically signals a bear market for Bitcoin and indicates that more investors are holding bearish positions. Furthermore approximately 10 billion dollars in options bets on Bitcoin are set to expire which could fuel additional volatility and potentially trigger a cascade of selling if key support levels are breached.
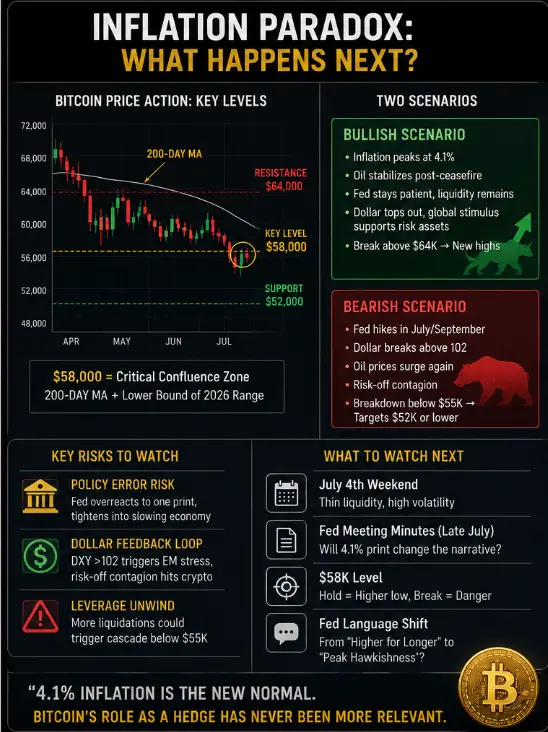
From a technical analysis standpoint Bitcoin is currently facing critical support and resistance levels that will determine its next major move. The immediate support zone lies between 56,760 dollars and 58,000 dollars with a breakdown below this level potentially opening the door to a move toward 54,000 to 56,000 dollars. Analysts have warned that a sustained break below 60,000 dollars could trigger a cascade effect leading to significantly lower prices. On the upside resistance is expected around 63,300 dollars followed by 65,000 dollars and ultimately the psychologically important 70,000 dollar level. The probability of Bitcoin falling below 50,000 dollars in 2026 has jumped to 64 percent according to market analysis while the odds of a move below 45,000 dollars stand at 46 percent.
For traders looking to navigate the current environment several strategies should be considered based on risk tolerance and market outlook. Conservative traders may want to wait for clear confirmation of a bottom formation before entering new long positions with key levels to watch being a sustained break above 63,300 dollars followed by 65,000 dollars. More aggressive traders might consider scaling into positions at current levels while using strict stop losses below 56,000 dollars to manage downside risk. Dollar cost averaging remains a viable strategy for long term believers in Bitcoin allowing investors to accumulate at lower prices while reducing the impact of volatility. Short term traders should focus on range bound strategies between 58,000 and 63,000 dollars while monitoring volume and momentum indicators for breakout signals.
The relationship between STRC and Bitcoin remains symbiotic with weakness in one asset typically translating to pressure on the other. As STRC continues to trade below par value Strategy's ability to fund additional Bitcoin purchases is constrained which removes a significant source of buying pressure from the market. This dynamic creates a feedback loop where declining Bitcoin prices hurt STRC which in turn limits Bitcoin accumulation potential. Traders should monitor both assets simultaneously as any recovery in STRC above 95 dollars could signal renewed institutional appetite for Bitcoin while continued weakness may foreshadow further downside.
Risk management is paramount in the current environment given the elevated volatility and uncertainty surrounding both STRC and Bitcoin. Position sizing should be conservative with traders risking no more than 1 to 2 percent of their portfolio on any single trade. Stop losses should be placed at logical technical levels and traders should be prepared for the possibility of rapid price movements in either direction. Diversification across different asset classes can help mitigate the risks associated with concentrated exposure to cryptocurrency markets.
Looking ahead the outlook for both STRC and Bitcoin remains uncertain with much depending on broader macroeconomic conditions and institutional sentiment. For STRC to recover it will need to reclaim the 95 dollar level and ideally move back toward its 100 dollar par value which would restore confidence in Strategy's funding mechanism. Bitcoin will need to hold above 56,000 dollars and eventually break back above 65,000 dollars to signal that the worst of the selling is over. Traders should remain vigilant monitoring key technical levels and news flow while maintaining disciplined risk management practices in this challenging market environment.#USMayPCEInflationRisesTo4.1%HighestIn3Years #BTCProbes60KKeySupportLevel
STRC which stands for Strategy Variable Rate Series A Perpetual Stretch Preferred Stock has officially hit its all time low position in the market creating significant concern among investors and traders. This financial instrument was launched by Strategy Inc formerly known as MicroStrategy in July 2025 and has become a critical component of the company's Bitcoin accumulation strategy. The stock recently closed at 88.59 dollars marking a new all time low with an intraday low touching 82.50 dollars during the trading session. This represents a substantial de-anchoring from its 100 dollar par value which has triggered several contractual obligations and raised questions about the sustainability of Strategy's Bitcoin buying mechanism.
The relationship between STRC and Bitcoin is deeply interconnected and understanding this correlation is essential for any trader or investor. STRC was designed specifically as a funding vehicle to finance Strategy's aggressive Bitcoin accumulation strategy. When STRC trades above its par value Strategy can issue new shares at favorable terms to raise capital for purchasing more Bitcoin. However when STRC falls below 95 dollars the company becomes contractually obligated to increase the dividend rate by 0.5 percent on all outstanding shares which raises annual dividend costs by approximately 53 million dollars. This creates a challenging scenario where Bitcoin buying has effectively paused since STRC fell below 100 dollars par value with only 1 Bitcoin purchased through this mechanism in May 2026.
From a technical analysis perspective STRC is currently trading in a precarious position with well defined support at 91.67 dollars and resistance at 101.31 dollars. However given that the stock has broken below this support level the next critical support zone appears to be around 80 to 82 dollars based on recent price action. The Relative Strength Index for STRC over the 14 day period is currently at 31.20 which technically suggests the stock is approaching oversold territory but still indicates a sell signal. Traders should watch for any potential bounce from current levels but be prepared for further downside if the 80 dollar level fails to hold. The Moving Average Convergence Divergence indicator is showing bearish momentum which aligns with the overall negative sentiment surrounding the stock.
Bitcoin's current price action has been equally challenging with the cryptocurrency experiencing a brutal selloff that has sent shockwaves through the entire digital asset market. Bitcoin recently fell to an intraday low of 58,131 dollars on June 25 2026 marking its lowest level since September 2024 and representing a 21 month low. This extends a 6.6 percent decline over the last week with the cryptocurrency now down approximately 23 percent over the past month. The price has dropped more than 50 percent from its record high of just over 126,000 dollars reached in October 2025 creating significant pain for holders and forcing many investors to reassess their positions.
Several key factors have contributed to Bitcoin's dramatic decline and understanding these drivers is crucial for developing an effective trading strategy. First and foremost continued money outflows from spot Bitcoin ETFs have created persistent selling pressure with United States spot Bitcoin ETFs recording net outflows of 113.78 million dollars as of June 23 while weekly outflows stood at 181.96 million dollars. This institutional exodus represents a major shift in sentiment among large investors who had previously been accumulating Bitcoin through these regulated vehicles. Additionally expectations that interest rates could remain higher for longer have made investors more cautious about riskier assets including Bitcoin as the Federal Reserve maintains a hawkish stance on monetary policy.
Macroeconomic headwinds have also played a significant role in Bitcoin's decline with geopolitical tensions and uncertainty surrounding the Middle East conflict creating risk off sentiment across global markets. The cryptocurrency has fallen below its 200 week moving average which technically signals a bear market for Bitcoin and indicates that more investors are holding bearish positions. Furthermore approximately 10 billion dollars in options bets on Bitcoin are set to expire which could fuel additional volatility and potentially trigger a cascade of selling if key support levels are breached.
From a technical analysis standpoint Bitcoin is currently facing critical support and resistance levels that will determine its next major move. The immediate support zone lies between 56,760 dollars and 58,000 dollars with a breakdown below this level potentially opening the door to a move toward 54,000 to 56,000 dollars. Analysts have warned that a sustained break below 60,000 dollars could trigger a cascade effect leading to significantly lower prices. On the upside resistance is expected around 63,300 dollars followed by 65,000 dollars and ultimately the psychologically important 70,000 dollar level. The probability of Bitcoin falling below 50,000 dollars in 2026 has jumped to 64 percent according to market analysis while the odds of a move below 45,000 dollars stand at 46 percent.
For traders looking to navigate the current environment several strategies should be considered based on risk tolerance and market outlook. Conservative traders may want to wait for clear confirmation of a bottom formation before entering new long positions with key levels to watch being a sustained break above 63,300 dollars followed by 65,000 dollars. More aggressive traders might consider scaling into positions at current levels while using strict stop losses below 56,000 dollars to manage downside risk. Dollar cost averaging remains a viable strategy for long term believers in Bitcoin allowing investors to accumulate at lower prices while reducing the impact of volatility. Short term traders should focus on range bound strategies between 58,000 and 63,000 dollars while monitoring volume and momentum indicators for breakout signals.
The relationship between STRC and Bitcoin remains symbiotic with weakness in one asset typically translating to pressure on the other. As STRC continues to trade below par value Strategy's ability to fund additional Bitcoin purchases is constrained which removes a significant source of buying pressure from the market. This dynamic creates a feedback loop where declining Bitcoin prices hurt STRC which in turn limits Bitcoin accumulation potential. Traders should monitor both assets simultaneously as any recovery in STRC above 95 dollars could signal renewed institutional appetite for Bitcoin while continued weakness may foreshadow further downside.
Risk management is paramount in the current environment given the elevated volatility and uncertainty surrounding both STRC and Bitcoin. Position sizing should be conservative with traders risking no more than 1 to 2 percent of their portfolio on any single trade. Stop losses should be placed at logical technical levels and traders should be prepared for the possibility of rapid price movements in either direction. Diversification across different asset classes can help mitigate the risks associated with concentrated exposure to cryptocurrency markets.
Looking ahead the outlook for both STRC and Bitcoin remains uncertain with much depending on broader macroeconomic conditions and institutional sentiment. For STRC to recover it will need to reclaim the 95 dollar level and ideally move back toward its 100 dollar par value which would restore confidence in Strategy's funding mechanism. Bitcoin will need to hold above 56,000 dollars and eventually break back above 65,000 dollars to signal that the worst of the selling is over. Traders should remain vigilant monitoring key technical levels and news flow while maintaining disciplined risk management practices in this challenging market environment.#USMayPCEInflationRisesTo4.1%HighestIn3Years #BTCProbes60KKeySupportLevel