TraderHongYi

vip
Age 1 Year
Peak Tier 10
Live trading sharing, trading ideas, no pump signals! Join my chat room for learning and discussion, with daily synchronized updates.
Pin
Welcome to my Plaza Hot Chat, daily synchronized operation ideas!
View Original
post-image
  • Reward
  • Comment
  • Repost
  • Share
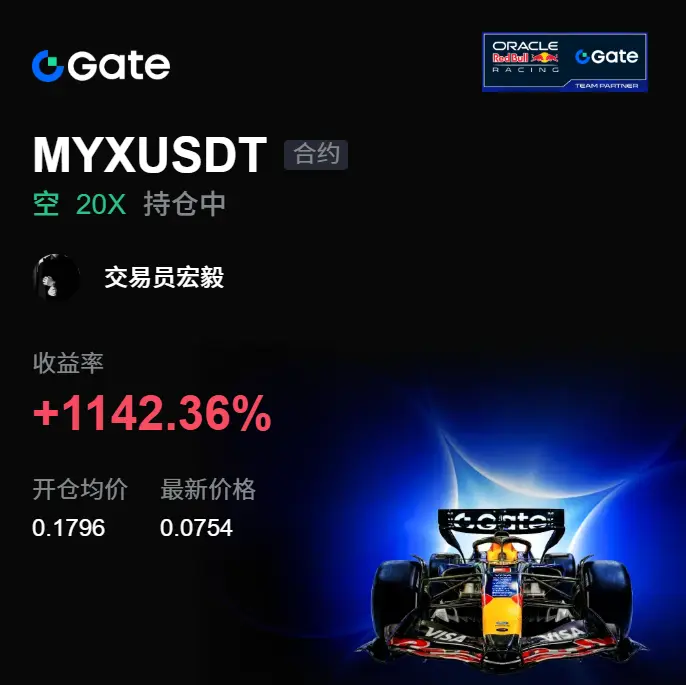
Boom! With this drop, did the short brothers wake up directly 📉🔥
A few days ago, at around midnight, I watched $MYX . The chart was still high and pretending to be strong, but the pump had no volume—there was nobody to take it. Every time it pushed up to the top, it got slammed back down. I could tell then it wasn’t strength; it was too heavily bait-for-long, too long-bait.

Before the chart was fully started, MYX kept grinding around 0.1796. What I was watching was whether there was enough buy-side support. The result was very clear: the rebound had no follow-through—buyers didn’t keep up.
MYX-0.53%
BTC1.64%
ETH3.04%
View Original
post-image
  • Reward
  • Comment
  • Repost
  • Share
Nice! This drop was cashed out so decisively—everything that had been building up a few days ago got fully released today 📉🔥 A few days ago, before bed, $ETH was still just hovering near the highs. A lot of people saw it not falling and wanted to rush in. But what I was watching was that the rebound had no strength—the overhead pressure was obvious—and once it went up, nobody was there to take the other side.
Before the market fully kicked off, I watched ETH make several upward pushes, only to be pushed back each time. The volume couldn’t keep up 👀 The biggest fear on a chart like this is
ETH3.04%
BTC1.64%
SOL0.08%
View Original
post-image
  • Reward
  • Comment
  • Repost
  • Share
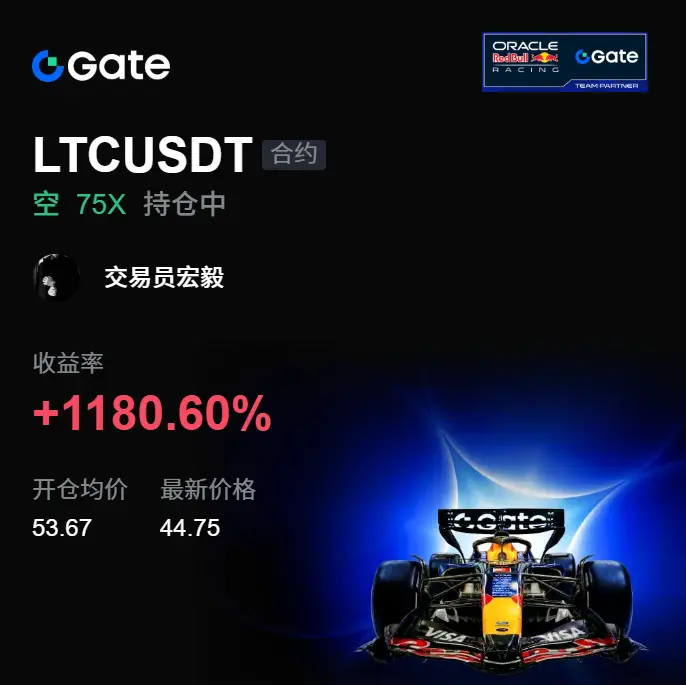
Too fragile! That pullback just now directly smashed the fake rebound back to its original form. During 📉😎 the intraday top-chop, $LTC kept trying to push higher, but every time it was just short by a breath; the spike didn’t hold because there wasn’t sustained buy pressure. The moment the suppression zone was hit, it started to go soft.
Before I even opened the screen this morning, I was watching the details of LTC. The rebound lacked strength, there was insufficient follow-through, and volume didn’t keep up—these signals stacked together 👀. At the time, my move was very clear: go long ar
LTC2.45%
BTC1.64%
ETH3.04%
View Original
post-image
  • Reward
  • Comment
  • Repost
  • Share
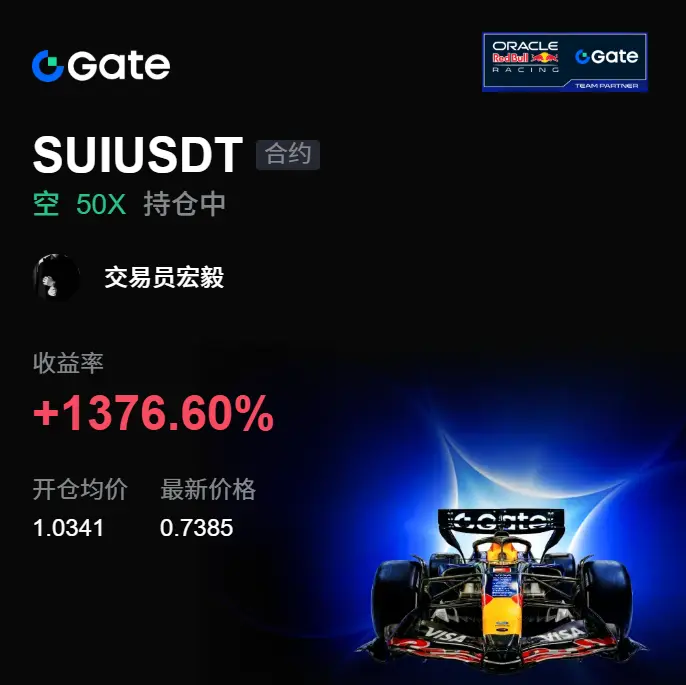
Brutal! This drop doesn’t show any mercy at all—the shorts finally laid the cards out. 📉🔥 For my last look before bed, I watched $SUI . It’s been grinding slowly at higher levels; on the surface it looks like building up energy, but the more I look, the more hollow it seems. When it goes up, no one steps in, and volume hasn’t kept up.

A few days ago, in the early hours, I was watching SUI and saw each rebound was weaker than the last. The overhead pressure never eased 👀 With a setup like this, I don’t go chasing the superficial excitement. I judged it was heavy with bull traps and then fol
SUI2.84%
BTC1.64%
ETH3.04%
View Original
post-image
  • Reward
  • Comment
  • Repost
  • Share
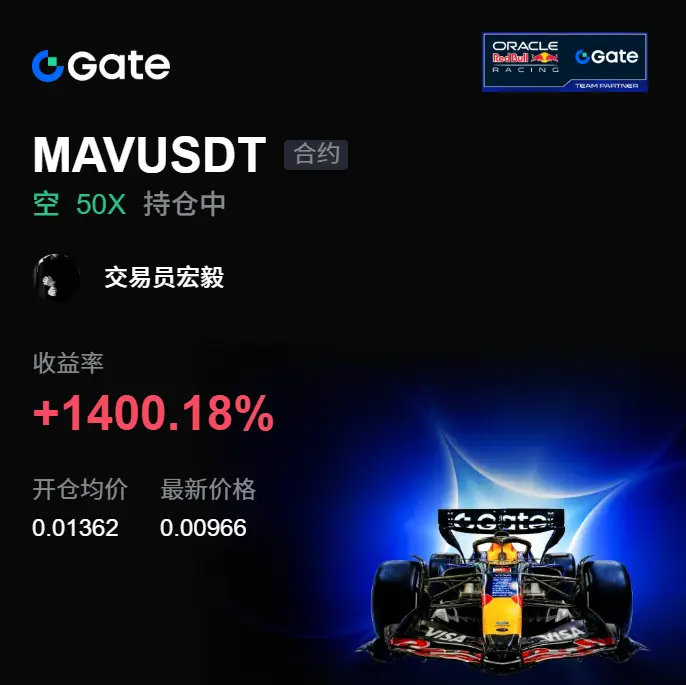
It blew up! This sell-off really left people who chased the highs in silence 📉🚨 A few days ago in the afternoon $MAV it was still acting strong up there. The chart looked lively, but if you look closely, it’s all fake: the pump had no volume, buy support was insufficient, and the moment it got touched from above, it was pushed right back down.

While everyone was still watching, I saw that for MAV every bounce only had one breath left—there wasn’t enough backbone in the bid, and the moment sell pressure came out the chart immediately softened 👀 So the action I suggested back then was simp
MAV5.12%
BTC1.64%
ETH3.04%
View Original
post-image
  • Reward
  • Comment
  • Repost
  • Share
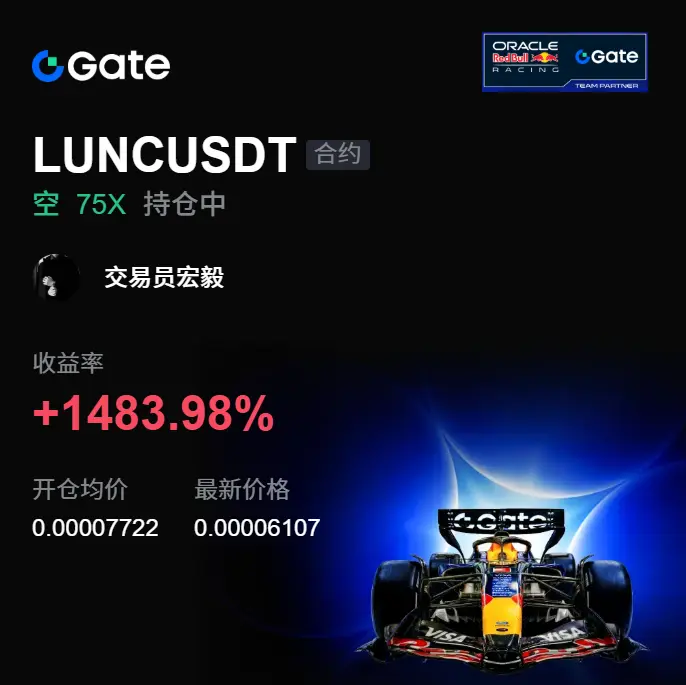
This drop came down way too decisively! 📉🔥 When I opened the chart in the morning, $LUNC it directly tore apart that kind of fake tough talk from a few days ago. Even the night before a few days ago, it was still propping itself up and pushing around at a high level. A lot of people thought it could still surge higher, but what I saw was heavy selling pressure overhead—rebound not continuing, and volume that couldn’t keep up.

Before the market even fully started up, I watched the rhythm of LUNC and found that every time it tried to push up, nobody was there to take it. It would pop upward
LUNC-0.36%
BTC1.64%
ETH3.04%
View Original
post-image
  • Reward
  • Comment
  • Repost
  • Share
Stimulating! With this one hit, all the hesitation at the highs from a few days ago got the answer 🚨📉
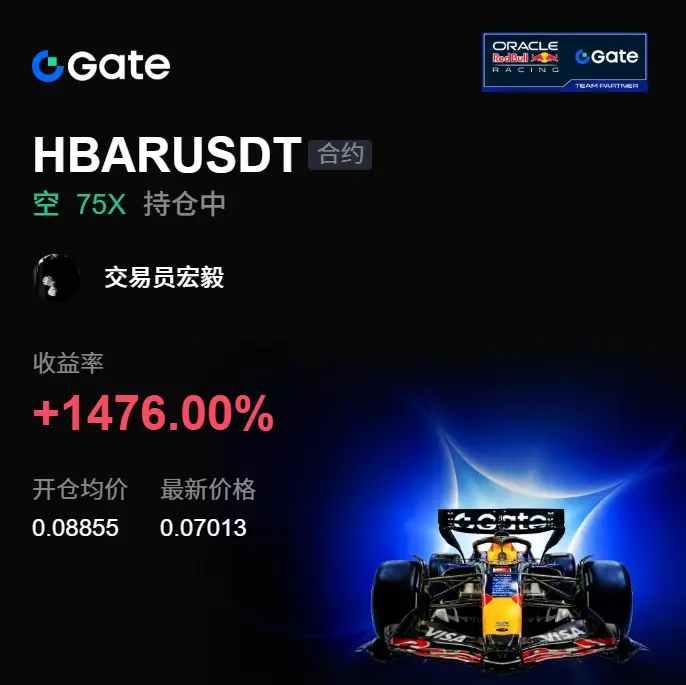
A few days ago, at dawn, I watched $HBAR —it kept grinding up there. On the surface it looked like it was holding strong, but in reality every push higher failed to follow through. Volume couldn’t keep up, there wasn’t enough follow-through on support; the moment the suppression level got touched, it just went soft. I decided then that this kind of chart wasn’t suitable for chasing—short opportunities would be cleaner.
Before the market fully kicked off, when HBAR was nearing 0.08855, I enter
HBAR0.96%
BTC1.64%
ETH3.04%
View Original
post-image
  • Reward
  • Comment
  • Repost
  • Share
I laughed out loud! That little fake tug-at-the-highs—today the shorts finally knocked it back to reality 📉😎

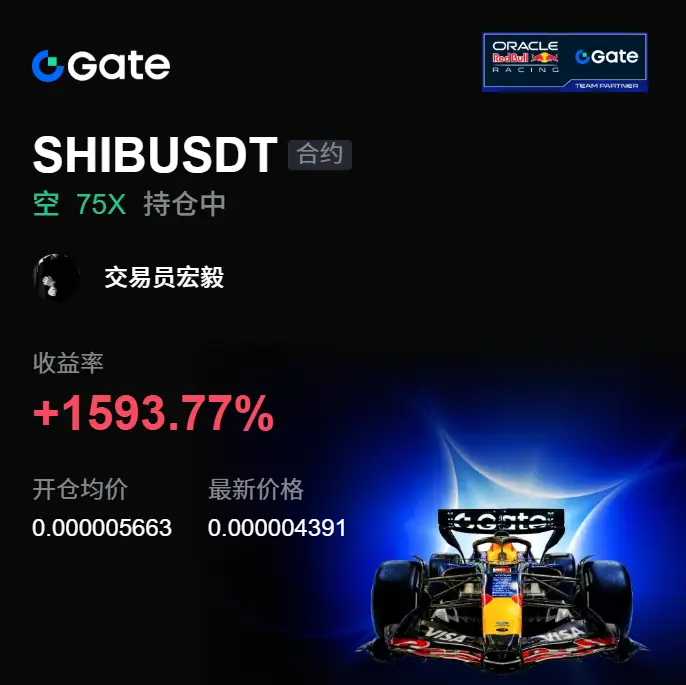
While it ground up at the top during the session, $SHIB looked like it still wanted to push higher, but the details I saw were obvious: no meaningful expansion in momentum, weak rebounds, and it goes soft the moment it gets pushed down from above. While everyone was still watching, I decided that chasing longs here would be uncomfortable—instead, I would focus on the chance to realize profits on opening longs.

Later, SHIB gave an entry around 0.000005663. After entering, I held p
SHIB2.92%
BTC1.64%
ETH3.04%
View Original
post-image
  • Reward
  • Comment
  • Repost
  • Share
So ruthless! This round isn’t a pullback—shorts came out directly to collect their bill 📉🔥
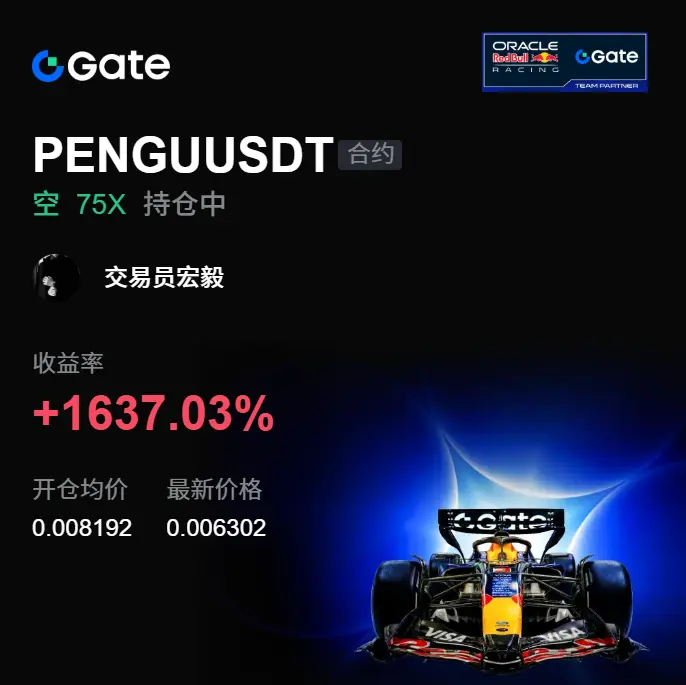
In the morning, when I opened the chart, $PENGU had already broken through that grindy high-level structure from a few days ago. Actually, when I checked one last time before going to sleep a few days ago, I already felt something was off: the bounce didn’t have strength, and the volume wasn’t cooperating. When it went up, there was no one to catch it. The more it ground, the more it looked like it was waiting for a sell-off dump confirmation.
Back then, when I saw PENGU repeatedly fail to push throug
PENGU1.87%
BTC1.64%
ETH3.04%
View Original
post-image
  • Reward
  • Comment
  • Repost
  • Share
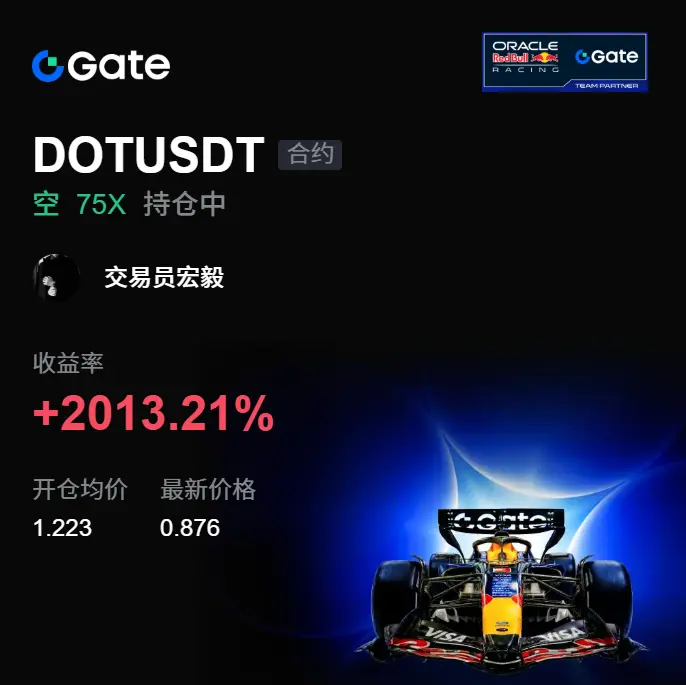
Don’t blink! This just came down hard and directly tore open the high-level fake strength 🚨📉
A few days ago, in the afternoon, DOT was still stubbornly holding up above. A lot of people saw it not falling and wanted to rush in—I, on the other hand, became more and more cautious the more I watched. The overhead pressure was obvious: every time it was pushed up, it fell short by that last breath, and the follow-through wasn’t firm enough. What I reminded back then was: don’t get tricked into chasing longs and let yourself be led by the crowd.
$DOT When there was an opportunity around 1.223, I
DOT6.20%
BTC1.64%
ETH3.04%
View Original
post-image
  • Reward
  • Comment
  • Repost
  • Share
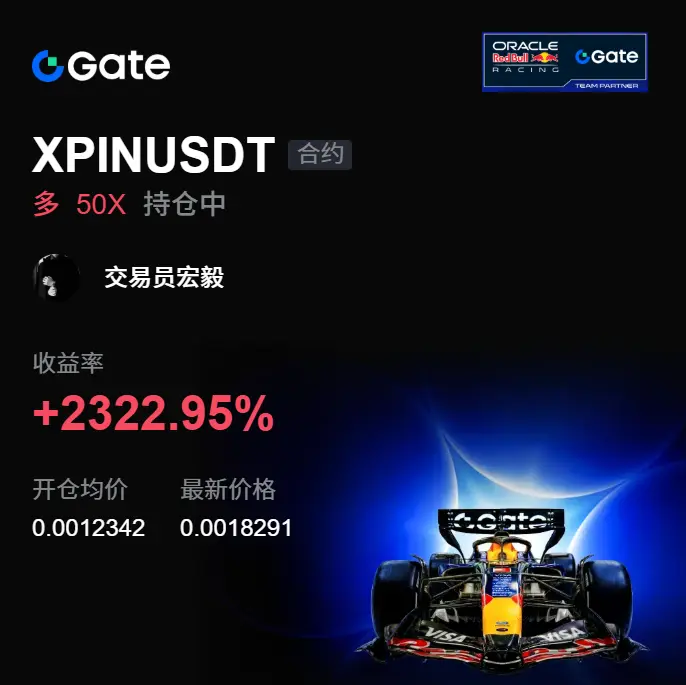
Don’t sleep! This market directly ignites long-side sentiment—whoever sees it won’t feel drowsy 📢🚀
A few days ago, in my last look before bed, $XPIN was still grinding sideways. A lot of people complained it wasn’t moving, but what I was watching then was: a pullback that couldn’t break down, buy pressure getting stronger, and someone quietly accumulating at low levels 👀
When the board hadn’t fully started yet, XPIN repeatedly probed around 0.0012342, but it just wouldn’t collapse downward.
That’s the rhythm.
Some money isn’t made by impulse.
Now 0.0018324 has already been hit, with gains
XPIN31.00%
BTC1.64%
ETH3.04%
View Original
post-image
  • Reward
  • Comment
  • Repost
  • Share
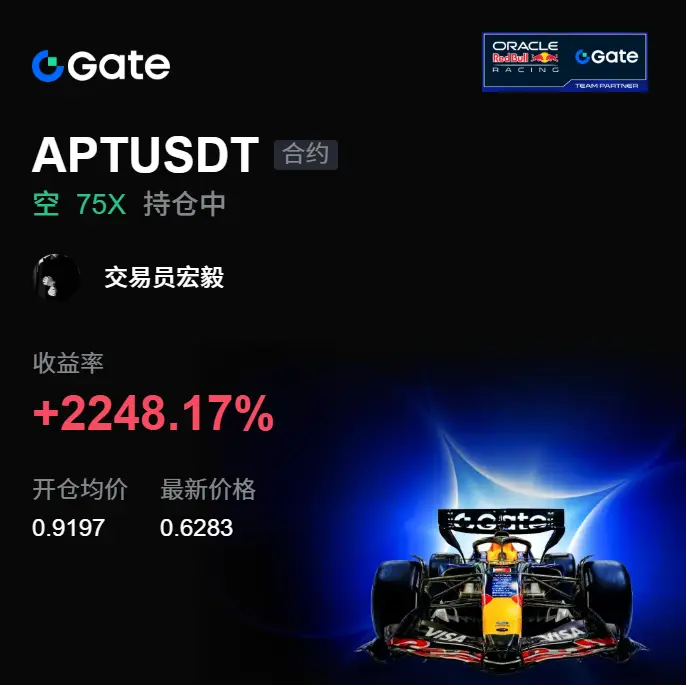
It blew up! This drop is really not showing any mercy—shorts directly hit the rhythm 📉🔥

A few days ago, at around $APT in the early morning, I already felt it was shaky. The bounce looked pretty lively, but the volume didn’t keep up—no one stepped in to take it when it spiked. Before the market had fully started, I judged this wasn’t strength; it was high-level pressure. I reminded myself to follow the “open longs” rhythm to watch it.

Entry was around 0.9197. It then got pushed down step by step, and at the current price of 0.6283, the return rate is +2248.17%—this piece of meat is real
APT1.27%
BTC1.64%
ETH3.04%
View Original
post-image
  • Reward
  • Comment
  • Repost
  • Share
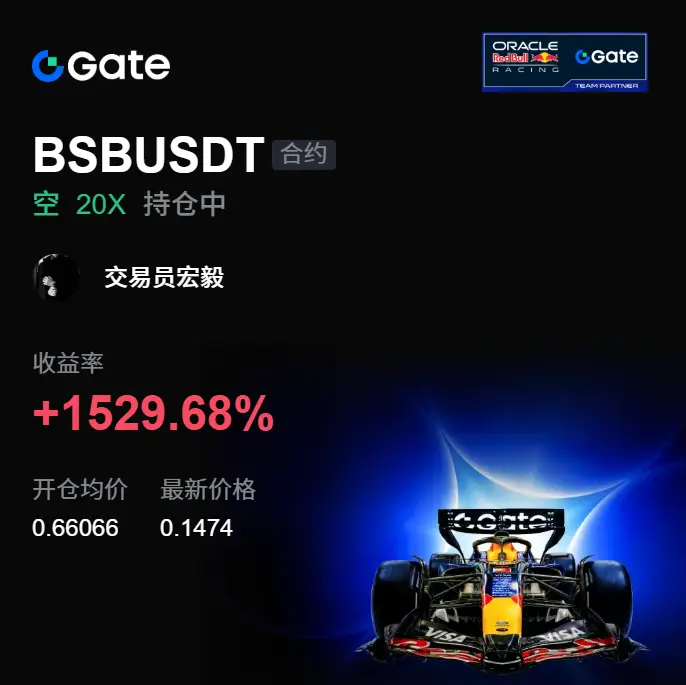
Too real! A few days ago it was still pretending to be strong, and today it was smashed and exposed its true form 📉🔥
A few days ago at $BSB in the early morning, it kept swaying around the high. Many people couldn’t see it dropping and wanted to push higher. What I was seeing then was lackluster rebound, insufficient follow-through/acceptance, and the sell pressure above still hadn’t disappeared. That kind of order book that softens as soon as it pushes—don’t just watch the excitement.

Before the market had fully started moving, I was already watching the details of BSB 👀
The volume didn
BSB1.39%
BTC1.64%
ETH3.04%
View Original
post-image
  • Reward
  • Comment
  • Repost
  • Share
Don’t blink! This round of sell-off has cashed out too cleanly—the chart basically called it straight. 🔥📉
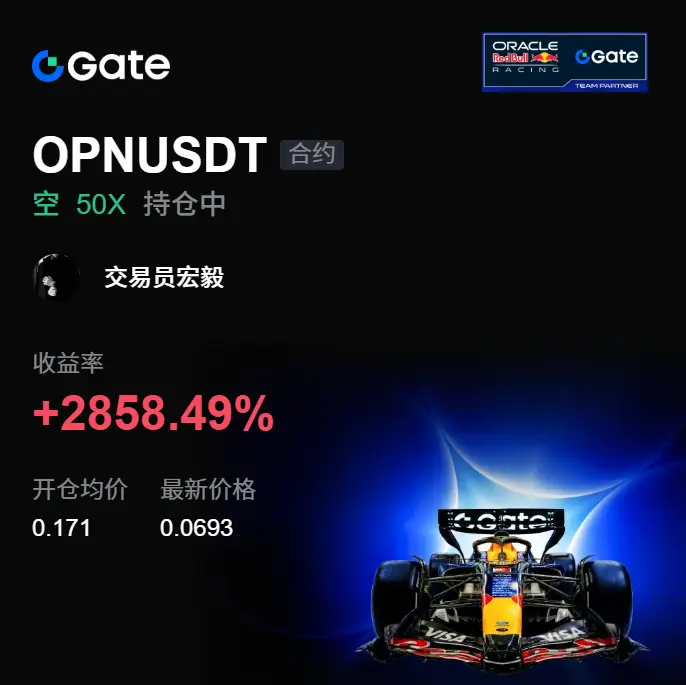
During the session’s top-grinding, $OPN looked quite solid, but I wasn’t watching whether the candles were red or green—I was watching whether the overhead pressure had been absorbed. The result was obvious: several attempts to surge failed to hold, and the volume couldn’t keep up.

While everyone was still watching, I saw OPN’s rebound getting more and more weak 👀
This kind of market is the easiest to fool people. It rises a bit and makes you want to chase, but once you’re up there,
OPN19.02%
BTC1.64%
ETH3.04%
View Original
post-image
  • Reward
  • Comment
  • Repost
  • Share
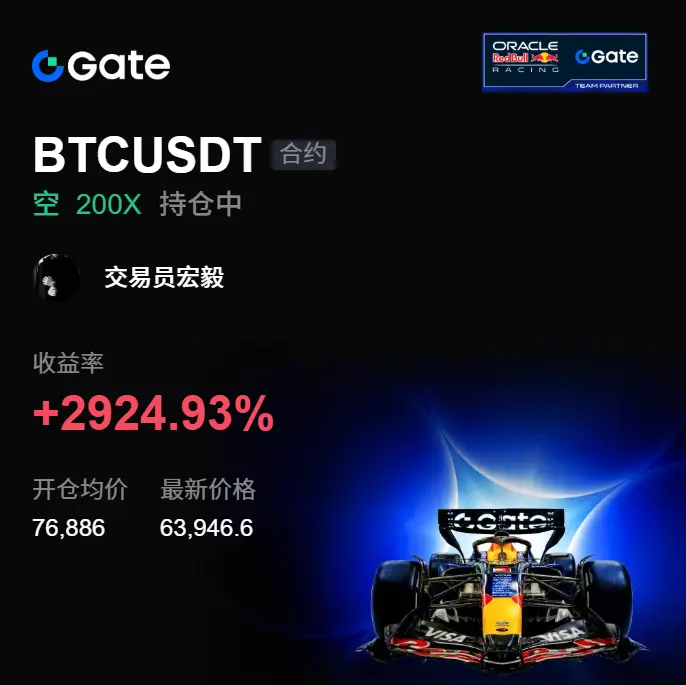
Amazing! It pretended to be strong at the high level for half a day, and in the end the bears still pressed it down with one move 📉🚨
A few days ago, my last look at $BTC before sleep—it was hovering back and forth above. It looked like it was going to break out, but the details were all wrong: a rise without volume, weak follow-through, and nobody to take it upward.

Before opening the chart in the morning, I remembered that structure from a few days ago 👀
A bounce isn’t impossible, but if the bounce has no volume and the suppression isn’t broken, it’s very easy to turn into a bull trap. M
BTC1.64%
ETH3.04%
SOL0.08%
View Original
post-image
  • Reward
  • Comment
  • Repost
  • Share
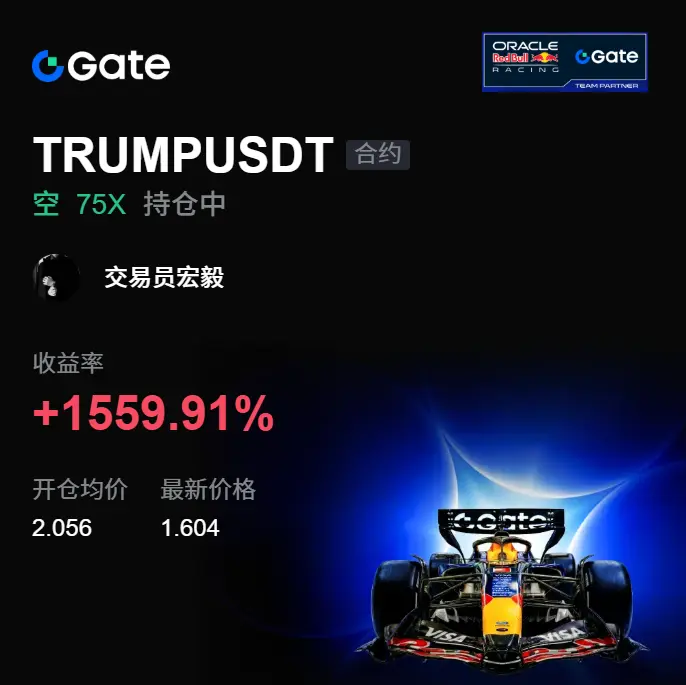
It exploded! This drop straight down really shattered the high-level hopes 📉🔥
A few days ago in the afternoon $TRUMP it was still grinding above. A lot of people thought since it wasn’t dropping, it could still surge. But the more I watched, the more uncomfortable I felt. The minute it touched the top, it went soft, and the volume didn’t cooperate. Every bounce looked like it was short of one breath.

Before the chart had fully started, I watched how TRUMP held 👀
The buy side couldn’t take it, while sell pressure kept pressing. In this position, I’m not afraid of it going sideways—I’m afr
TRUMP0.81%
BTC1.64%
ETH3.04%
View Original
post-image
  • Reward
  • Comment
  • Repost
  • Share
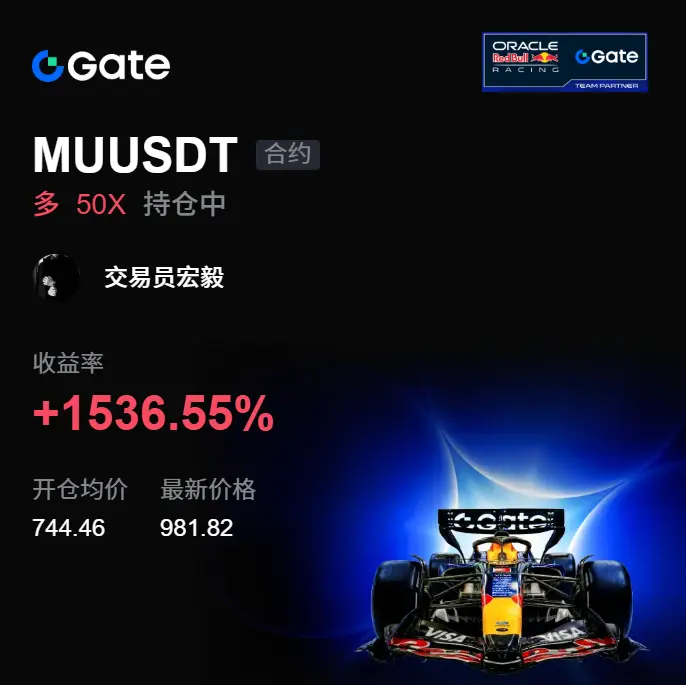
Oh wow! This pump is too savage—the chart completely wiped out the drowsiness right on the screen 🚀🔥
A few days ago, when everyone was still watching from the sidelines in the early morning, $MU was still grinding at the low end. What I was looking at wasn’t whether it was slow or fast, but whether the key level would get broken. The result is very clear: MU retested, held, sell pressure eased, and there’s been someone catching bids underneath👀📌

Back then, I advised looking for long opportunities around 744.46—not to impulsively chase, but to wait for the structure to give you a signal.
MU-0.26%
BTC1.64%
ETH3.04%
View Original
post-image
  • Reward
  • Comment
  • Repost
  • Share
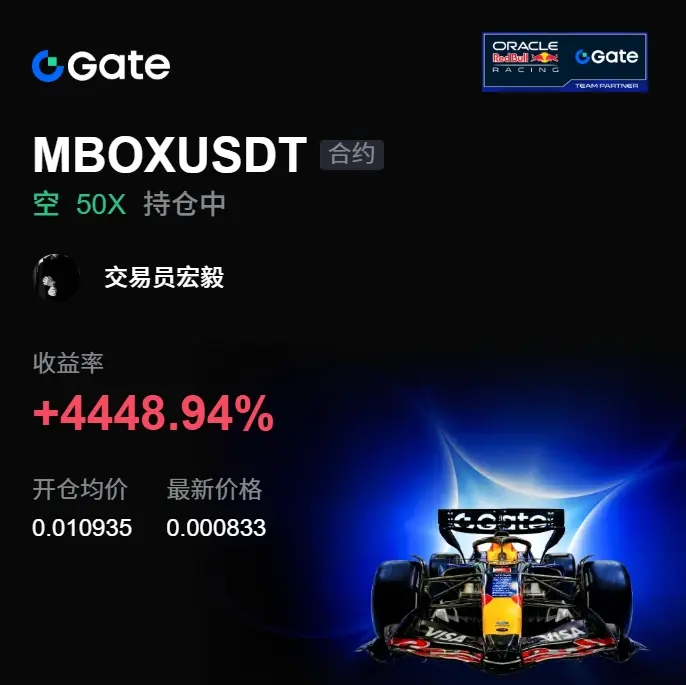
Too brutal! After this drop, even the ones who were chasing orders a few days ago have been silent 🚨📉
When I was watching $MBOX early in the morning a few days ago, the chart was still holding up at high levels—on the surface it looked like it might keep pushing higher. But what I saw was that volume didn’t keep up, the overhead pressure hadn’t loosened, and once it surged up, there was nobody to take it. While everyone was still hesitating, I judged this move was more like a bull trap, so it wasn’t suitable to chase the breakout.

Back then, MBOX gave a spot around 0.010935. I followed th
MBOX1.27%
BTC1.64%
ETH3.04%
View Original
post-image
  • Reward
  • Comment
  • Repost
  • Share
It blew up! A few days ago it was still pretending to be asleep, but today it directly woke the board up 🚀 Even before the order book was fully live, $EVAA looked pretty ordinary, but the details had already started to change.
A few days ago, in the afternoon, I watched EVAA. I was focused on three things: whether key levels had been lost, whether the retest could hold, and whether the bid side was getting stronger 👀 The price ground around 0.4489 for a long time without breaking through, and at the time I signaled to go long—at this kind of spot, it’s all about patience.
Now it’s pulled fr
EVAA7.45%
BTC1.64%
ETH3.04%
View Original
post-image
  • Reward
  • Comment
  • Repost
  • Share
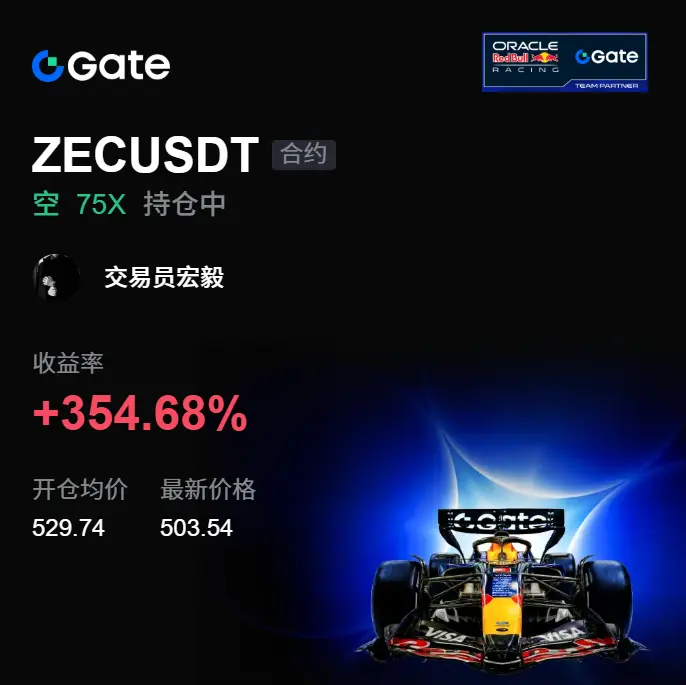
Don’t blink! This sell-off just now directly shattered the high-level long sentiment 📉🔥
While everyone is still watching, I was staring at the details of ZEC and felt something was off: $ZEC it was really hard to push upward, the volume didn’t keep up, and any time it touched the overhead resistance, it immediately fell back. Before the market action fully got started, I judged it was more like a weak bounce—so it wasn’t suitable for chasing the surge 👀
So I executed a long position around 529.74, waiting for it to be unable to push up before cashing out. Now the price is at 503.26, and th
ZEC3.72%
BTC1.64%
ETH3.04%
View Original
post-image
  • Reward
  • Comment
  • Repost
  • Share
  • Pinned