ThisIsTranslateContent:Jiang

vip
Age 0.1 Year
Peak Tier 0
Jiang Heng has been in the crypto world for ten years. Focused on Bitcoin and Ethereum short- to medium-term contracts, nothing else. No hype, no grand promises. 坚持做难且正确的事,只讲纪律、概率,不谈运气
### 7.10 BTC Evening Market Analysis

BTC is currently around 64,160. After a higher intraday push, it pulled back, and in the short term it has entered high-range consolidation.
**Evening outlook:**
Earlier, it surged to around 64,583 and then pulled back. It is currently consolidating around the 64,160 area. The 64,500-64,600 zone above is the resistance area, while 63,800-64,000 below is short-term support.
**Trading plan:**
- If you already hold, reduce risk in the 64,500-64,600 area; after a breakout, look for 64,800-65,000.
- If you haven’t entered yet, wait for a pullback to 64,000-64,
BTC1.45%
View Original
post-image
  • Reward
  • Comment
  • Repost
  • Share
BTC Bottoming Debate: Three Institutions, Three Verdicts—Who Do You Trust?
As to whether Bitcoin has bottomed out, three leading institutions offered sharply different views on the same day. The disagreement is so significant that it’s worth breaking down.
**Glassnode:** Late-stage bottoming, but not yet time for a reversal
Glassnode believes Bitcoin is in the late stage of the bottoming process, but capitulation-like selling by long-term holders remains elevated. The realized loss volume has recently hit a peak near **$280 million per day**, the highest level since **December 2022**. This met
BTC1.45%
ETH2.73%
View Original
  • Reward
  • Comment
  • Repost
  • Share

Yesterday it was very clear: reverse and close at 1745-1755, stop loss 1765, targets 1730/1715.
Woke up and the market has completed the move on its own.
Those who followed this trade, let me see in the comments $ETH #USD1链上质押享年化8.88%
ETH2.73%
View Original
post-image
  • Reward
  • Comment
  • Repost
  • Share
Newcomer’s first trade is a great start!
Last night, I brought a new friend in around 625 and confidently placed BTC trades. This morning, around 637, I closed the position steadily for take profit—1,000 points safely in my pocket.
The first trade immediately caught a favorable setup; luck and timing are both on point! $BTC #Solana生态ANSEM暴涨
BTC1.45%
View Original
  • Reward
  • Comment
  • Repost
  • Share
7.10

Near SOL 78.50-78.80, try a light long; stop loss at 78.00; target 79.50/80.00;
For the 80.00-80.50 range above, wait for an opportunity to reverse and control the position; stop loss 81.00; target 79.00/78.50.
The market is ranging and consolidating around 79.00. The AVL average at 78.50 forms support below. Since the current price is close to 79.00, directly chasing a long position isn’t very cost-effective; waiting for a pullback to 78.50-78.80 before acting is safer.
The 80.00-80.50 zone above is a resistance area. If a stall/range-up signal appears when the rebound reaches this reg
SOL0.03%
View Original
post-image
  • Reward
  • Comment
  • Repost
  • Share
7.10

Trade a light long for ETH around 1750-1755; stop loss at 1735; targets 1770/1780;
Above 1780-1790, wait for a reverse short setup; stop loss at 1800; targets 1755/1745.
The market rebounded from around 1735 to 1766. The AVL average at 1769 is slightly above the current price, and short-term consolidation is biased bullish. Below 1750-1755 is the prior support zone; buying on a pullback here is safer than chasing higher prices.
Above 1770-1780 is the resistance band (24h high near 1777). If the rebound into this area shows signs of stagnation, you may consider reversing and going short.
ETH2.73%
View Original
post-image
  • Reward
  • Comment
  • Repost
  • Share
7.10
Long lightly near 63500-63600, stop loss 63200, target 64000/64200;
Above 64200-64400 zone wait for reversal short opportunity, stop loss 64600, target 63700/63400.

The chart has rebounded from the low of 61668 to 63789, with the AVL average of 63760 roughly flat with the current price. Short-term bias is bullish but nearing the previous high resistance zone. The 63500-63600 area is the previous breakout level; buying the dip here is safer than chasing highs.
The 64000-64200 zone above is a resistance band. If a stagnation signal appears on a rebound to this area, consider reversing to sh
BTC1.45%
View Original
post-image
  • Reward
  • Comment
  • Repost
  • Share
Bitcoin held above 62,000 amid the firing—what does this “downside resilience test” mean?
In the past few days, the crypto market has gone through an interesting stress test. The situation between the U.S. and Iran suddenly escalated: Trump announced that the U.S.-Iran memorandum of understanding had been “terminated,” the U.S. military launched a new round of strikes on Iran, and Brent crude oil rose by more than 7% at one point and broke above $80. According to the playbook from the past, with a geopolitical shock of this level, Bitcoin should have dropped by at least 5%. But what happened i
BTC1.45%
ETH2.73%
View Original
  • Reward
  • Comment
  • Repost
  • Share

After BTC surged to 63,254 and then pulled back to 62,958, 63,000 still couldn’t hold—does this breakout count as successful?
BTC topped at 63,254.5 but failed to hold, retreating to around 62,958. The 24h high of 63,254.5 corresponds to a short-term upper wick area; after the price touched it, it quickly pulled back, indicating that sell orders are indeed pressing above 63,000.
K-line details:
On the 1-hour chart, after the high of 63,254.5, there were consecutive small bearish candles and a continued pullback. The closing prices gradually drifted lower, and short-term momentum clearly weaken
BTC1.45%
View Original
post-image
  • Reward
  • Comment
  • Repost
  • Share

“Er Bing” early session idea delivered with precision again!
The 1720–1730 order strategy was laid out clearly, targeting 1745 with a perfect touch. The price action played out exactly like the script, with every entry point landing precisely on target. The stop loss at 1705 was not hit at all from start to finish, and the direction stayed correct the whole way through.
In a ranging market, being able to lock in the range in advance and calculate the targets accurately depends on understanding the chart and nailing the rhythm.
Once the direction is right, all that’s left is to wait for the mar
ETH2.73%
View Original
post-image
  • Reward
  • Comment
  • Repost
  • Share
The meme craze is back: over $15 billion worth of trading volume has flowed into SOL in one week—how long can the “golden dog” rally last?
This week, the SOL ecosystem has been lifted by meme coins. Total trading volume has exceeded $15 billion. Estimated aggregate capital inflows are $1.8–$2.8 billion. Total market capitalization is already approaching its historical high. With “golden dogs” appearing frequently, the wealth-building effect is maximized, and on-chain activity as well as capital turnover have risen significantly.
This meme-driven rally has a few characteristics:
First, capital
SOL0.03%
View Original
  • Reward
  • Comment
  • Repost
  • Share
7.9
For SOL, lightly try a long around 77.00–77.30; stop loss at 76.20; target 78.50/79.00;
In the 78.80–79.20 range above, wait for a reversal and take a short opportunity; stop loss at 79.80; target 77.50/77.00.
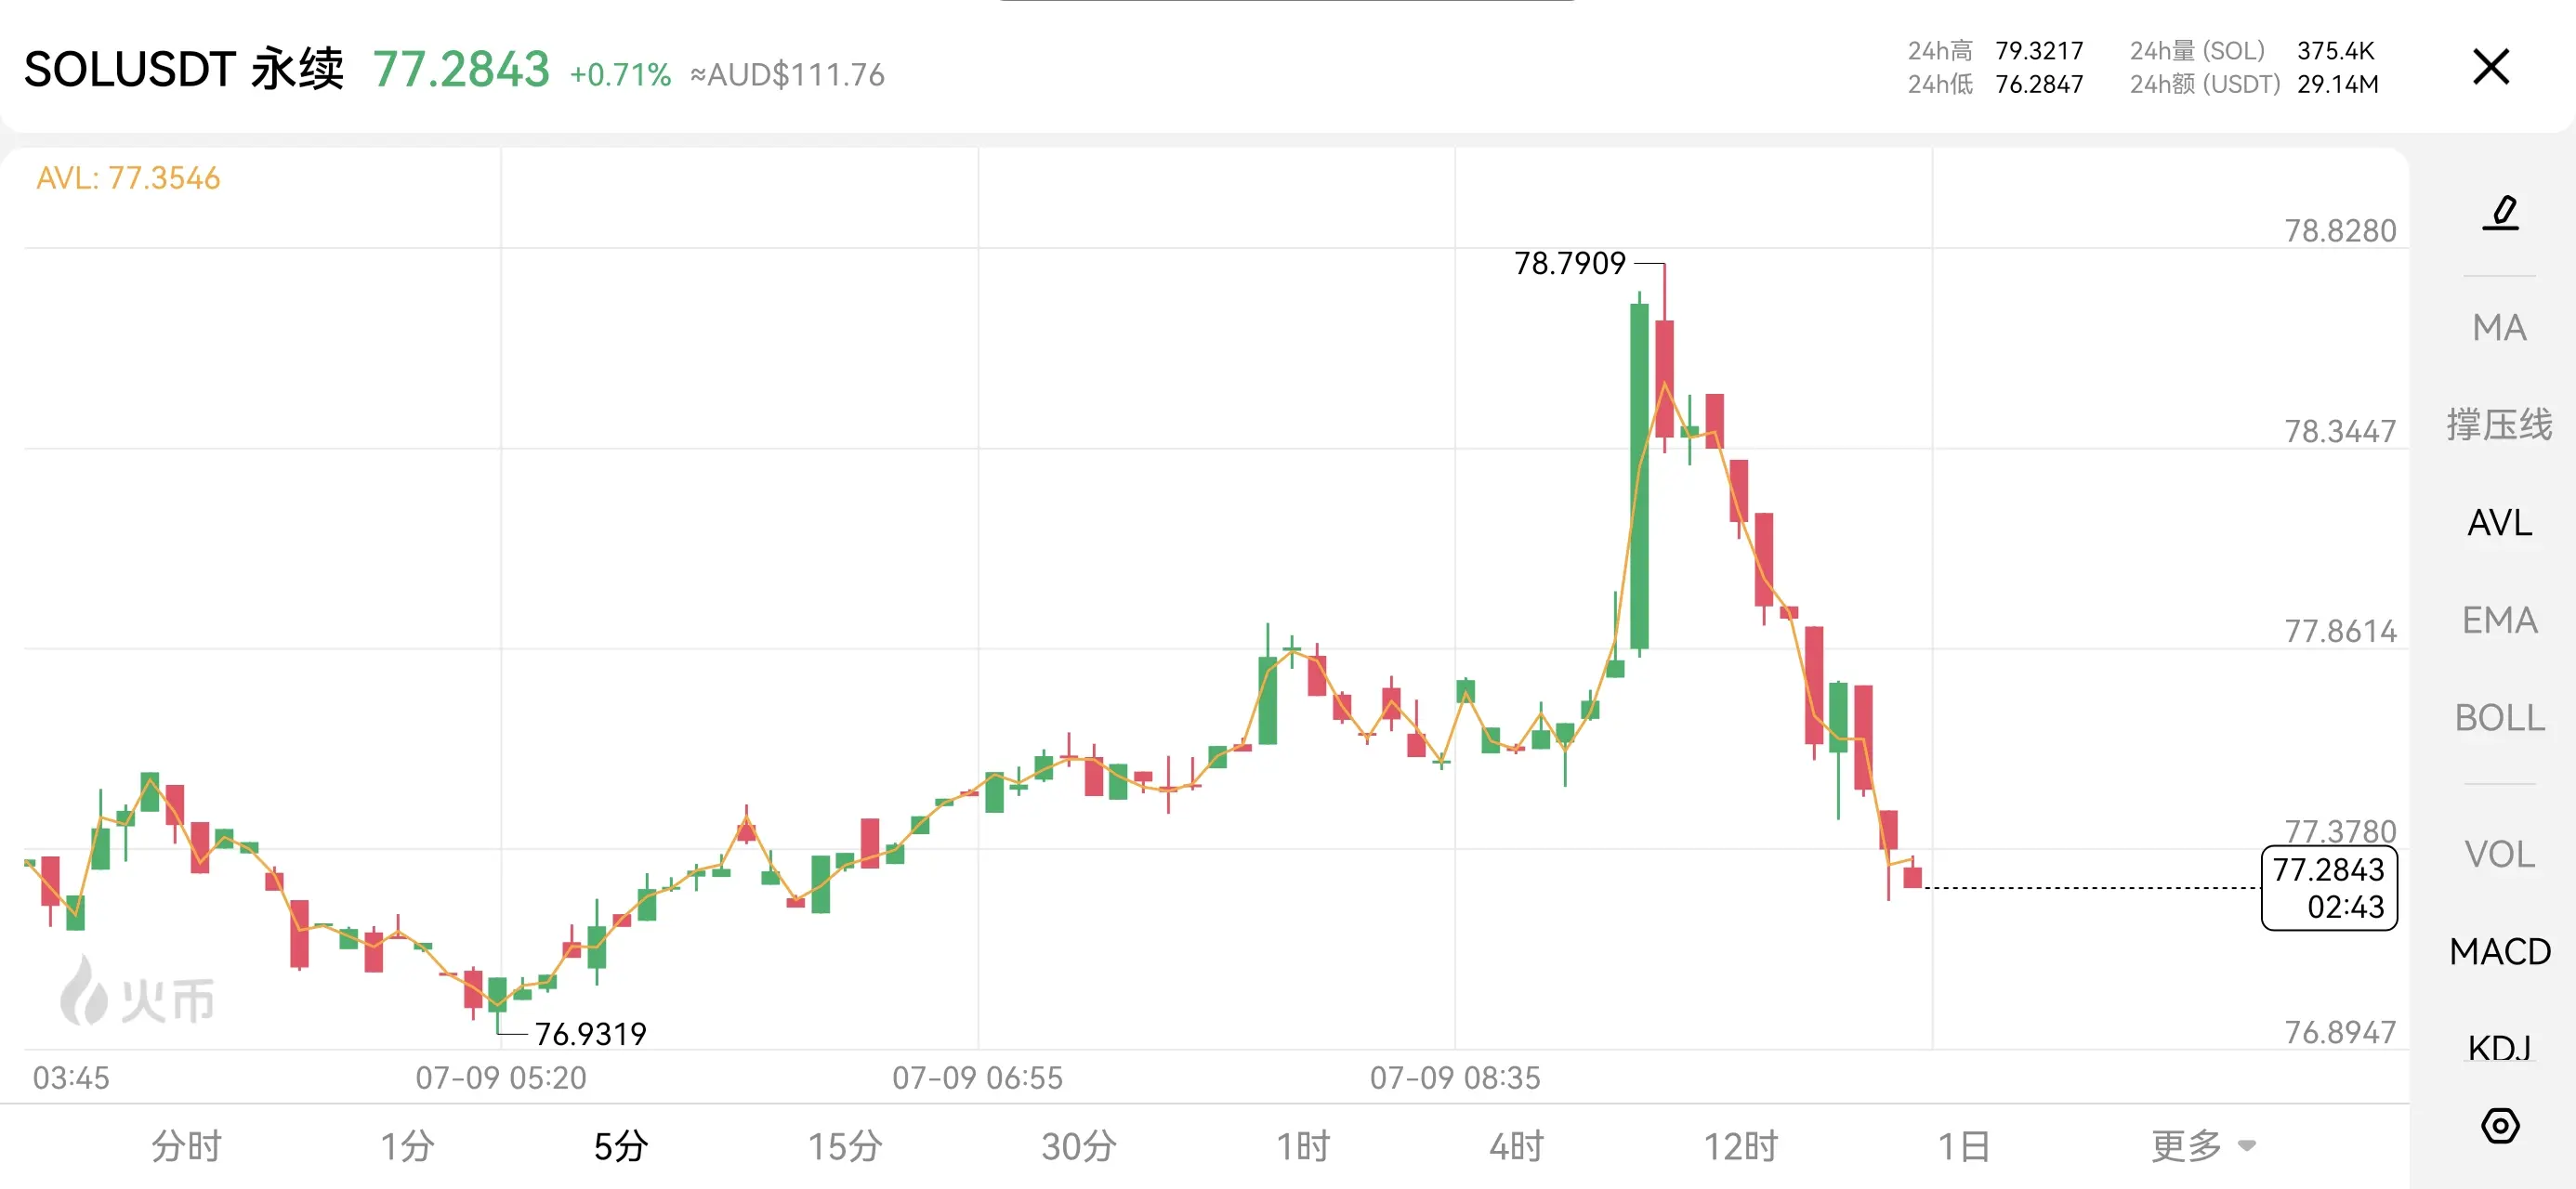
The market rebounded from the 76.93 low to 78.28, and the AVL average of 77.86 was broken—short-term bias is bullish. The 77.00–77.30 area below is the prior support zone; it’s more reliable to go long on a pullback here than to chase highs.
The 78.80–79.20 zone above is a resistance band. If you see signs of stagnation when price rebounds to this area, consider reversing to short.
I
SOL0.03%
View Original
post-image
  • Reward
  • Comment
  • Repost
  • Share
7.9

Near 1720-1730, try a light-long. Stop loss at 1705, targets 1745/1755;
Above, wait for a reversal control opportunity within the 1745-1755 range. Stop loss 1765, targets 1730/1715.
The market rebounded from the 1712 low to 1734. The AVL average at 1734 is basically in line with the current price, with a balance between longs and shorts in the short term. Below, 1720-1730 is the prior support zone; pullbacks here are safer than chasing highs.
Above, 1745-1755 is the short-term resistance band (near the prior high). The control level has been moved down from 1760 to 1745-1755, matching th
ETH2.73%
View Original
post-image
  • Reward
  • 3
  • Repost
  • Share
GlassDomeObservatory:
The resistance above 1755 is considerable. When price reaches that level, reverse and open a short position (one lot). In a ranging market, you can profit from both ends.
View More
7.9

Near 62000-62100, take a light long attempt; stop loss 61700; target 62500/62800.
In the 62800-63000 range above, wait for a counter-position (reverse entry) control opportunity; stop loss 63200; target 62300/62000.
The market rebounded from a low of 61527 to 62293. The AVL average of 62273 is basically in line with the current price, and the short-term long/short is balanced. Below, 62000-62100 is the earlier support zone; a pullback to test here is safer than chasing highs.
Above, 62500-62800 is the resistance band. If you see a stagnation signal when the rebound reaches this area, you
BTC1.45%
View Original
post-image
  • Reward
  • 1
  • Repost
  • Share
TheMoonReflectsOnTheTranquil:
Stop loss set quite tight, the risk-reward ratio at this position is acceptable, I'm in.
#美终止对伊朗石油制裁豁免 U.S. ends Iran oil sanctions exemption, oil prices jump 5% — Will the crypto market “dance” to inflation next?
On July 7, the U.S. Department of the Treasury revoked the license for Iran’s oil sales exemption, with follow-up trading allowed only until July 17. WTI crude oil and Brent crude both rose more than 5% intraday. The rationale points to Iran’s recent attack on three commercial vessels in the Strait of Hormuz, and on the same day the U.S. military announced that it had completed a new round of military strikes against Iran.
With just 10 days left in the exemption window,
BZ-0.28%
BTC1.47%
ETH2.78%
PAXG-0.06%
View Original
  • Reward
  • 1
  • Repost
  • Share
DepegDaydream:
When oil prices rise, electricity bills follow suit, and miner brothers have to run the numbers again. This market is truly a struggle to survive in the cracks.
7.8 Afternoon Real-time Supplement
Morning strategy fully realized, market movement highly consistent with early morning forecast, point and rhythm precisely grasped.
BTC light long test near 62460-62520, stop loss 62440, target 62900/63050;
Above, wait for reversal short opportunity in 62950-63060 range, stop loss 63120, target 62600/62460.
The market fell from intraday high of 63062 to 62457, 5-minute chart spiked and then pulled back under pressure, AVL average 62694 forms resistance above, short-term oscillating weakly but not suitable for chasing shorts. Below, 62450-62520 is the key intr
BTC1.45%
View Original
  • Reward
  • 3
  • Repost
  • Share
VolatilityOfToastingBread:
If it breaks below 62440, is there support in the 62260-62100 range? Feels like liquidity is not enough.
View More
Fed meeting minutes hit at 2 a.m.—after the whales accumulated and Strategy reduced its holdings, the market is waiting for a direction.
Ahead of this, whales accumulated 270,000 BTC over two weeks; afterward, Strategy cashed out 3,588 BTC—bulls and bears each doing their own thing. At 2:00 a.m. Thursday, the first set of Fed meeting minutes after Warsh took office was released, and the market held its breath.
What should you look for in these minutes?
Look at the wording describing risks of economic downside. Morgan Stanley noted that Warsh is becoming balanced in the “dual mandate,” no longe
BTC1.45%
ETH2.73%
View Original
  • Reward
  • 1
  • Repost
  • Share
GlassDome:
Life and death are decided at 2 a.m., and contract traders are already trembling with fear.
7.8

Go for a light long near SOL 78.80-79.00, stop at 78.00; target 80.00/80.80.
Wait for an opposite-side control (reverse) opportunity in the 80.80-81.50 zone; stop at 82.00; target 79.50/78.80.
The chart rebounded from the 78.75 low to 79.31, showing signs of short-term stabilization. The 78.75-79.00 area below is the near-term support zone—going long on a pullback here is more reliable than chasing a short.
The 80.00-80.80 area above is a resistance band. If the rebound into this zone shows stagnation signals, you may consider reversing for control (short).
For today, first expect range-
SOL0.03%
View Original
post-image
  • Reward
  • 4
  • Repost
  • Share
LateFeeLeo:
78.75 is indeed a crucial support—if the pullback doesn’t break it, the long entry has good cost performance.
View More
7.8

Near 1750-1760, consider a light “candle” probe attempt; stop loss at 1730; targets 1780/1795.
In the 1795-1810 range above, wait for a counter-trend “control” opportunity; stop loss at 1820; targets 1760/1740.
From the 1748.53 low, the market rebounded to 1759.60. The AVL average at 1770.51 forms resistance overhead. The short-term bias is bearish, but it’s not advisable to chase the sell-off. Below 1748-1755 is the 24h low zone and also a nearby support area. Pullbacks into this area are more reliable for “candle” attempts than chasing shorts.
Above, 1780-1795 is the AVL and moving-ave
ETH2.73%
View Original
post-image
  • Reward
  • 2
  • Repost
  • Share
YieldCartographer:
This position where you can control both sides and take profits is indeed comfortable. Once 1748 is held firmly, that’s a scalp-bounce opportunity—but the pressure just above 1780 is also not small. Go as you watch—stay observant.
View More
  • Pinned