Trade
Basic
Futures
Futures
Hundreds of contracts settled in USDT or BTC
TradFi
Gold
Trade global traditional assets with USDT in one place
Options
Hot
Trade European-style vanilla options
Unified Account
Maximize your capital efficiency
Demo Trading
Futures Kickoff
Get prepared for your futures trading
Futures Events
Participate in events to win generous rewards
Demo Trading
Use virtual funds to experience risk-free trading
Earn
Launch
CandyDrop
Collect candies to earn airdrops
Launchpool
Quick staking, earn potential new tokens
HODLer Airdrop
Hold GT and get massive airdrops for free
Launchpad
Be early to the next big token project
Alpha Points
Trade on-chain assets and enjoy airdrop rewards!
Futures Points
Earn futures points and claim airdrop rewards
Investment
Simple Earn
Earn interests with idle tokens
Auto-Invest
Auto-invest on a regular basis
Dual Investment
Buy low and sell high to take profits from price fluctuations
Soft Staking
Earn rewards with flexible staking
Crypto Loan
0 Fees
Pledge one crypto to borrow another
Lending Center
One-stop lending hub
VIP Wealth Hub
Customized wealth management empowers your assets growth
Private Wealth Management
Customized asset management to grow your digital assets
Quant Fund
Top asset management team helps you profit without hassle
Staking
Stake cryptos to earn in PoS products
Smart Leverage
New
No forced liquidation before maturity, worry-free leveraged gains
GUSD Minting
Use USDT/USDC to mint GUSD for treasury-level yields
More
BBone
No content yet
BBone
🚀The most mysterious money-making machine on Wall Street, smashing Bitcoin at 10 a.m. every day!
🚀It was he who prevented this round of the bull market from hitting 150,000, 200,000 USD!
🚀Rumors suggest Chinese regulators are investigating Jane Street's trading behavior in the Chinese ETF market.
🚀Jane Street's three sins: insider trading, index manipulation, Bitcoin morning killer.
One incident might be a coincidence, three might be luck, but what about the tenth time?
Starting in the second half of 2025, some traders who follow Bitcoin trends on Twitter noticed something strange. They re
BTC2.95%

- Reward
- 1
- Comment
- Repost
- Share

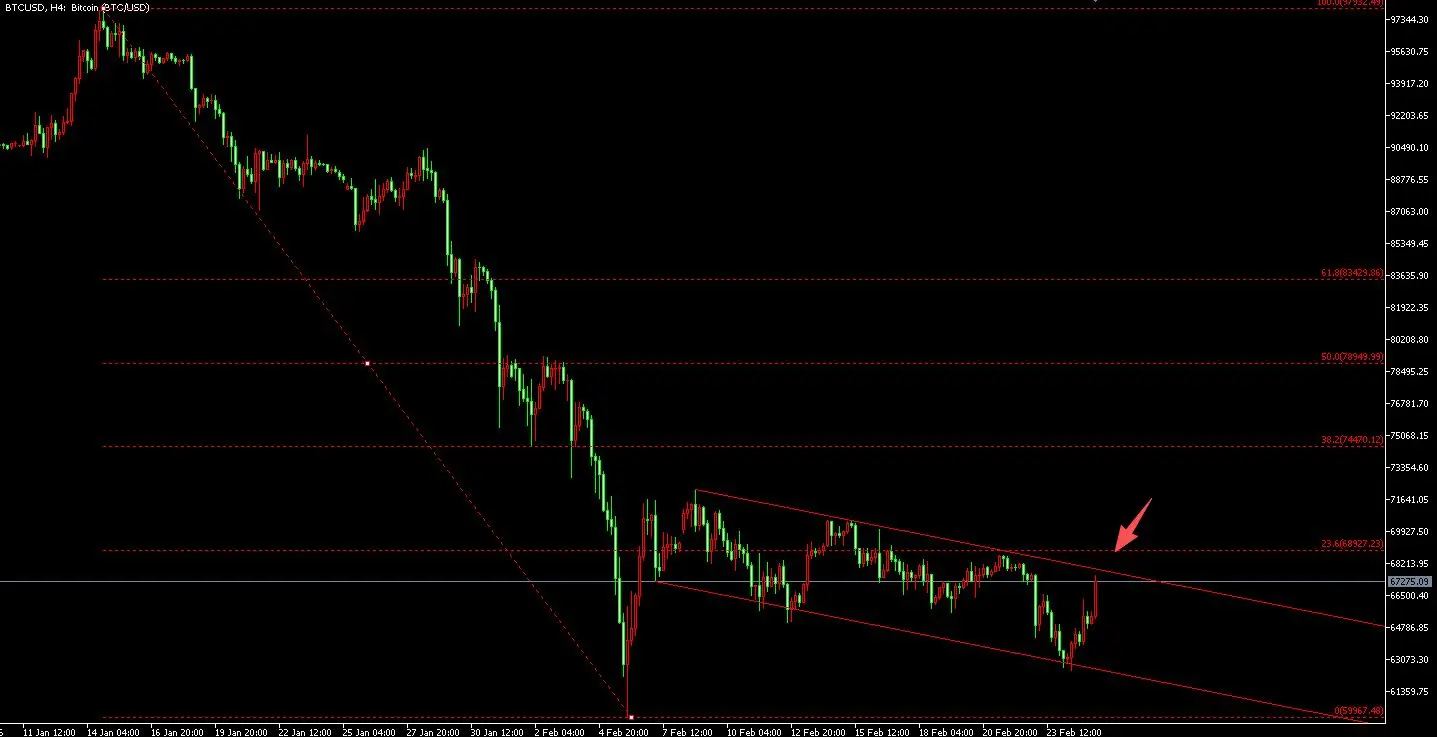
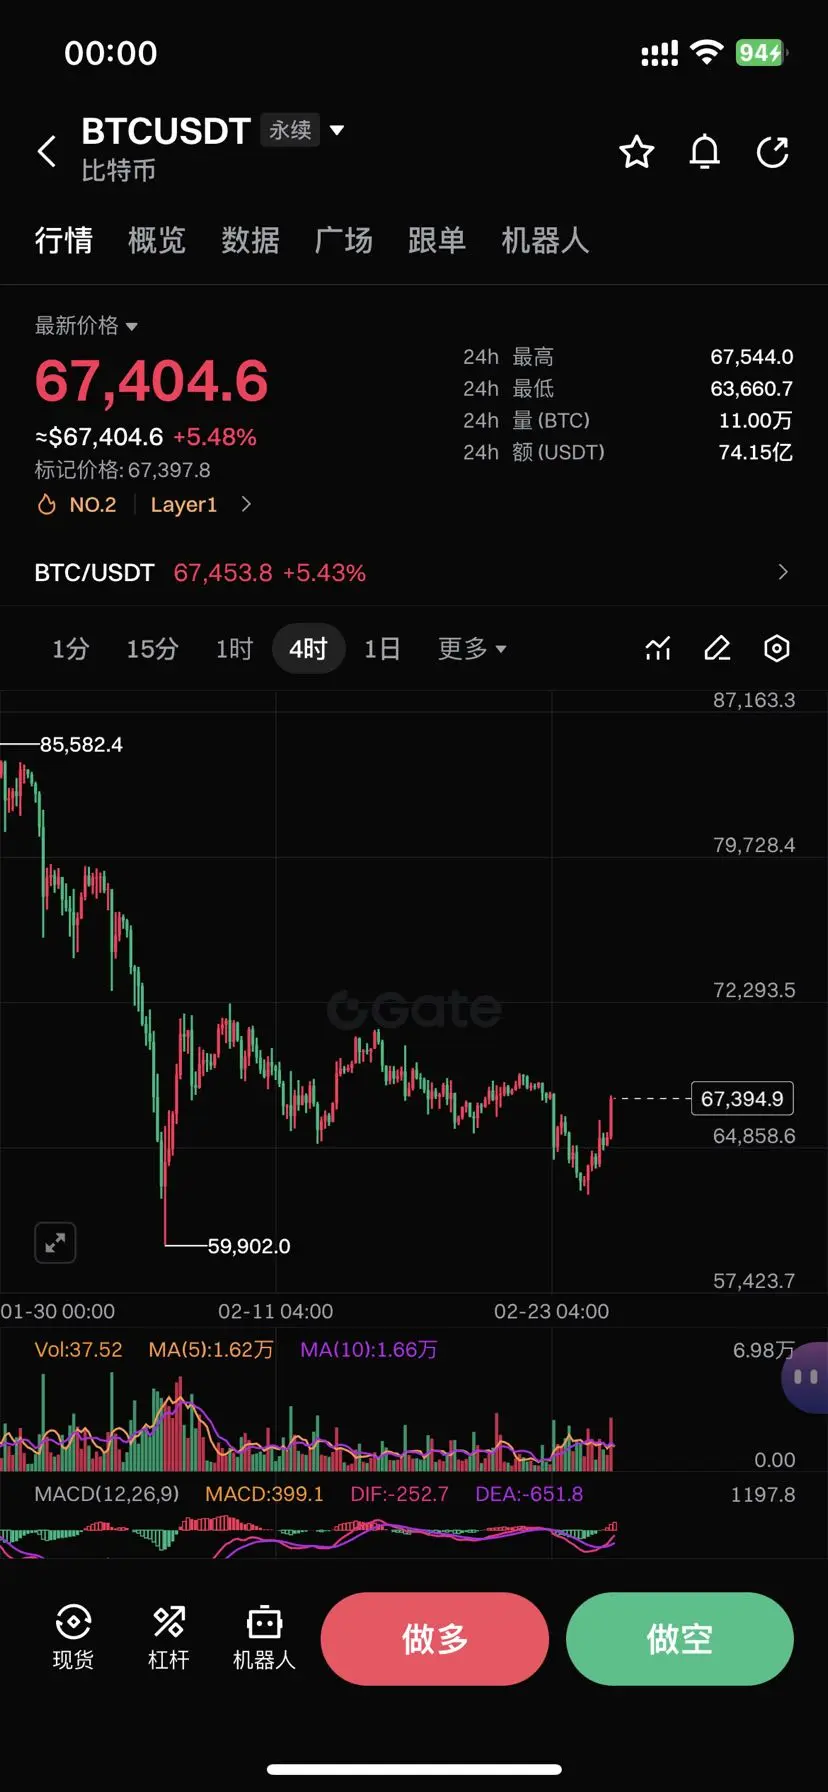
2.25 Bitcoin Evening Trading Strategy
It has now risen to near the upper boundary of the 4-hour descending channel. A short-term rally is only possible after a breakout, leading to further rebound.
Considering the $5,000 rebound from $62,500, it is advisable to short near the upper boundary of this descending channel.
Bitcoin Trading Strategy:
Short around 67,700 with a stop loss of $700
Wait for a pullback after breaking above the upper boundary of the descending channel to go long
#比特币 #交易策略 $BTC $BTC
BTC2.95%
- Reward
- like
- 2
- Repost
- Share
GateUser-8949eb5d:
😄😄😄😄😄View More
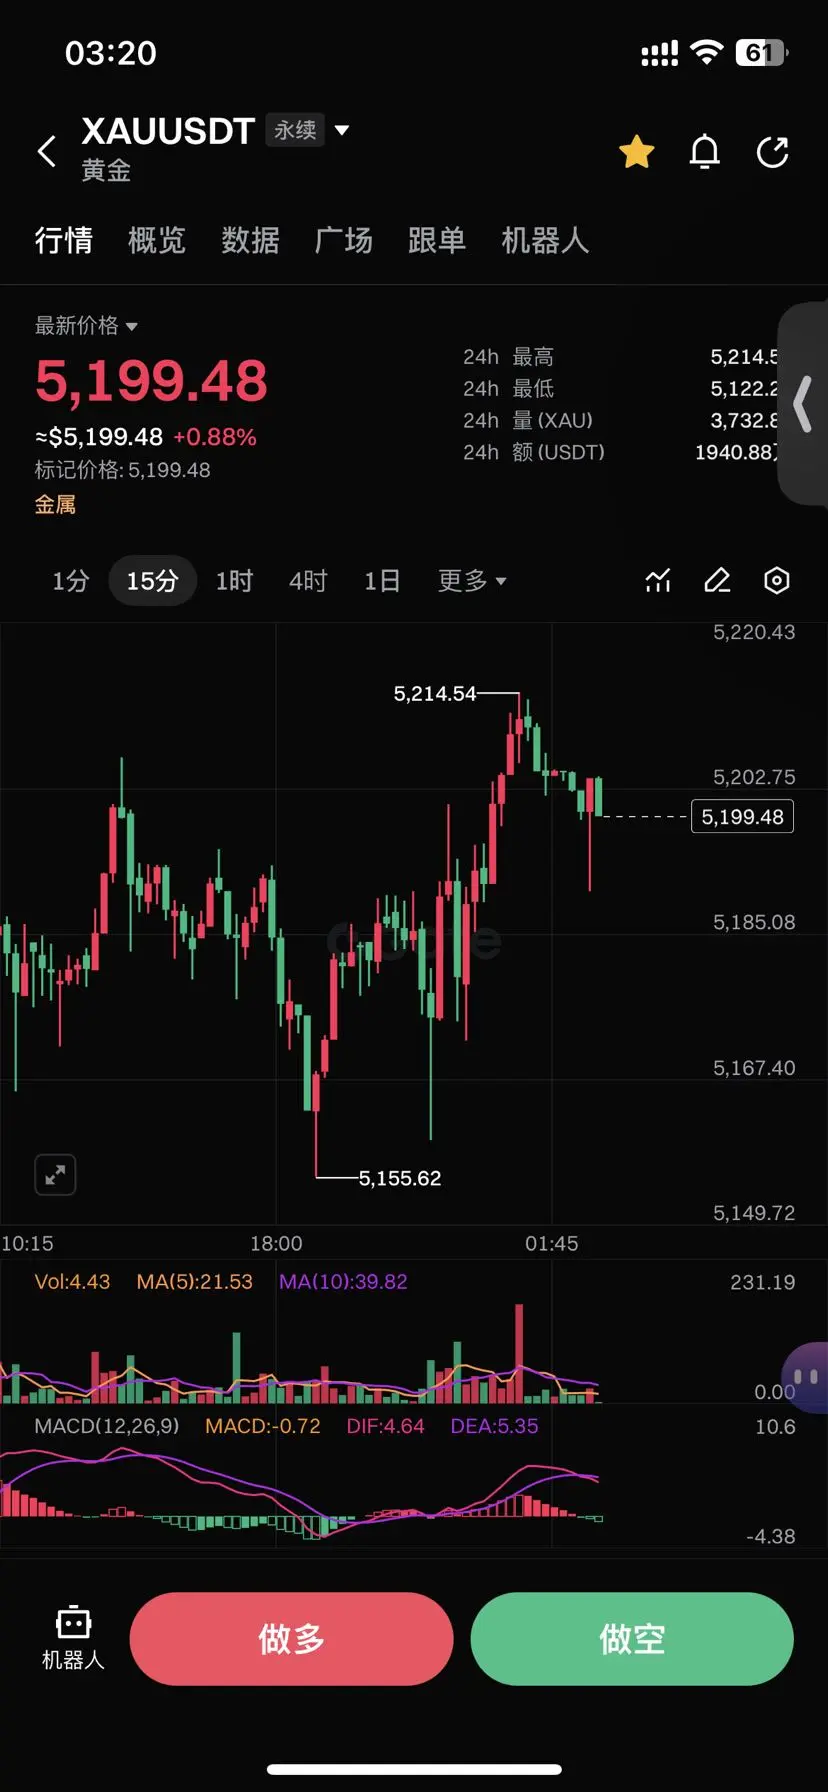
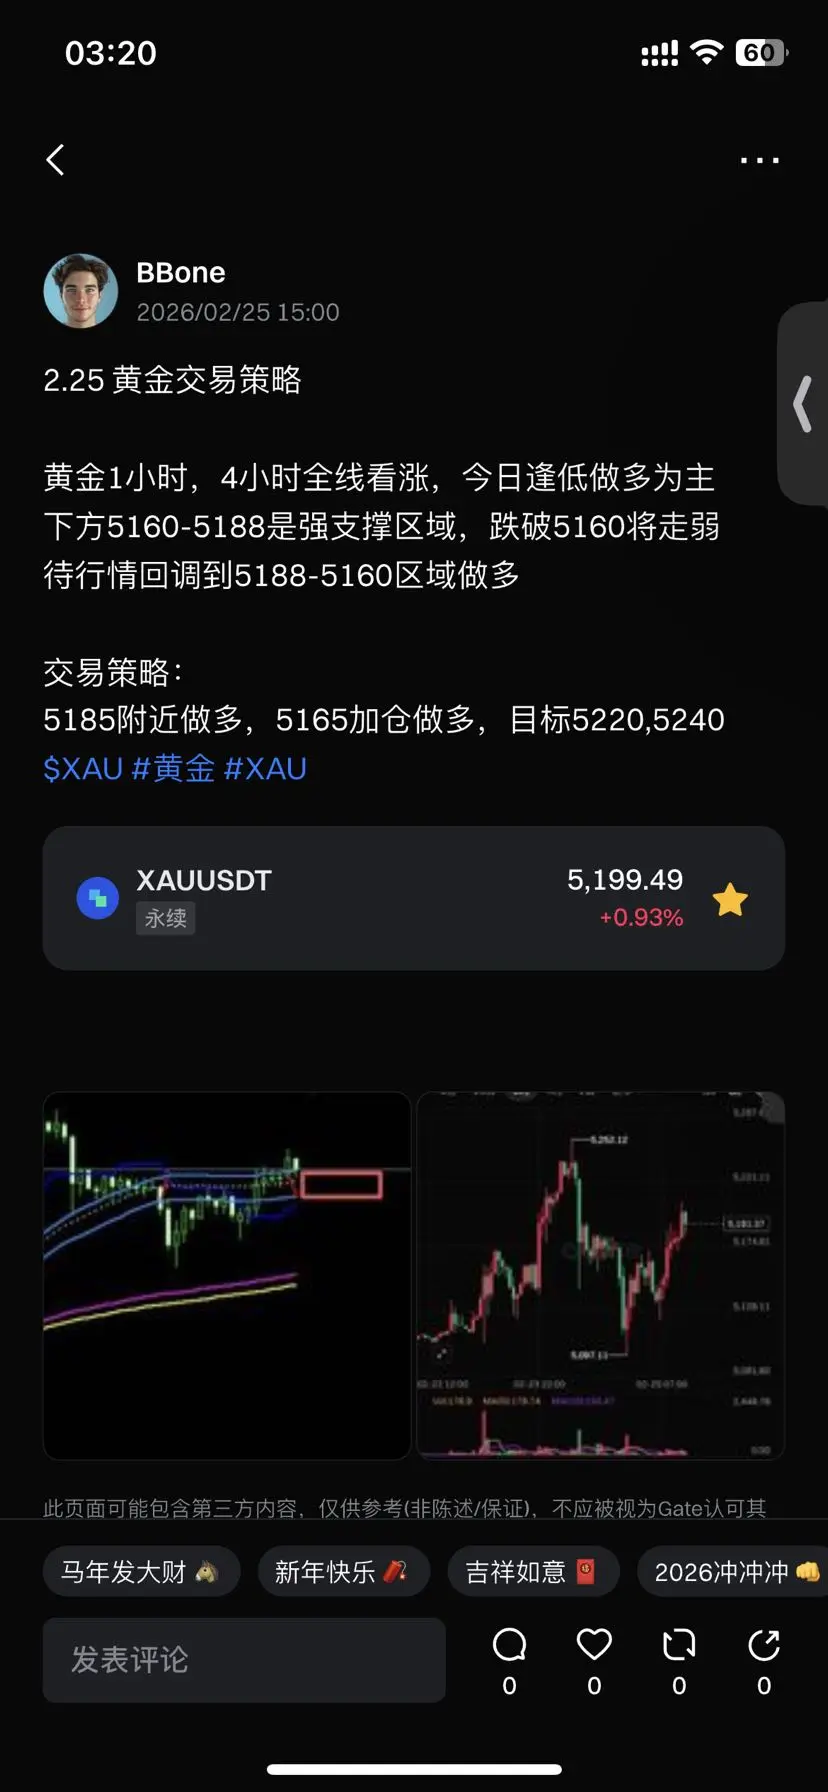
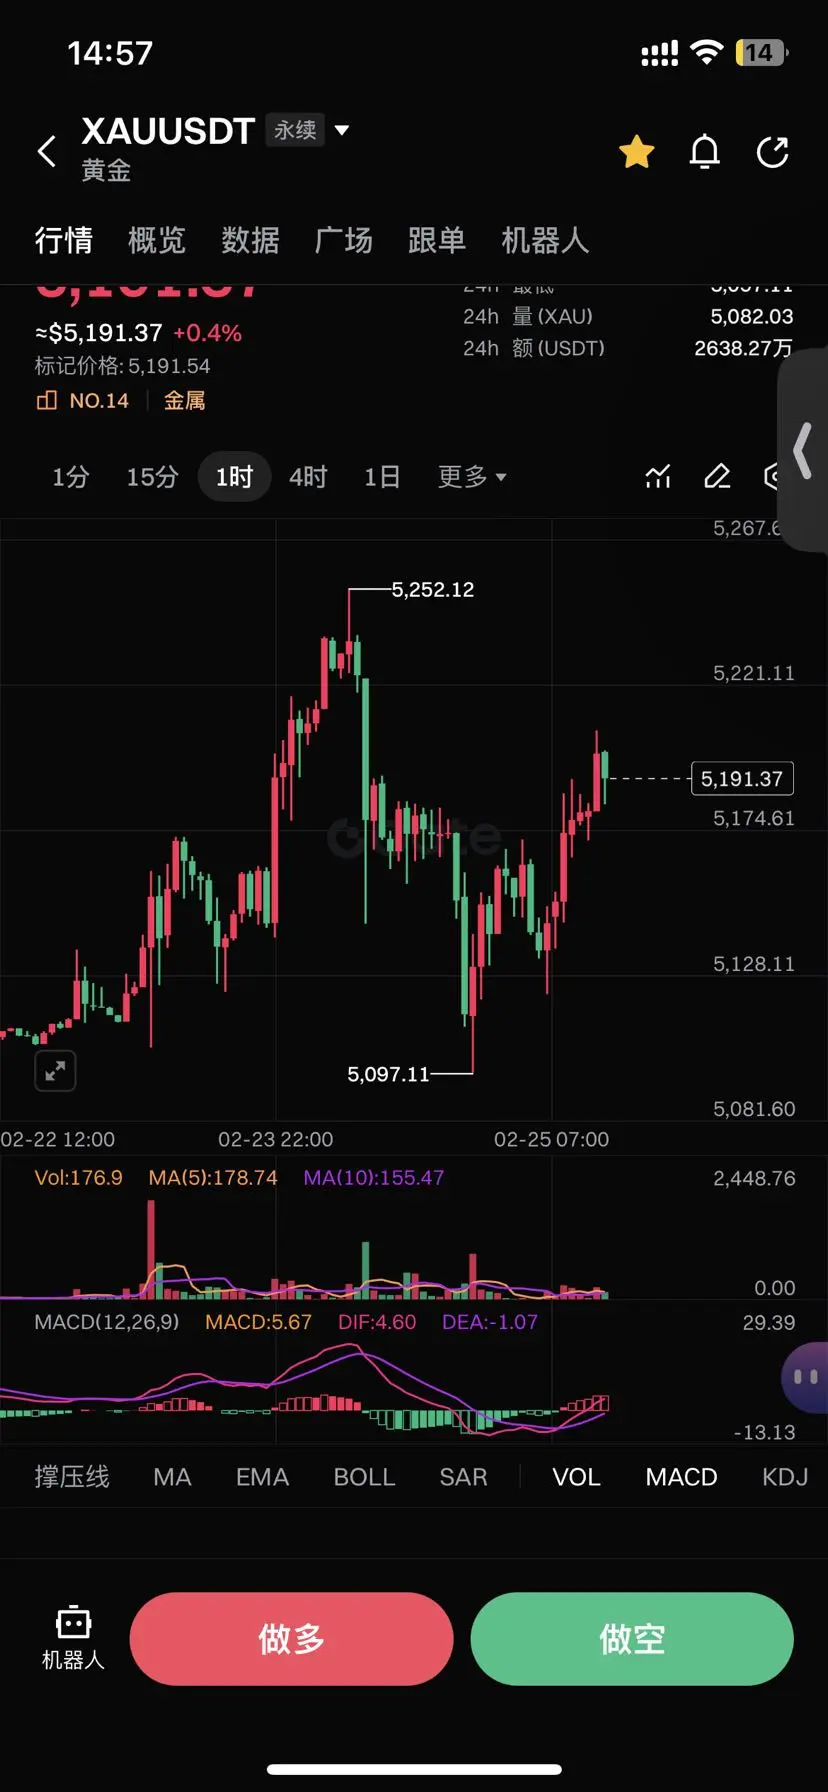
2.25 Gold Trading Strategy
Gold 1-hour and 4-hour charts are all bullish. Today, focus on buying the dips.
The strong support zone is between 5160-5188. A break below 5160 indicates weakness.
Wait for the market to retrace to the 5188-5160 area to go long.
Trading Strategy:
Go long around 5185, add positions at 5165, with targets at 5220 and 5240.
$XAU #黄金 #XAU
View Original
- Reward
- like
- Comment
- Repost
- Share
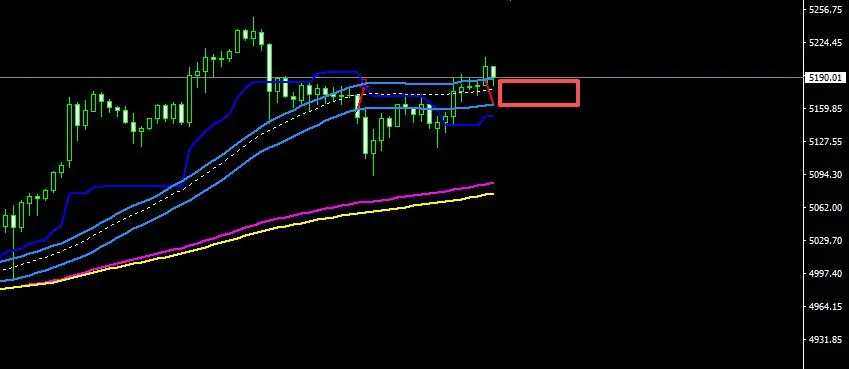
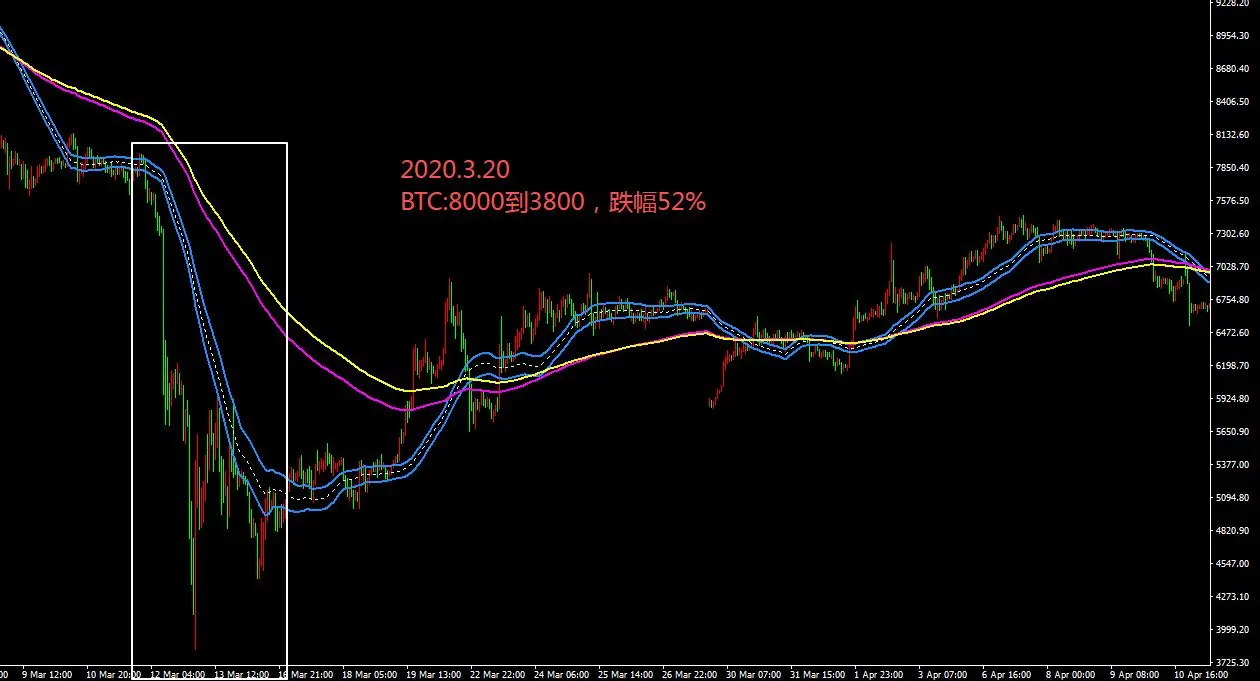
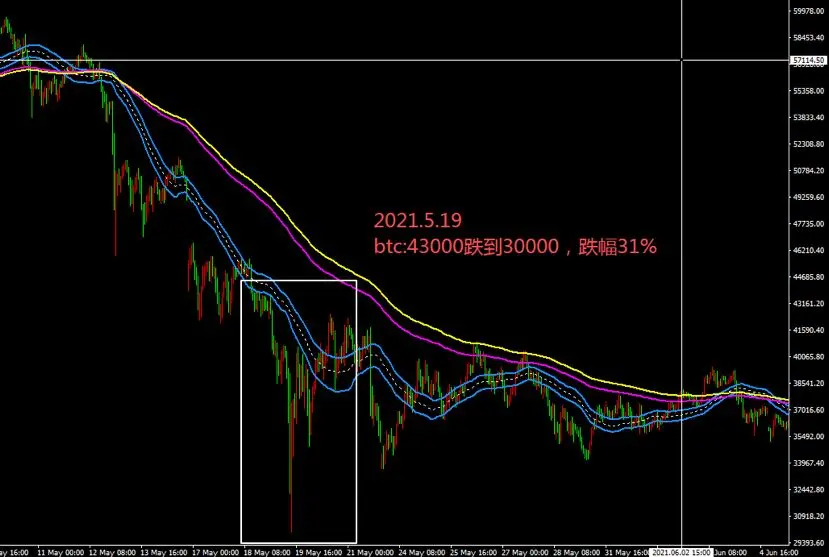
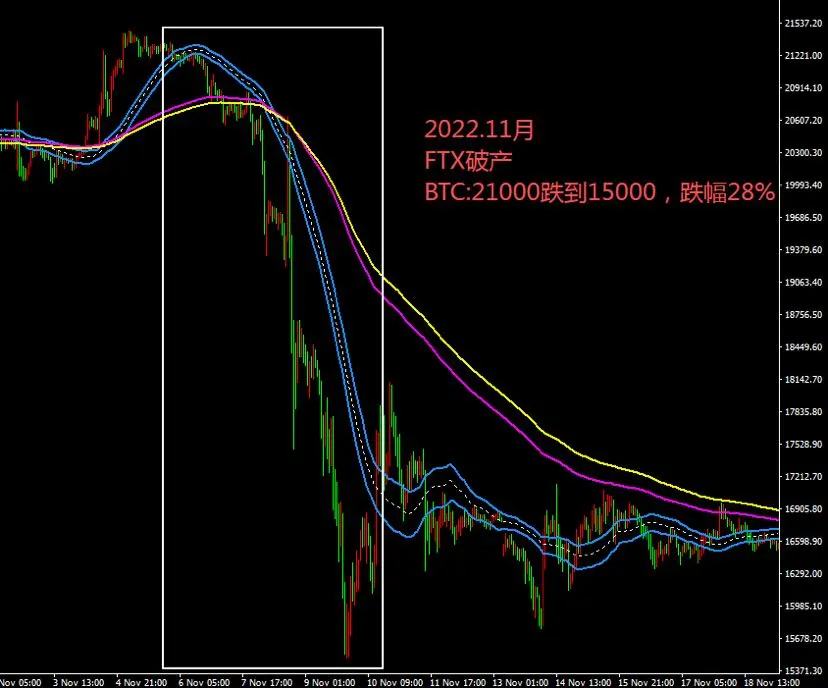
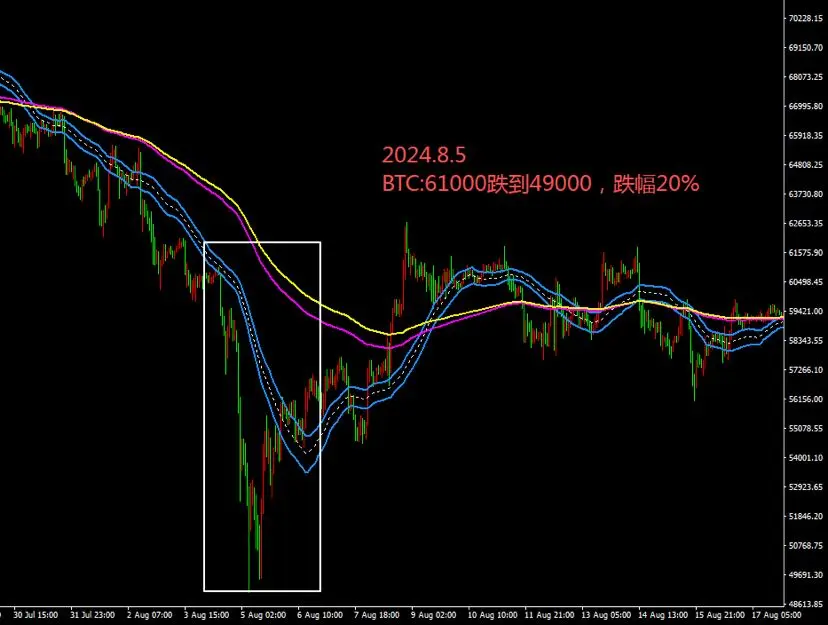
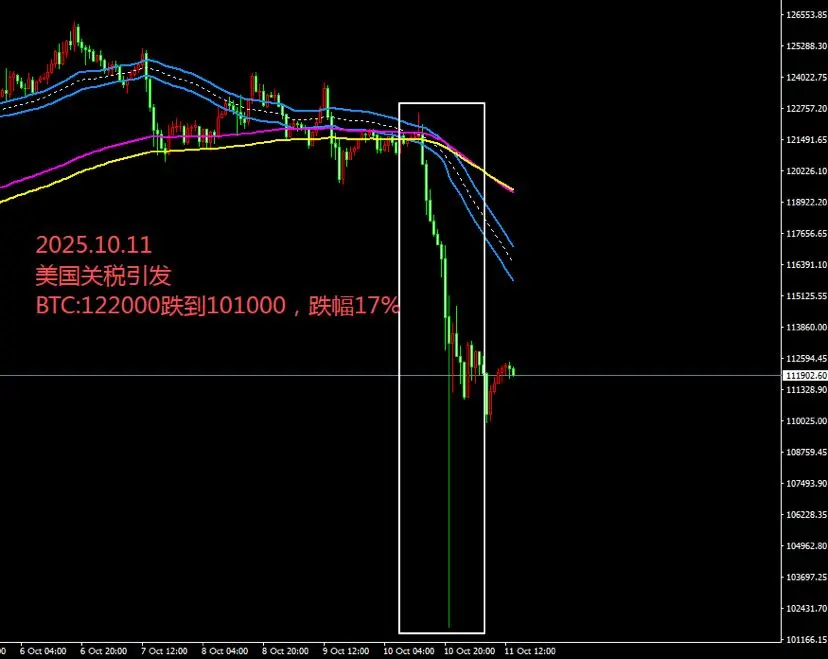
A set of self-developed indicators can help you avoid directional errors during black swan events.
Historical crash: 320, 519, 10.11, LUNA collapse, FTX bankruptcy all verified!
The blue indicator is regarded as Indicator 1, and the pink-yellow indicator is regarded as Indicator 2.
How to avoid directional errors?
1: For single-direction trading, it is necessary for Indicator 1 to cross Indicator 2 consistently.
2:😀 The price is below Indicator 1, bearish outlook, avoid going long.
😀Price is above indicator 1, bullish sentiment, avoid shorting.
This indicator is a gift to the top 10 frien
View OriginalHistorical crash: 320, 519, 10.11, LUNA collapse, FTX bankruptcy all verified!
The blue indicator is regarded as Indicator 1, and the pink-yellow indicator is regarded as Indicator 2.
How to avoid directional errors?
1: For single-direction trading, it is necessary for Indicator 1 to cross Indicator 2 consistently.
2:😀 The price is below Indicator 1, bearish outlook, avoid going long.
😀Price is above indicator 1, bullish sentiment, avoid shorting.
This indicator is a gift to the top 10 frien

- Reward
- like
- Comment
- Repost
- Share
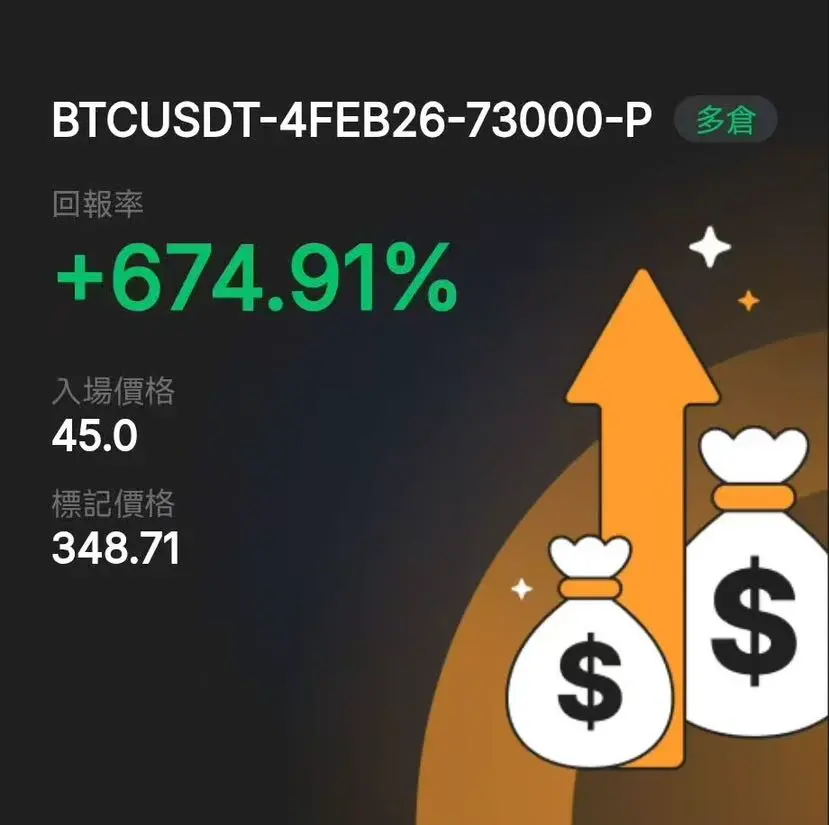
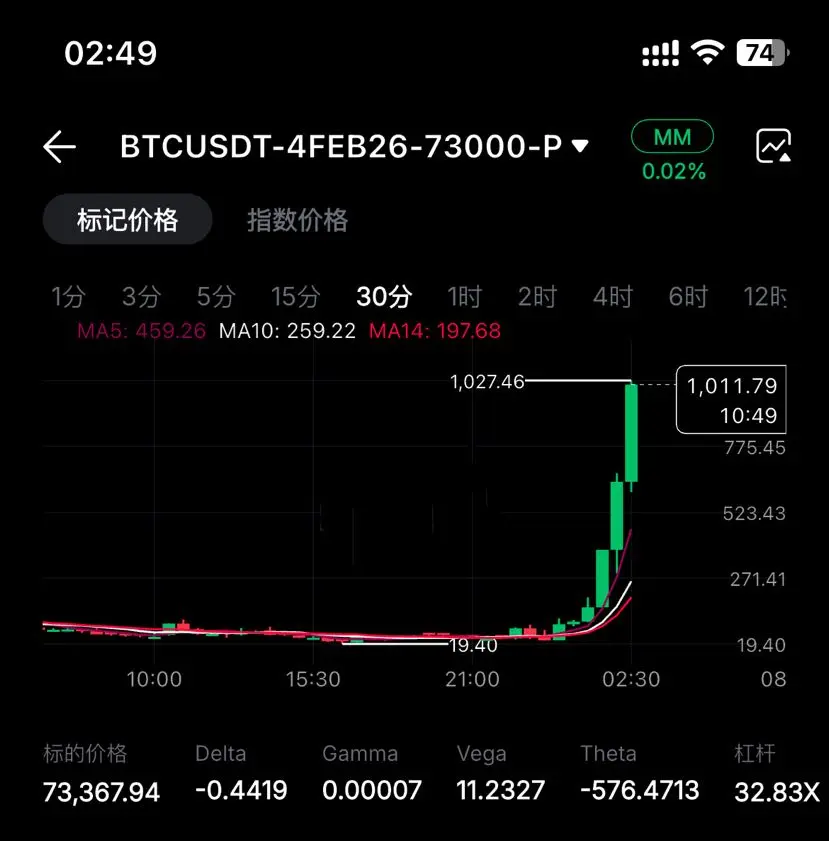
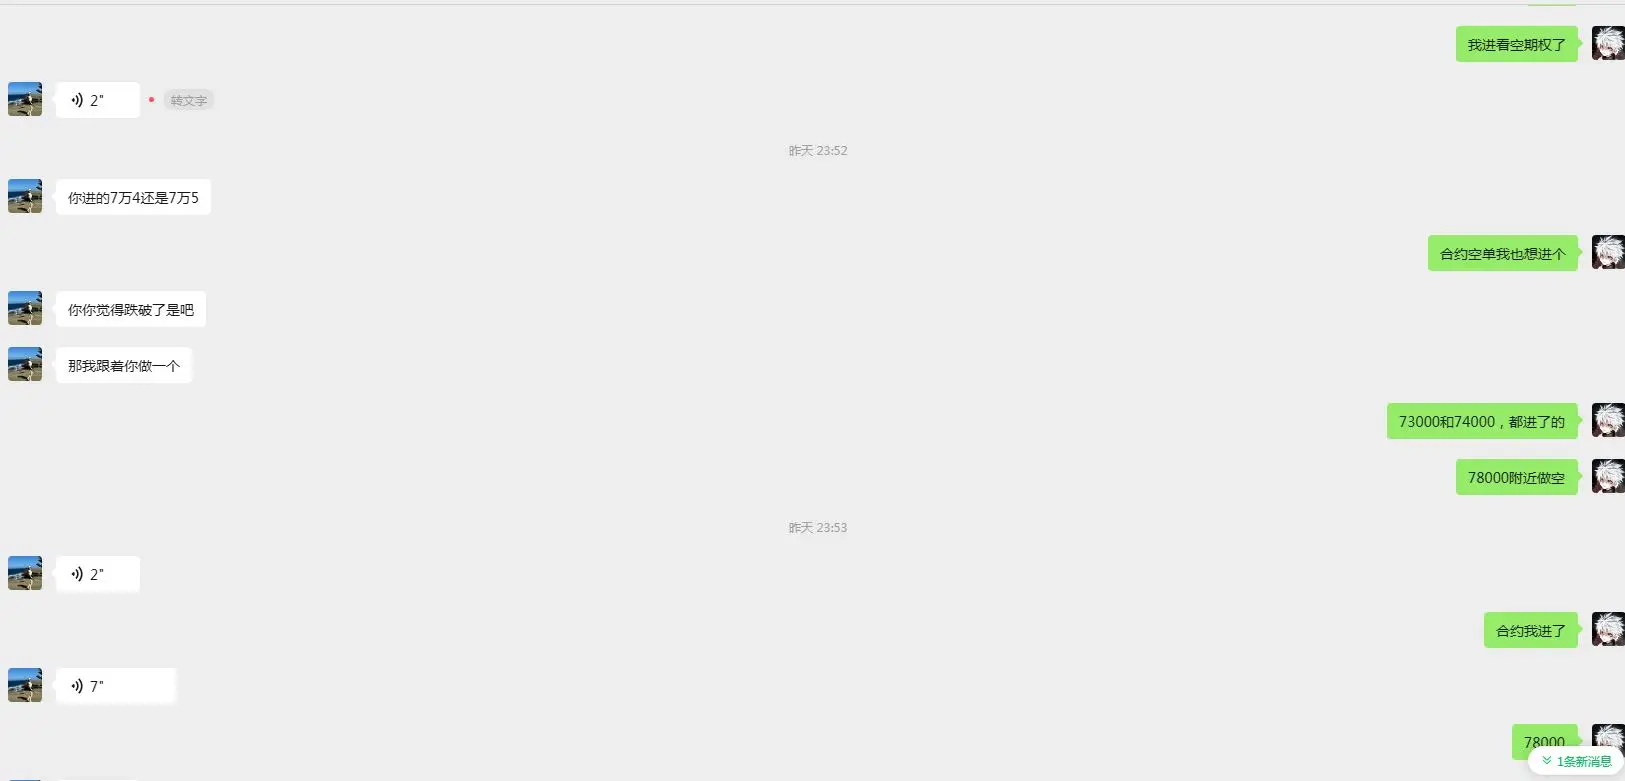
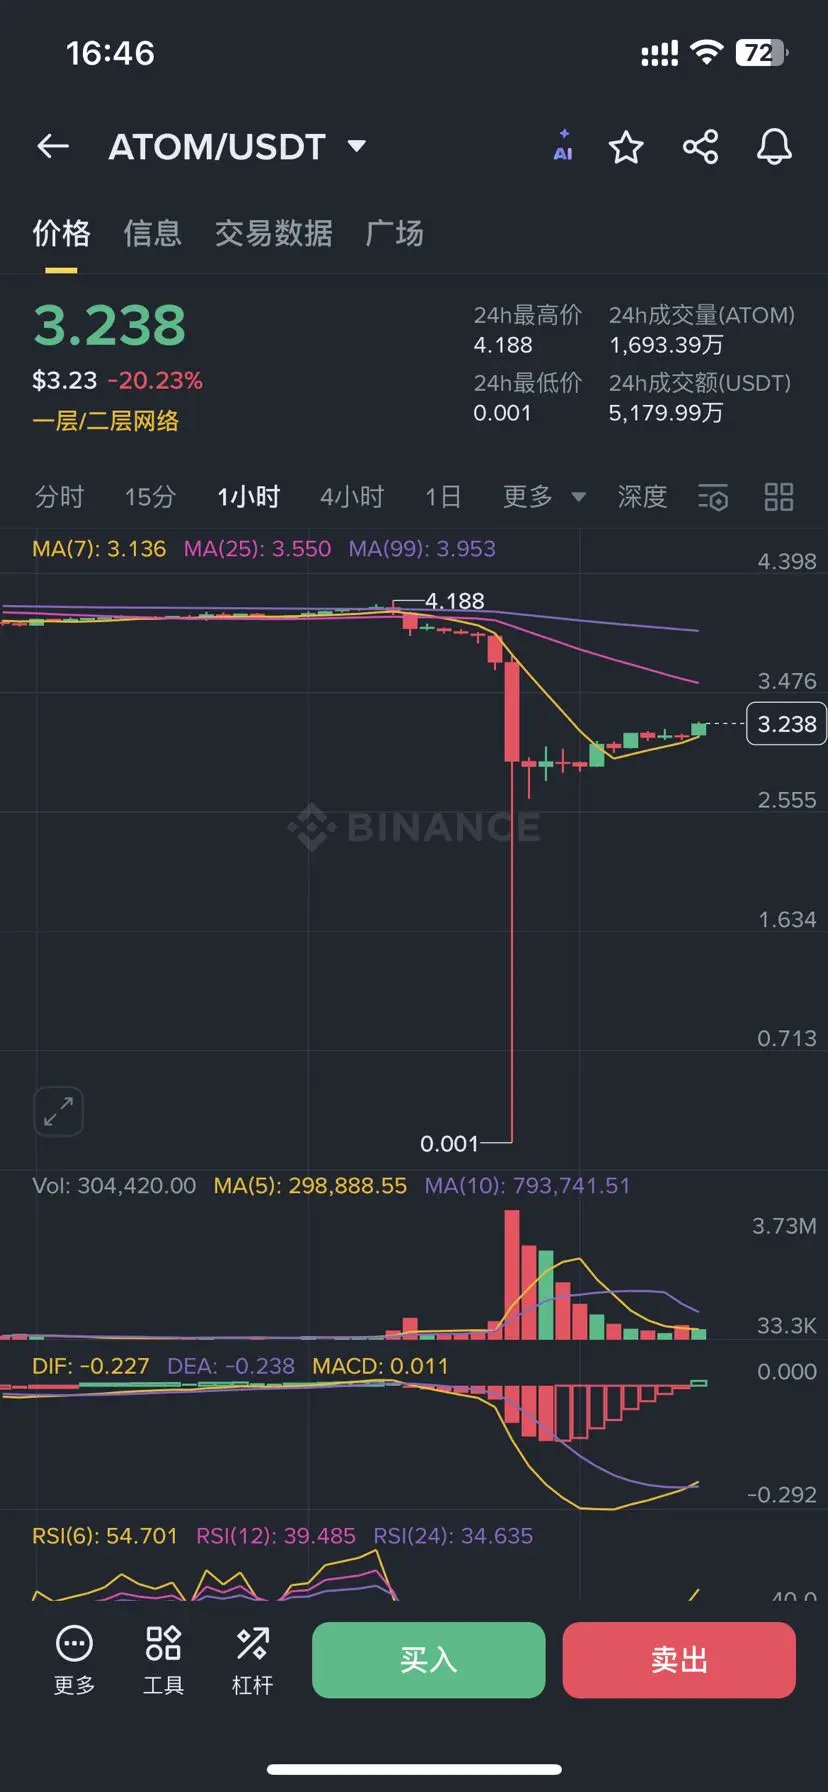
Opportunities for huge profits during black swan events! A crisis is an opportunity!
A rebound of 1000 times!
It feels like I've missed out on a billion.
I really want the black swan to come again quickly!
Opportunity Point:
1: Look for the largest drop during a crash
2: Latency Issues
3: It is said that at a certain moment, Coinbase was rising while Binance was falling.
(Research the details yourself)
View OriginalA rebound of 1000 times!
It feels like I've missed out on a billion.
I really want the black swan to come again quickly!
Opportunity Point:
1: Look for the largest drop during a crash
2: Latency Issues
3: It is said that at a certain moment, Coinbase was rising while Binance was falling.
(Research the details yourself)


- Reward
- like
- Comment
- Repost
- Share
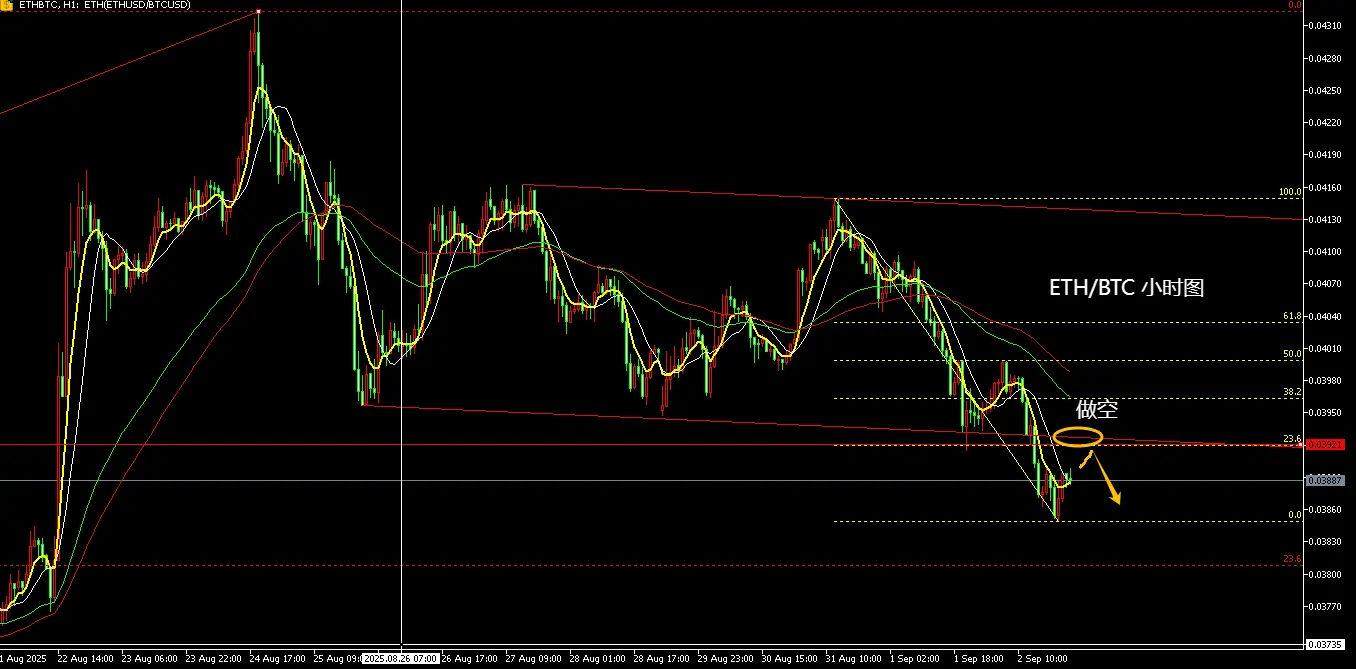
9.15 ETH strength and weakness threshold at the 4500 line
Today, ETH has tested the key support level at 4500. The previous key resistance level at 4500 has turned into a key support level. If it holds, the upward trend will continue; if it does not hold, it will enter a consolidation phase. The 4500 level is the recent dividing line for strength and weakness.
Operating Strategy:
ETH: Go long around 4500, stop loss at 4450
#美联储降息预期升温 #ETH
ETH5.41%
- Reward
- like
- Comment
- Repost
- Share
9.14 pullback后继续go long
A few days ago, Bitcoin and Ethereum both broke through key resistance levels and have resumed an upward trend. The pullback observed yesterday and today is seen as a correction to the recent upward movement. After the correction ends, they will continue to rise, so today we will continue to go long on the dips.
Trading Strategy
ETH: go long at 4500-20
(Aggressors go long near 4560, add long positions at 4500-20)
BTC: go long at 114000-114300
View OriginalA few days ago, Bitcoin and Ethereum both broke through key resistance levels and have resumed an upward trend. The pullback observed yesterday and today is seen as a correction to the recent upward movement. After the correction ends, they will continue to rise, so today we will continue to go long on the dips.
Trading Strategy
ETH: go long at 4500-20
(Aggressors go long near 4560, add long positions at 4500-20)
BTC: go long at 114000-114300
- Reward
- like
- Comment
- Repost
- Share
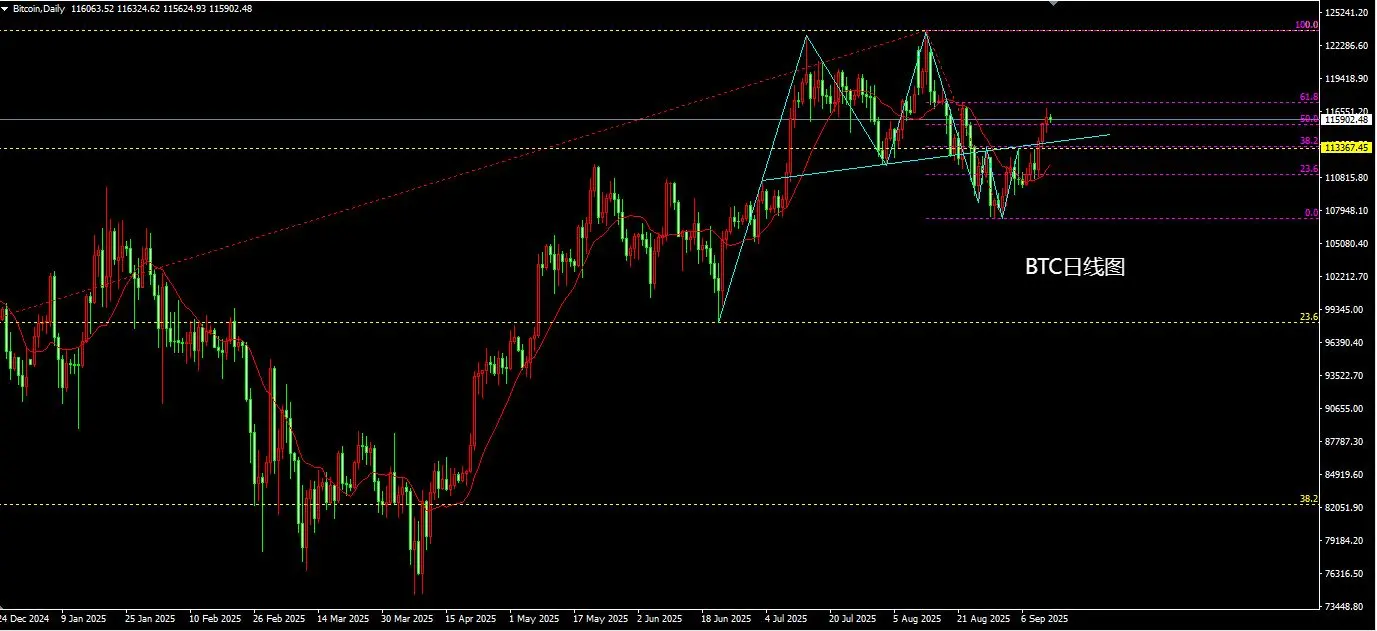
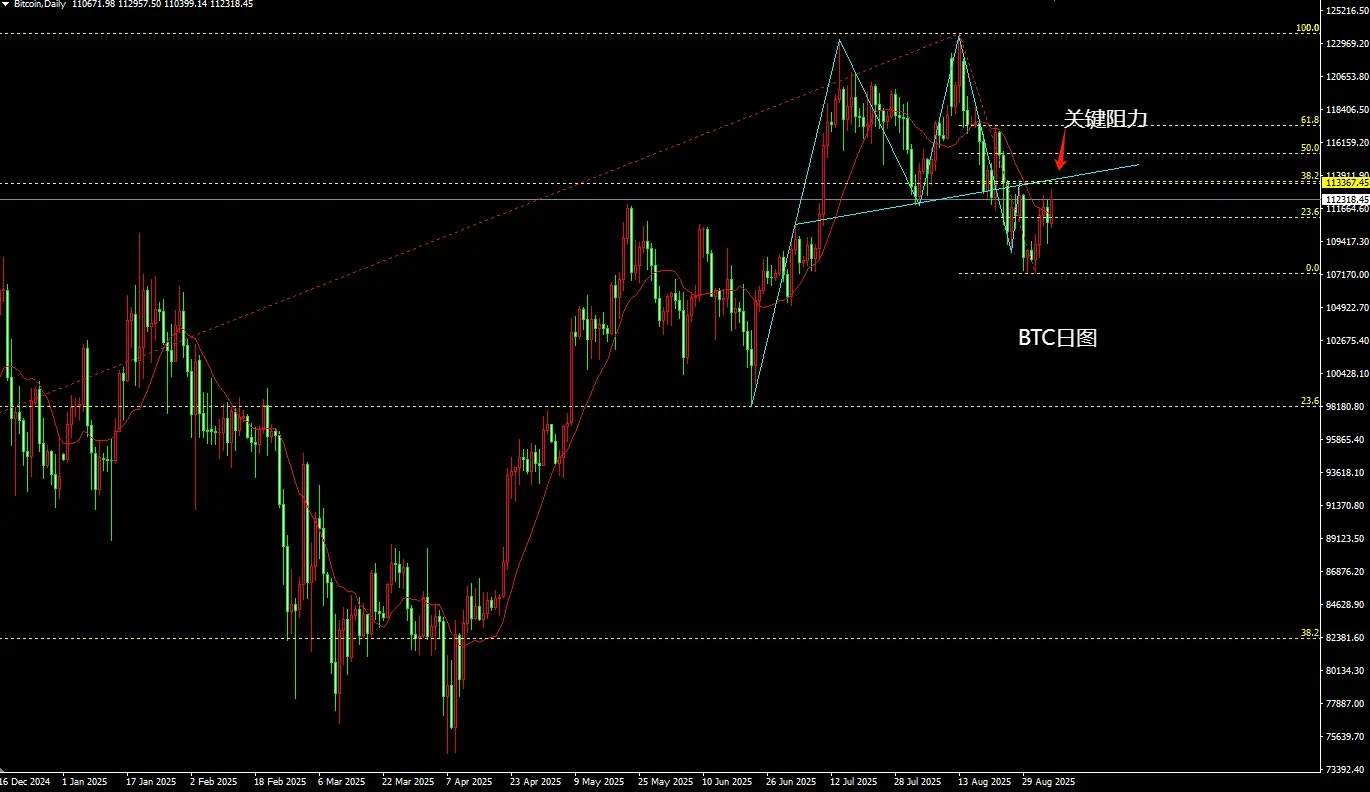
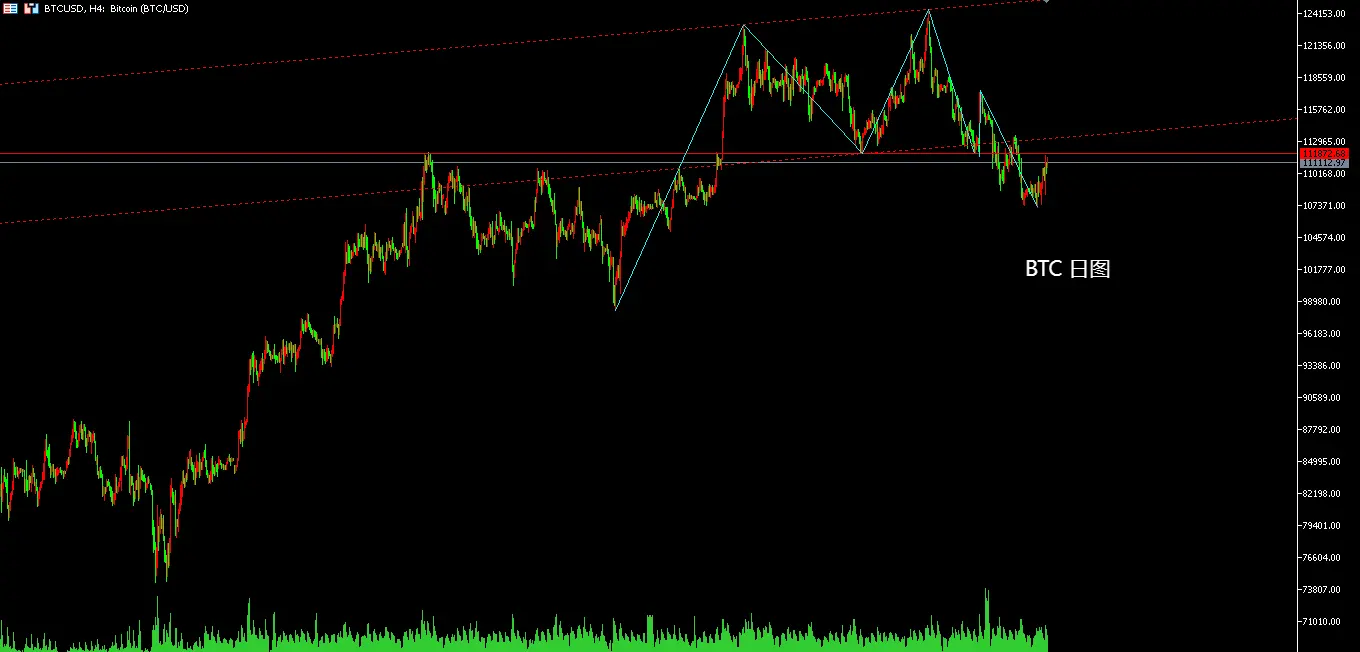
9.13 Bitcoin Ethereum pullback ends and resumes pump rhythm
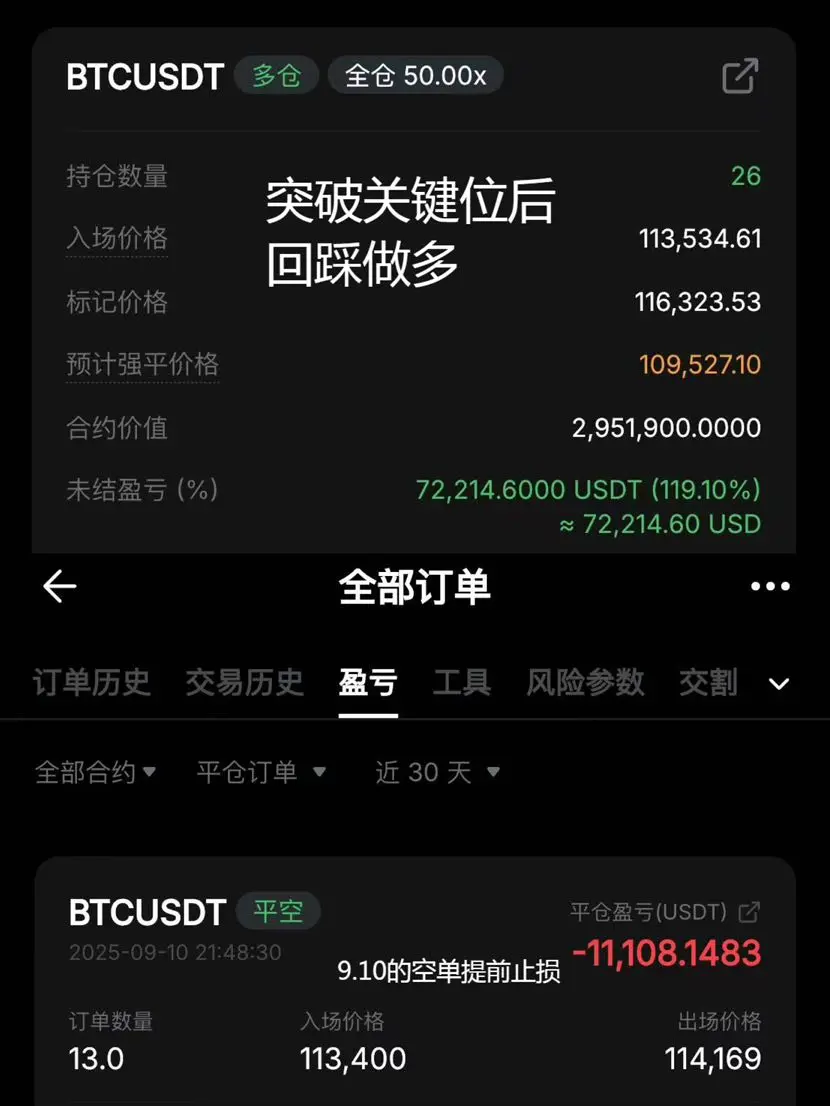
The short position on Bitcoin at 9.10 has been stopped out early (769 points), and I went long on the pullback.
The daily chart of Bitcoin has shown a long signal, and it has also broken through the previously mentioned key resistance level of 113200-113600. After the breakout, it has strengthened slightly, and restoring the upward momentum will challenge historical highs. As long as the price remains above 113600, the bullish outlook continues.
The daily chart of Ethereum shows a buy signal, having also broken through the key resista
View OriginalThe short position on Bitcoin at 9.10 has been stopped out early (769 points), and I went long on the pullback.
The daily chart of Bitcoin has shown a long signal, and it has also broken through the previously mentioned key resistance level of 113200-113600. After the breakout, it has strengthened slightly, and restoring the upward momentum will challenge historical highs. As long as the price remains above 113600, the bullish outlook continues.
The daily chart of Ethereum shows a buy signal, having also broken through the key resista


- Reward
- 15
- 12
- 2
- Share
Nferraro2214:
¡A tope! 🚀View More
9.10 trading strategy
Yesterday's BTC short trading strategy could profit 2500 points (1 point = 1 dollar spread)
Bitcoin and Ethereum have been oscillating at local low levels recently, awaiting a breakout. It is estimated that a direction will emerge this week.
Key resistance for BTC is 113200-113600. If it doesn't break, we maintain a bearish outlook. A breakthrough will strengthen the short term.
The key resistance for ETH is at the 4500 line. After breaking through, it will strengthen in the short term, the adjustment will end and it will resume the upward trend, overall stronger
BTC2.95%
- Reward
- like
- Comment
- Repost
- Share
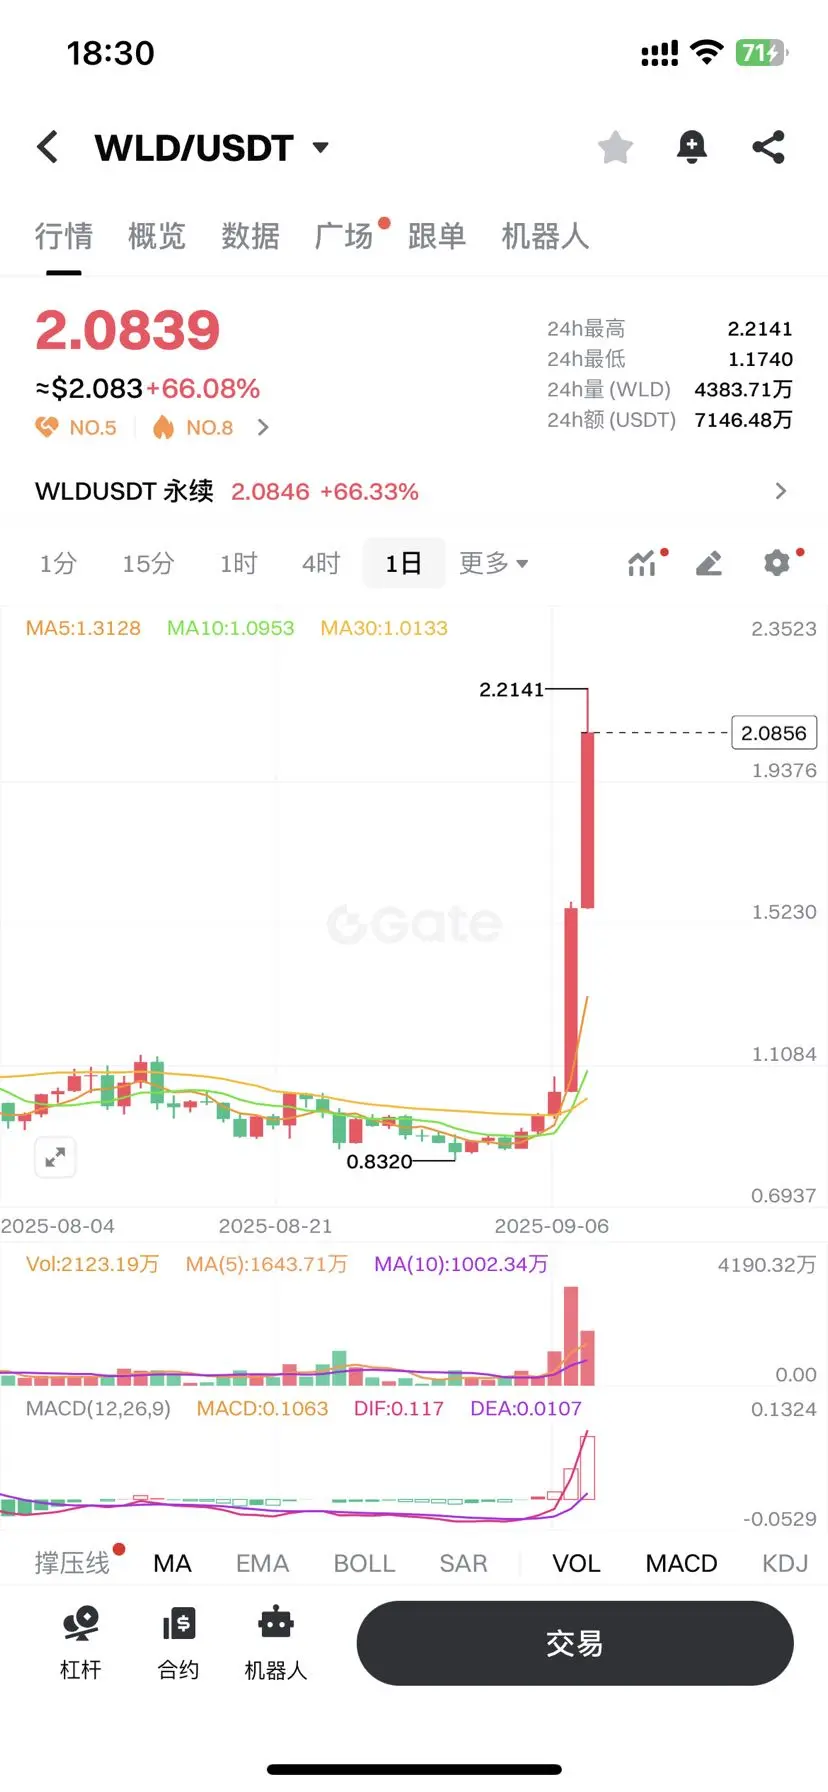
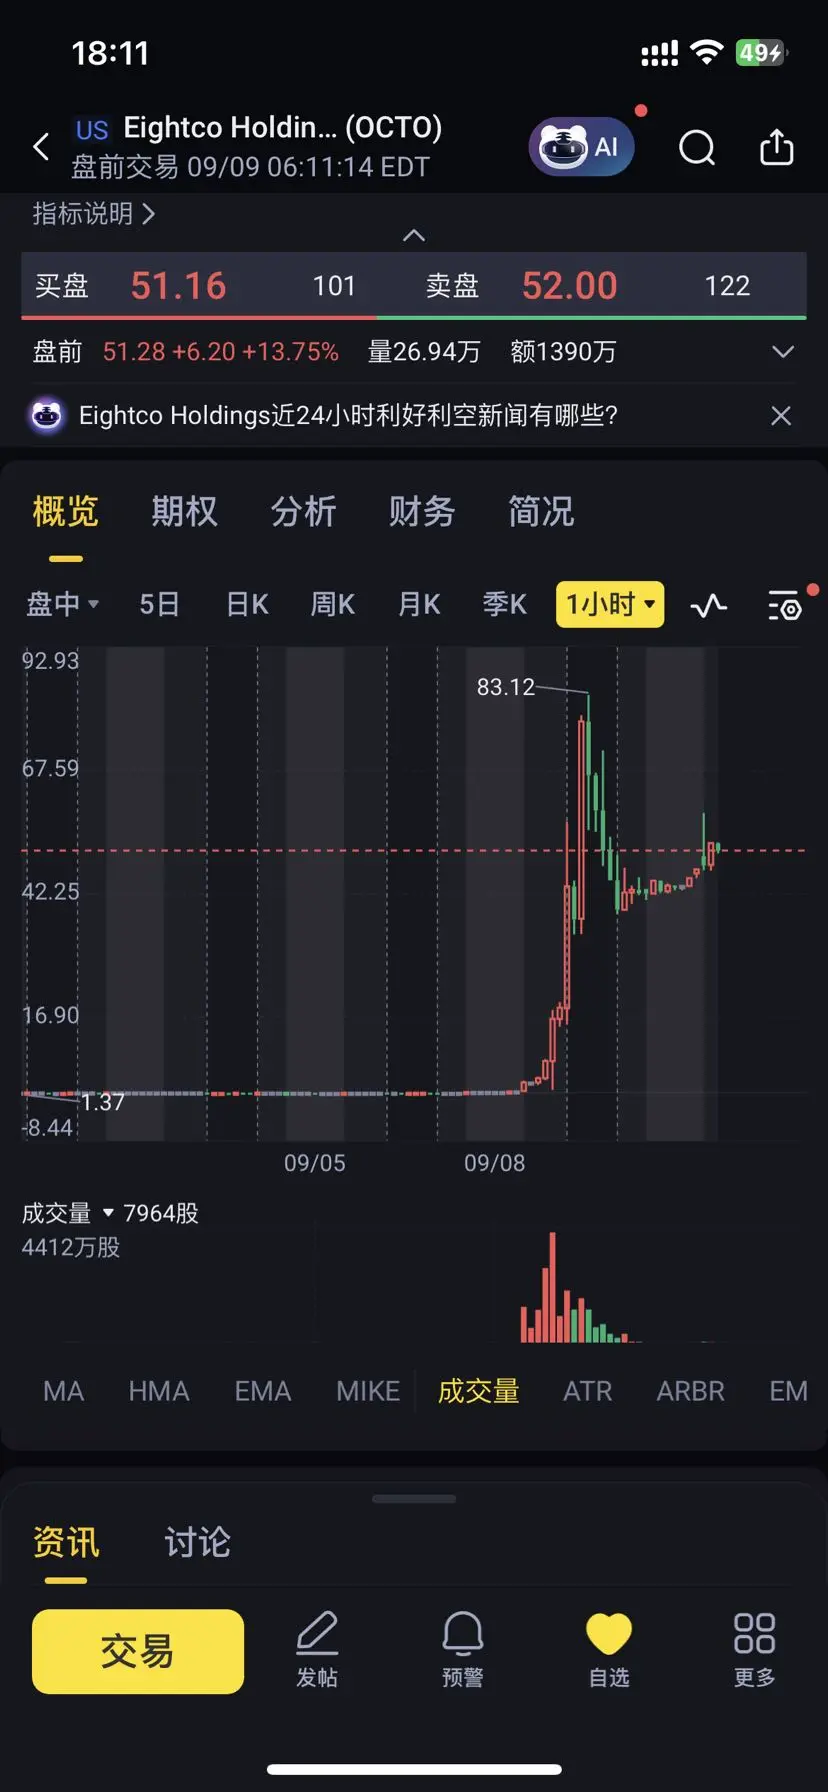
$WLD big pump, stocks rise 50 times!
This will not be the last company to imitate "MicroStrategy".
Who will be the next selected coin, and who will be the next company to be "backdoor listed"?
Potential characteristics of a company that can transform into a cryptocurrency treasury include:
1. The market capitalization is small and there is a strong demand for business transformation.
2. Companies with ample cash or strong financing capabilities.
3. Companies associated with blockchain/cryptocurrency-related businesses
BTC, ETH, GOG E, SOL, BNB, WLD
Who will the next token be?
WLD0.99%


- Reward
- like
- Comment
- Repost
- Share
9.5 Will the Non-Farm Payrolls Guide the Short-Term Direction? (Potential Swing Trading Opportunity)
The highly anticipated non-farm data will be released tonight at 20:30.
The market generally expects a rate cut in September regardless of the non-farm data, with the debate being whether to cut by 25 or 50 basis points.
On August 22, the speech by the Federal Reserve Chairman hinted at the possibility of interest rate cuts, which may be intended to prepare the market in advance and reduce the impact on the market when the rate cuts arrive.
Poor non-farm data and interest rate cuts in September
View OriginalThe highly anticipated non-farm data will be released tonight at 20:30.
The market generally expects a rate cut in September regardless of the non-farm data, with the debate being whether to cut by 25 or 50 basis points.
On August 22, the speech by the Federal Reserve Chairman hinted at the possibility of interest rate cuts, which may be intended to prepare the market in advance and reduce the impact on the market when the rate cuts arrive.
Poor non-farm data and interest rate cuts in September

- Reward
- like
- Comment
- Repost
- Share
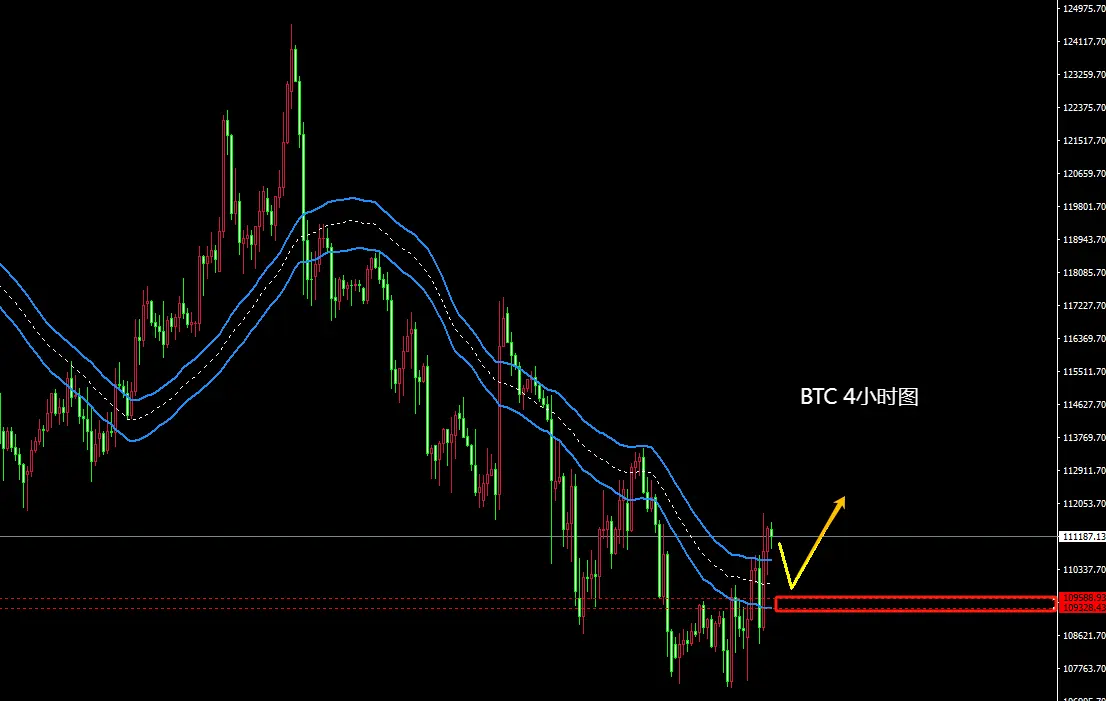
9.3 Evening Trading Strategy
The morning strategy for BTC short positions can gain 1200-1500 points (1 point = 1 USD price difference)
As expected in the morning, BTC is stronger than ETH, showing signs of stabilization around 110200 during the day.
The BTC hourly and 4-hour charts continue to show a bullish arrangement.
Intraday resistance at 111800, 113000, and further strength after breaking 111900.
The important intraday support range is 109300-110500; falling below 109300 will indicate a weakening.
$BTC Evening Trading Strategy:
1: Aggressors go long near 110200
Pay attention to whether t
BTC2.95%
- Reward
- like
- Comment
- Repost
- Share
9.3 Trading Strategy
BTC will be stronger than ETH during the day.
BTC bullish alignment on hourly and 4-hour charts
Intraday resistance at 11800, 113300-500,
The important intraday support zone is 109300-110500. Falling below 109300 will indicate a weakening.
Today's trading strategy:
$BTC: If it goes up first, short at 111700-111850, target 11100-111600, stop loss 12300. Don't be greedy with this short position, enter and exit quickly. Consider going long after stabilizing above 111900.
$BTC: Long at 109300-109600, target 111700, 112800, stop loss 108500
Given that BTC is stronger th
BTC2.95%
- Reward
- 4
- 1
- Repost
- Share
BBone:
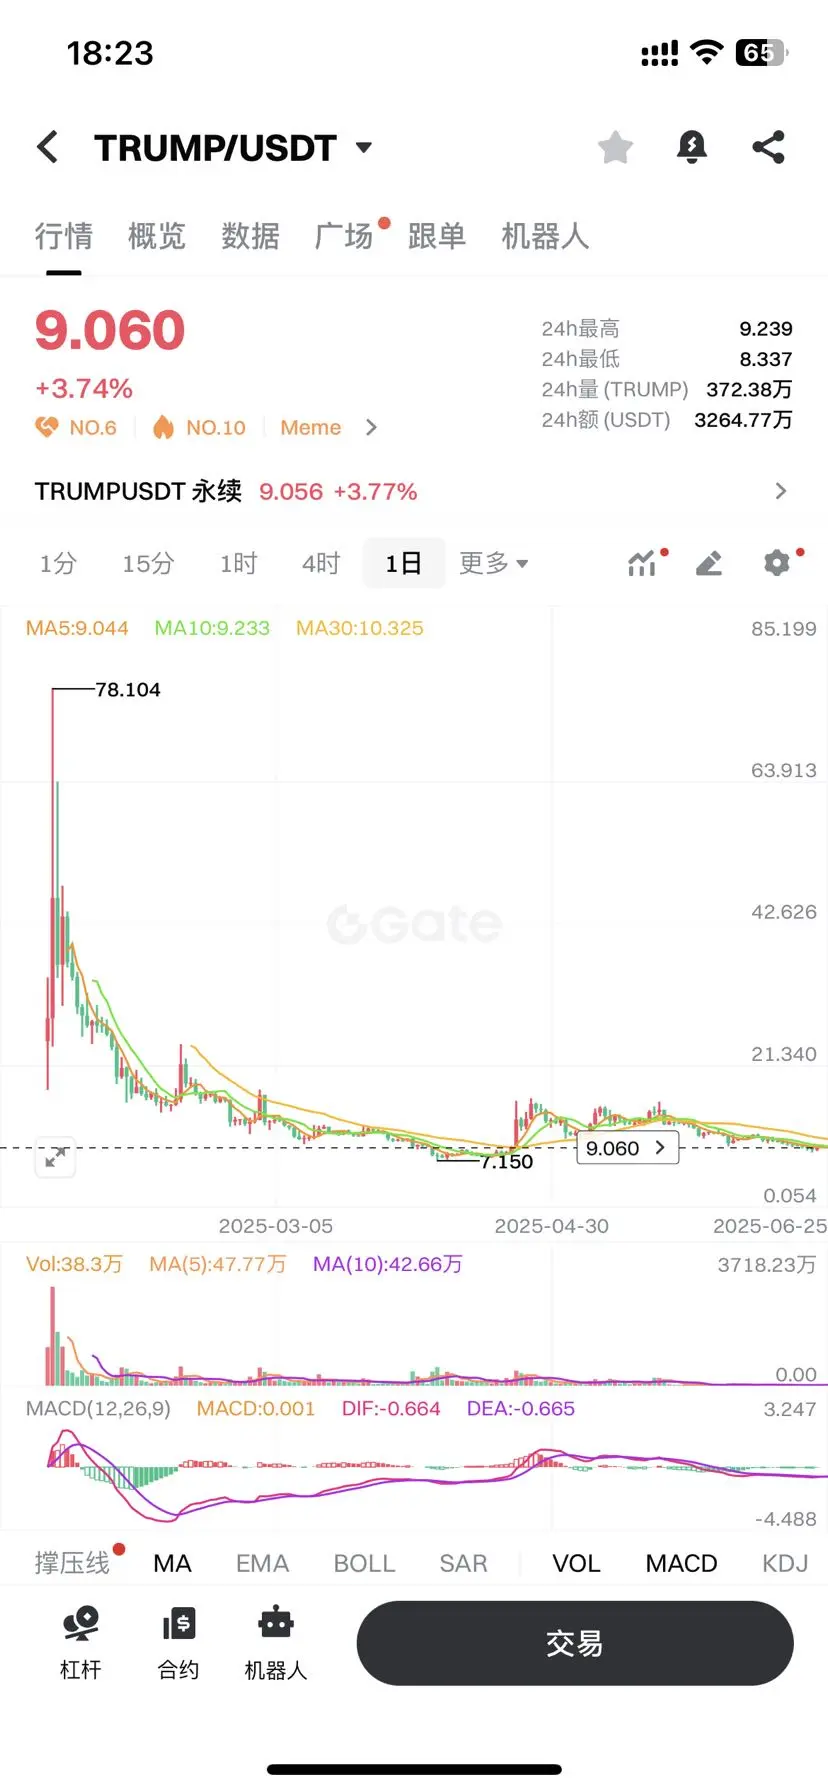
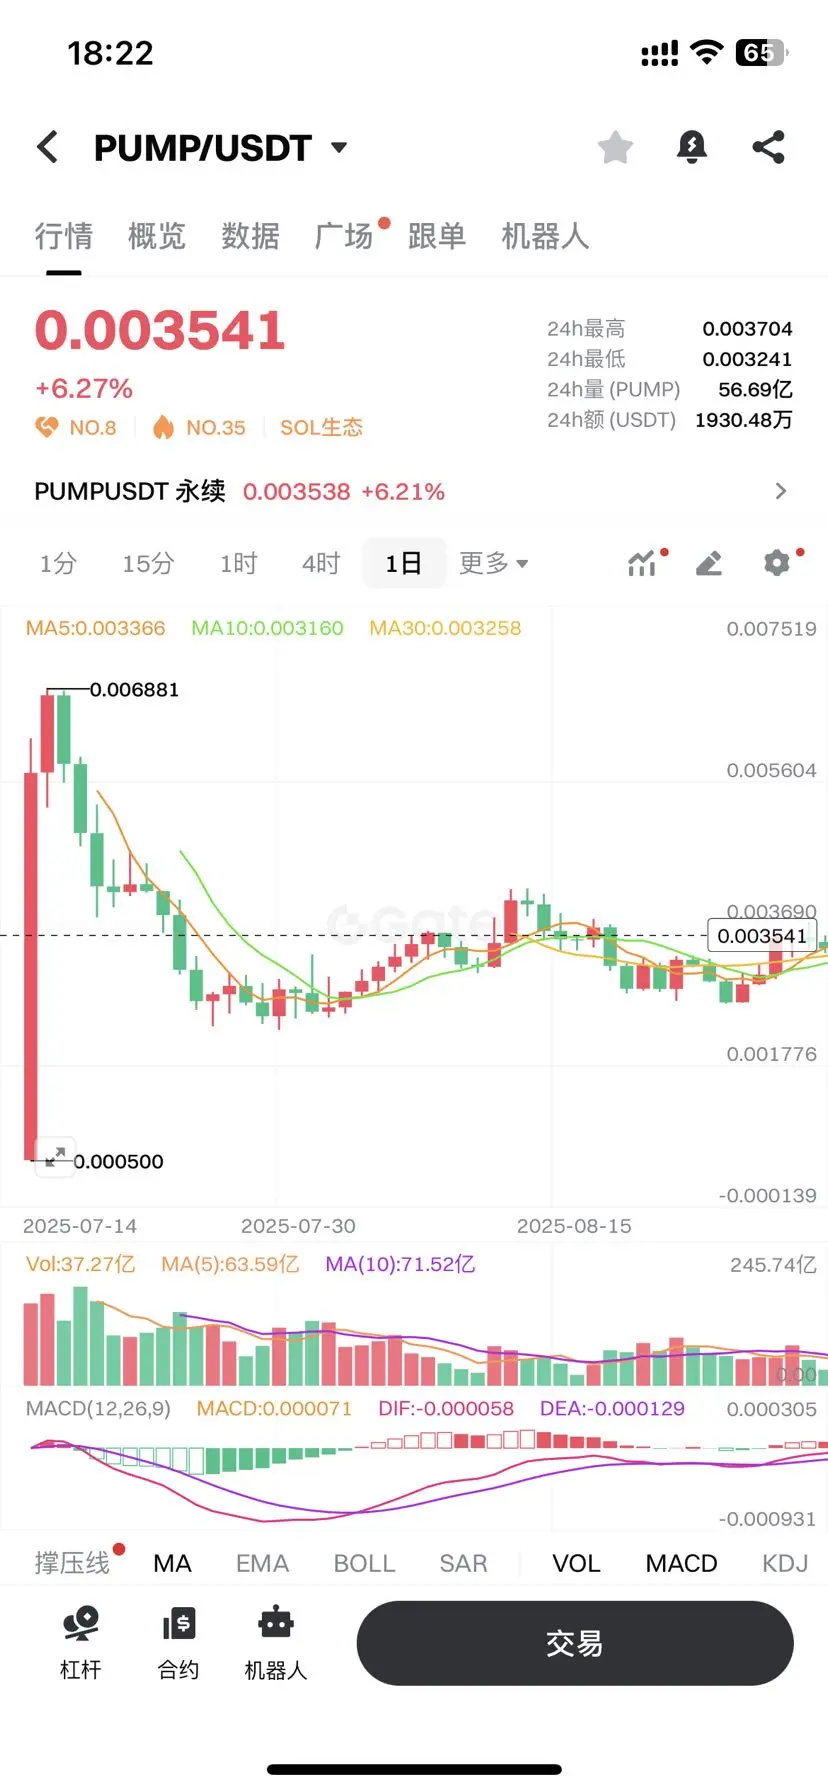
Typing error in the short order target, the short order target should be 110100-110600What is the trend of $WLFI tonight?
Will it rise sharply like $TRUMP and then continue to fall, or will it rise sharply like $PUMP and then drop back and fluctuate at a low level?
Everyone can vote.
Or express your views on the trend in the comment section.
#WLF #今日你看涨还是看跌?
View OriginalWill it rise sharply like $TRUMP and then continue to fall, or will it rise sharply like $PUMP and then drop back and fluctuate at a low level?
Everyone can vote.
Or express your views on the trend in the comment section.
#WLF #今日你看涨还是看跌?

How will the WLFI trend?
After rising sharply, it has been falling continuously 📉
31
31
After reaching a high and then falling back, there is low-level volatility.
9
9
pump📈
21
21
Others
2
2
63 ParticipantsVoting Finished
- Reward
- 1
- Comment
- Repost
- Share