What Is Coin Ranking?
Coin ranking is a list that orders crypto assets based on measurable criteria, with common factors including market capitalization, trading volume, and price change percentages. Think of it as a map that helps you quickly identify the largest and most actively traded assets among thousands of cryptocurrencies.
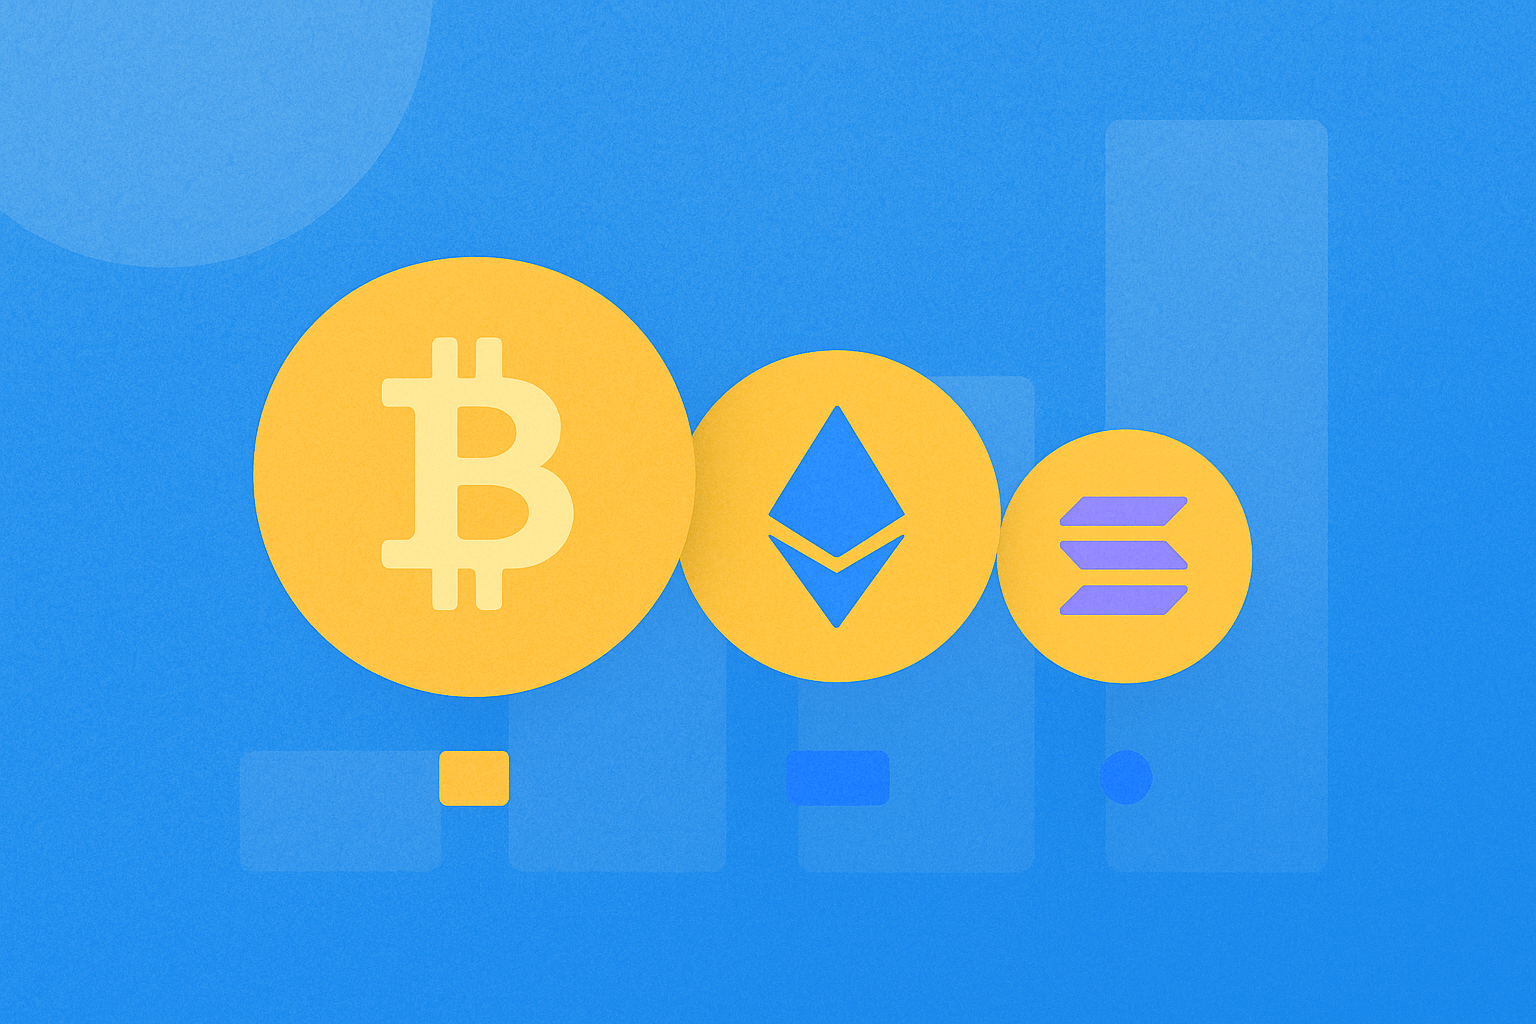
Typically, sorting by market capitalization provides an overview of a coin’s relative “size” within the broader market, while trading volume indicates current trading activity, and price change rankings reflect short-term sentiment and volatility. Over the long term, Bitcoin and Ethereum usually lead the market cap rankings due to their widespread usage and scale, though their exact positions can shift as market conditions change.
Why Does Coin Ranking Matter?
Coin ranking matters because it reduces the effort required for asset selection and lowers execution risk. Coins with high market capitalization and substantial trading volume often provide deeper order books and lower slippage.
For beginners, rankings make it easy to filter out illiquid coins, minimizing scenarios where orders fail to execute or experience significant price deviation. On trading platforms like Gate, rankings are also linked to trending market sectors, helping you identify assets with heightened attention for further research or watchlist addition.
How Are Market Cap and Trading Volume Calculated in Coin Rankings?
Market capitalization is calculated as price multiplied by circulating supply. It represents the total value the market assigns to the circulating portion of a coin. For example, a coin priced at $10 with 100 million tokens in circulation would have a market cap of approximately $1 billion.
Trading volume refers to the total transaction value within a given time window—most commonly the 24-hour volume—which measures recent buying and selling activity. Higher activity usually means it's easier to trade near the current market price.
Liquidity describes the actual depth and speed of transactions—essentially, how “thick” the order book is. Even a large market cap can be paired with a thin order book, leading to poor trading experiences. Therefore, when evaluating rankings, consider both trading volume and order book depth.
FDV (Fully Diluted Valuation) is calculated as price multiplied by total token supply, estimating the project’s valuation if all tokens were released. If circulating supply is low but FDV is high, future token unlocks could create selling pressure, affecting both ranking stability and risk assessment.
Coin rankings can vary across platforms due to differences in data sources and calculation methods. Aggregator websites typically consolidate data from multiple exchanges, using weighted averages for price and volume calculations; exchange-specific rankings rely on their own trading pairs and real-time trade data.
Refresh intervals differ as well. Some rankings update every second, others every minute or at longer intervals. Default sorting may also vary: some platforms rank by market cap by default, while others prioritize 24-hour volume or price change.
Other factors include whether stablecoins are included, whether cross-chain versions and contract addresses are merged, and whether outlier trades (such as wash trading) are excluded—all of which can affect rankings. Always review the platform’s methodology or help pages for clarity when interpreting rankings.
How to Read Coin Rankings: Key Signals to Watch
To analyze coin rankings, assess the combination of size, activity, and volatility, then conduct further validation. A common approach is as follows:
- Start with market cap tiers. The top-ranked coins represent core market assets; as you move down the list, coins tend to be smaller with higher volatility and risk.
- Next, examine 24-hour trading volume and its share of overall volume. Higher concentration suggests more active markets and easier order execution—though be wary of sudden spikes that may signal abnormal activity.
- Check price change percentages over different periods (e.g., 24 hours vs. 7 days). Differences reveal short- and medium-term sentiment; coins consistently in the top ranks merit closer tracking.
- Review liquidity and order book depth. Evaluate bid/ask depth and spreads to avoid slippage or unexecuted trades due to thin order books.
- Cross-reference with news and on-chain activity. Major upgrades, unlock schedules, or regulatory developments can impact both rankings and volatility—use news alongside data for confirmation.
Where to View and Manage Coin Rankings on Gate?
On Gate, you can easily view coin rankings through market data and filtering tools with multiple sorting options.
- Go to the Gate website or app and enter the “Markets” section. In the spot markets tab, select “All” or a specific sector.
- Switch sorting criteria as needed: sort by “Market Cap” for size distribution, by “24h Volume” for activity levels, or by “Price Change” for short-term momentum.
- Use filters and search tools: filter by trading pair, stablecoin denomination, price change range, or search for specific coins to add to your watchlist.
- Visit individual coin detail pages to see order book depth, recent trades, announcements, supply data, and unlock information—helpful for assessing liquidity and potential supply pressure.
You can also set price alerts and risk control lines on Gate, connecting ranking analysis directly with trade execution and reducing the need for constant monitoring.
Common Misconceptions and Risks in Coin Rankings
One common misconception is that “higher rank means safer.” High market cap only means larger size—it does not eliminate volatility or event risks; fundamental analysis and regulatory compliance still matter.
Another misconception is “more volume is always better.” Some coins may have inflated trading volumes or wash trading; longer-term trends and order book depth are more reliable indicators.
A third misconception is ignoring FDV and token unlock schedules. Coins with low circulating supply but high FDV may face significant supply increases that distort rankings temporarily.
For asset safety: coins with low market cap and liquidity are prone to high slippage and difficulty exiting positions; sudden news can rapidly alter rankings and prices. Any trading decision based on rankings should be paired with independent research and risk management.
Coin Ranking Summary & Best Practices
Coin ranking serves as the first filter when entering the crypto market: use market cap to gauge size, trading volume for activity levels, price changes for sentiment snapshots, then validate execution feasibility and potential supply pressure with liquidity metrics and FDV. Different platforms use varying methodologies and refresh rates—understanding these matters more than absolute ranks. On Gate, combine live data, sorting features, filters, and alerts to turn ranking insights into actionable monitoring and risk controls. Remember: ranking is a reference point—not a buy or sell signal. Combine it with fundamental analysis, news flow, and capital management for more robust decisions in volatile markets.
FAQ
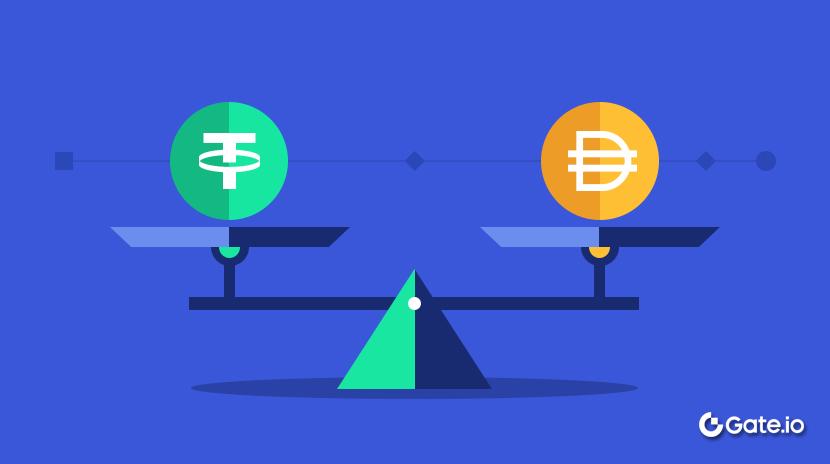
What’s the difference between USD and USDT?
USD refers to US dollar fiat currency; USDT is a blockchain-based stablecoin pegged 1:1 to the US dollar. USD is held in bank accounts while USDT circulates on blockchains—enabling faster transactions with lower fees. On Gate, USDT is the main trading pair, offering convenience for deposits, withdrawals, and crypto-to-crypto trades.
Which cryptocurrencies are currently top three by market cap?
Currently, the three largest cryptocurrencies by market capitalization are typically Bitcoin (BTC), Ethereum (ETH), and stablecoins such as USDT. Rankings fluctuate with market movements; you can check up-to-date data on Gate’s coin ranking page. It’s advisable to focus on the top 10 by market cap—they offer higher liquidity and relatively lower risk.
Why focus on coin ranking instead of just price changes?
Coin ranking reflects overall capital allocation and consensus within the crypto market—the higher a coin ranks, the more mature it is, with greater liquidity and generally lower risk. Solely tracking price changes can lead to buying at highs or selling at lows; rankings help you distinguish between mainstream coins and smaller tokens for more rational investment decisions.
What does a sudden drop in a coin’s ranking indicate?
A drop in ranking usually means one of two things: either the coin’s price has fallen—shrinking its market cap—or new coins have emerged and pushed it down the list. It’s best to analyze other factors like trading volume and community activity before reacting—avoid chasing trends blindly or being misled by temporarily inflated rankings due to speculation in small-cap coins.
Market cap calculations, coin coverage, and update frequencies vary across platforms—so rankings may not always match exactly. Gate uses globally recognized market cap formulas for greater reliability. Checking rankings on Gate supports more informed trade decisions and better risk management.