On Friday, the strong volatility wave of Bitcoin triggered widespread selling pressure in the market, causing Litecoin (LTC) to plummet by 7.5% within just 5 hours. This downward momentum pushed LTC to a new low at $72.64 before the coin attempted to recover. At the time of recording, LTC is trading around $75.89.
In the past two weeks of trading, Litecoin bulls have completely lost control of the important long-term support zone between $80–$84. Previously, a report from Coin Photon emphasized that this area plays a key role in maintaining LTC’s long-term price structure.
Notably, the report also pointed out that the bulls are weakening significantly, almost exhausted of momentum, and are only maintaining a defensive stance. Even with Litecoin being included in the Bitwise 10 Crypto Index ETF (BITW), it was not enough to generate a significant boost to the price on the trading chart.
Assessing the strength of Litecoin’s next downward trend
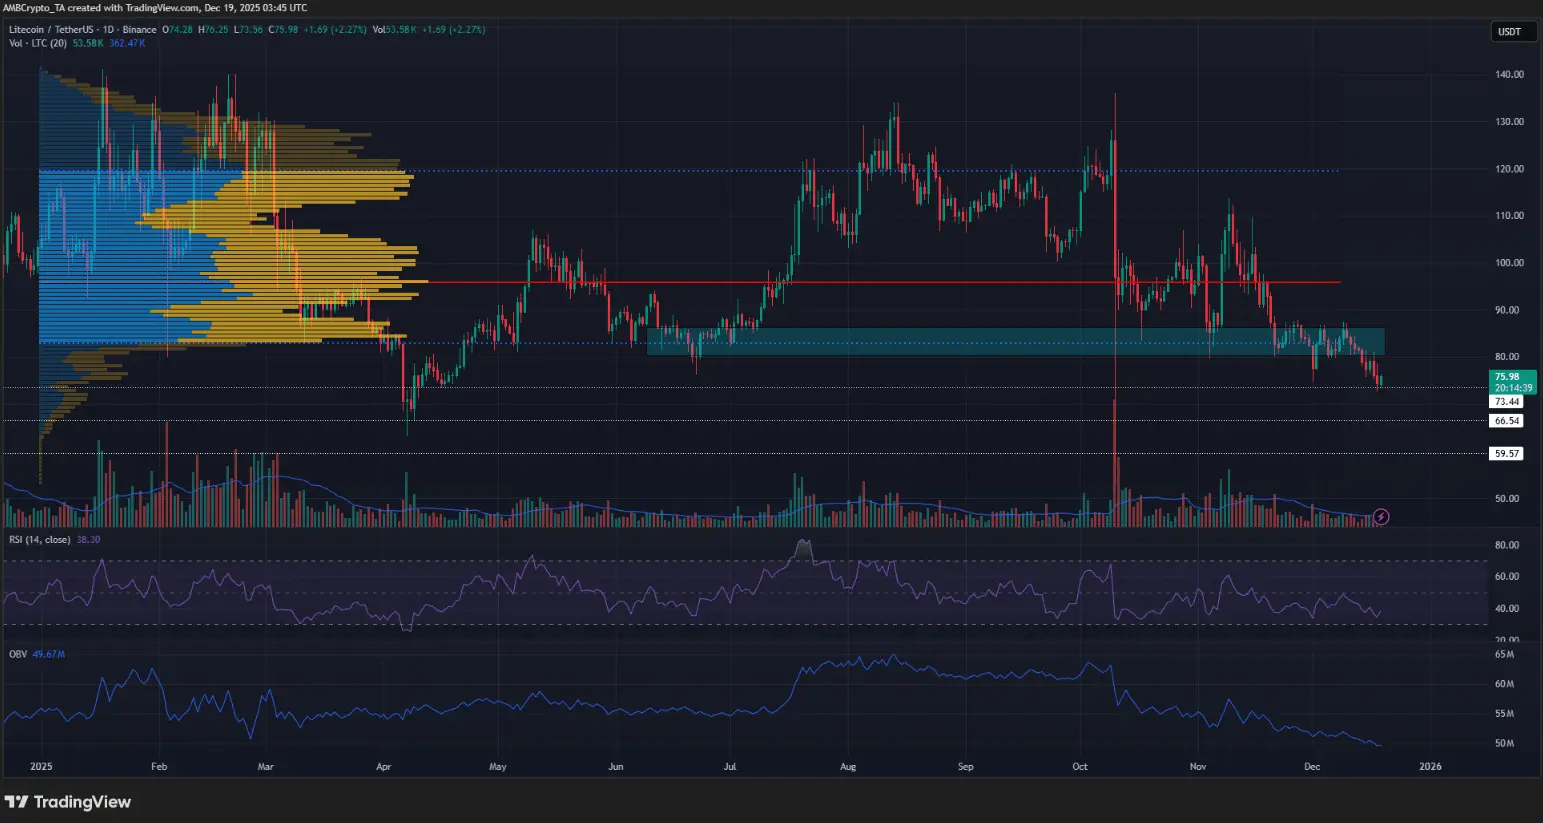 Daily LTC/USDT chart | Source: TradingView Using the Fixed Range Volume Profile tool for the entire 2025, the Value Area High (VAH) and Value Area Low (VAL) are identified at $120 and $83 respectively. After the first week of October, when Litecoin continued trading above the year’s VAH, the market experienced a sharp decline on October 10, marking an important turning point in the trend structure.
The OBV (On-Balance Volume) indicator shows that the supply-demand balance at that time had clearly tilted in favor of the bears, reflecting overwhelming selling pressure. In November, Litecoin entered a period of high volatility and attempted to defend the psychological support zone of $80, but weak demand was insufficient to reverse the downward trend forming.
When the $80 level was officially broken, the situation became more unfavorable for the bulls. The next long-term support zones that the bears might target are at $73.4, $66.5, and deeper at $59.6.
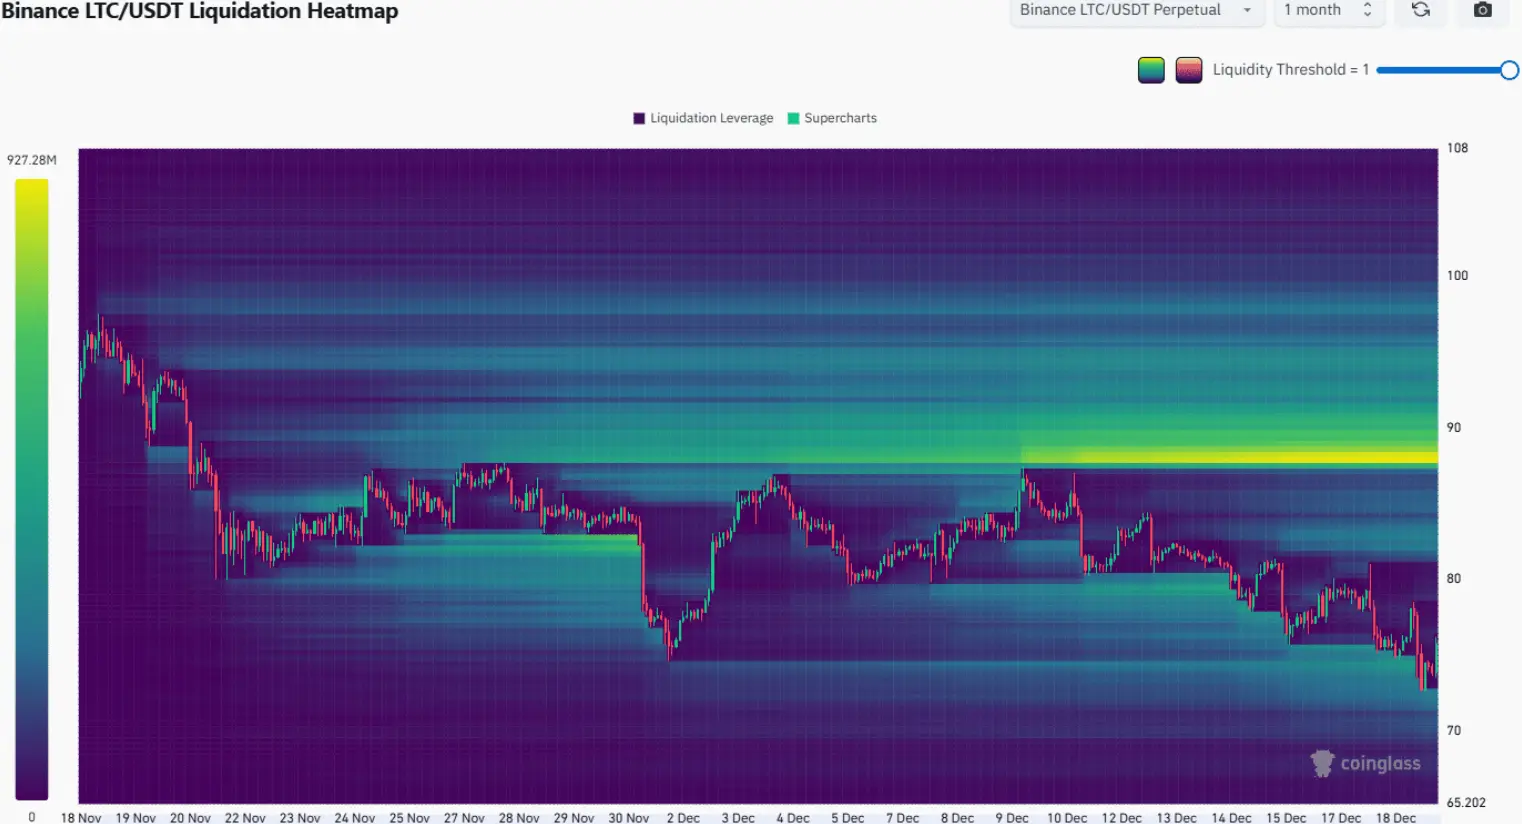 Source: CoinGlass Notably, the monthly liquidation heatmap shows that the liquidity around the $73 zone has been wiped out. In this context, a technical rebound could occur, and the price is likely to be pulled back toward the “magnet” zone of $82–$83, where supply and demand may continue to struggle in the short term.
Less likely scenarios for Litecoin
This is a notable bullish scenario. The $88 zone currently acts as a “liquidity magnet,” where a large concentration of short position liquidations (Short) is focused, potentially attracting the price gradually toward this area. If the overall market sentiment turns positive, triggering a chain reaction of short squeeze effects, LTC could break above $90, thereby reaffirming and strengthening the medium-term bullish trend.
Trader recommendations – Continue to maintain a bearish outlook
This altcoin has just lost a key support zone, signaling a clear market weakening. The main trend and price structure remain entirely bearish, while buying pressure on higher timeframes is almost absent, indicating that the bulls are not yet strong enough to regain control.
In a recovery scenario, the $80–$84 zone is likely to serve as a very strong resistance area that is difficult to conquer. Therefore, traders may consider short-selling on rebounds, with target prices around the support zones of $66 and deeper at $59.
Disclaimer: The information on this page may come from third parties and does not represent the views or opinions of Gate. The content displayed on this page is for reference only and does not constitute any financial, investment, or legal advice. Gate does not guarantee the accuracy or completeness of the information and shall not be liable for any losses arising from the use of this information. Virtual asset investments carry high risks and are subject to significant price volatility. You may lose all of your invested principal. Please fully understand the relevant risks and make prudent decisions based on your own financial situation and risk tolerance. For details, please refer to
Disclaimer.
Related Articles
Bitcoin Veteran Buys $49 Million Worth of ETH as Experts Believe ETH Nears Breakout Price Levels
Bitcoin veteran buys $49 million worth of ETH.
Experts believe ETH is nearing major breakout prices.
ETH price could surge to $2,800 if it can hit $2,400.
The crypto community basks in high spirits as the price of Bitcoin (BTC) recovers targets over the $73,000 price range. At the
CryptoNewsLand21m ago
Ethereum Open Interest Jumps 18%, Bull Trap Signal? - U.Today
Ethereum's futures market saw a significant increase, with open interest rising over 18% to $33.37 billion, indicating heightened risk-taking. Despite bullish trends, traders appear cautious, hedging against potential downturns.
UToday25m ago
"Seeking a Sword by Marking a Boat" - Style Coin Price Predictions Go Viral: The Practical Logic and Flaws of Mystical Prophecies
Author: Frank, PANews
Whenever the market enters a confusing phase of going nowhere, people try to use a "cutting the boat to seek the sword" method of historical retrospection to predict the next market movement. In such cases, people often see from these theories and charts that history always repeats itself, and seem to automatically overlay and verify future price movements with a certain period in the past.
This coincidence seems to have a magical effect and is often verified. Some bloggers claim this prediction method has an accuracy rate of 75%~80%.
Does this "cutting the boat to seek the sword" style price prediction that repeatedly goes viral on social media help the market identify stages, or is it just packaging noise as prophecy?
From "Tick Fractals" to "History Rhyming"
The peak operation regarding predictions of October 2025 market tops is an analyst named CryptoBullet, who created a method called "ti
区块客52m ago
DeFi enters a "winter of yields": liquidity stagnation, leverage contraction, and the disappearance of arbitrage opportunities
The DeFi market entered an "interest rate winter" since September 2025, with deposit rates for major stablecoins declining sharply and supply-demand imbalances causing liquidity congestion. The rate decline reflects reduced capital demand and a lack of high-return opportunities. Stablecoin lending demand has dropped significantly, with market risk appetite shifting toward more stable investment channels. In response to this situation, the Sky protocol demonstrates competitiveness and adaptability by introducing real-world assets to enhance yields. The low interest rates during this phase can be viewed as an opportunity for DeFi market transformation.
区块客58m ago
Bitcoin Is Entering the Best Buy Zone of This Cycle, Analyst Explains His Bullish Declaration
Bitcoin is entering the best buy zone of this cycle.
The analyst explains the reasoning behind his bullish declaration.
Can BTC surge to hit $200,000 following a successful buying phase?
The crypto market seems to be heading into a strong
CryptoNewsLand1h ago
BTC and ETH Reclaim Top Spots in Trending Cryptocurrencies List
BTC and ETH lead the trending cryptocurrency rankings, while SOL, XRP, and PEPE follow. Their prices remain volatile amid changes in gold and silver values, geopolitical tensions, and impending inflation data influencing investor behavior.
TheNewsCrypto1h ago
