The Stellar (XLM) price is currently fluctuating below the $0.22 USD threshold as of writing on Wednesday, after failing to break out and close above the key resistance zone earlier in the week. Selling pressure is increasingly dominant as negative momentum grows, evidenced by the decline in open interest (OI) along with the expansion of short positions (Short). From a technical perspective, the current price structure of XLM signals a less optimistic outlook, indicating a risk of deeper correction, with next support levels below the $0.20 USD zone.
XLM Derivatives Data Shows Negative Sentiment
Stellar’s derivatives data are signaling a bearish market trend. According to Coinglass, the open interest (OI) for XLM futures has dropped to $30.30 million on Wednesday, approaching the year’s lows. This development reflects a clear weakening in investor participation and reinforces the scenario of continued downward pressure on the price.
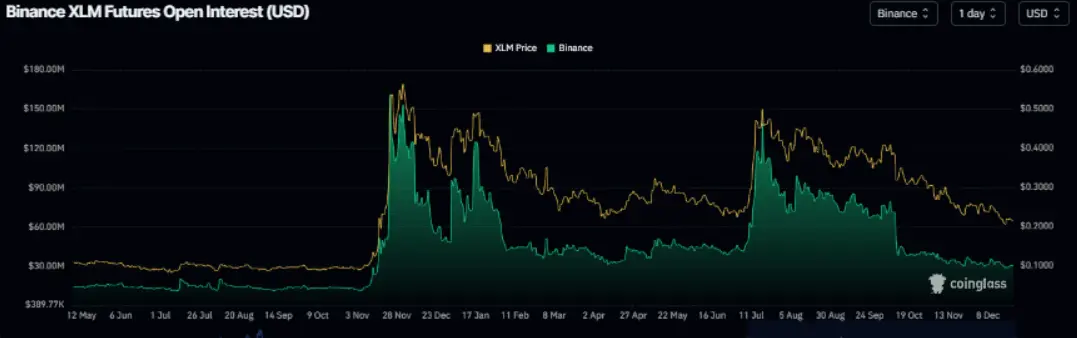 Open interest (OI) for XLM futures | Source: Coinglass Additionally, the long/short ratio for XLM recorded by Coinglass stands at 0.91 — the highest in over a month. Although it has improved compared to previous periods, the ratio remains below 1, indicating that market sentiment is still predominantly bearish, with more positions betting on a decline in XLM’s price.
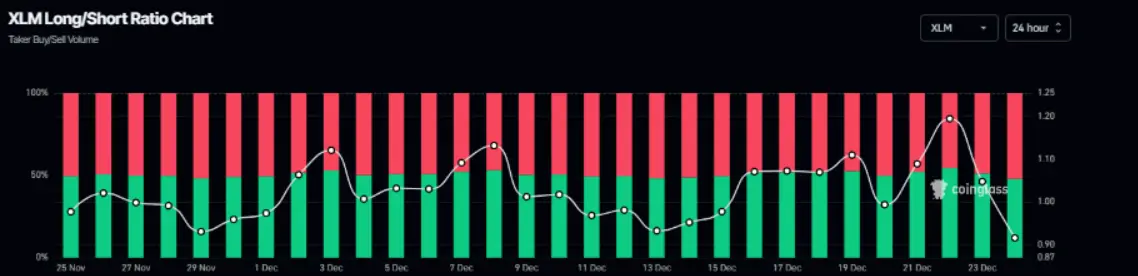 XLM Long/short ratio | Source: Coinglass## Stellar Price Forecast: XLM Rejected at Key Resistance
The Stellar (XLM) price failed to break through the weekly resistance zone around $0.22 USD during Tuesday’s trading session, reversing to decline about 1.5%. On Wednesday, XLM continued to fluctuate weakly and is currently trading around $0.21 USD.
In a scenario where the correction trend persists, XLM risks retreating to test the short-term bottom at $0.20 USD on December 18. If this support level is broken with a decisive closing candle, selling pressure could intensify, pushing the price down toward the year’s lowest point at $0.16 USD, established on October 10.
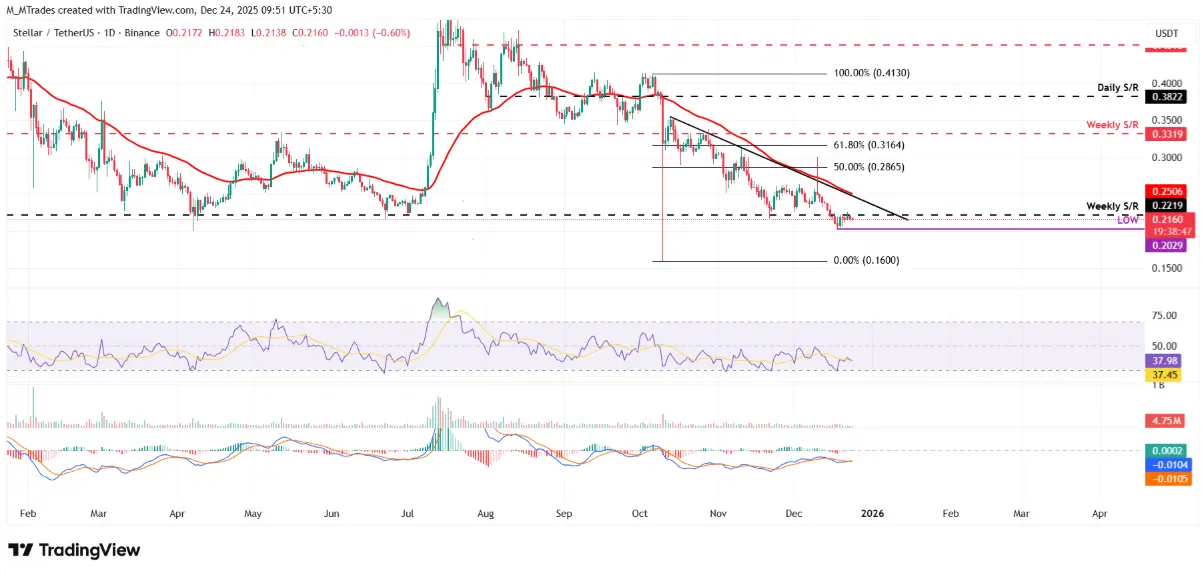 Daily XLM/USDT chart | Source: TradingView From a technical standpoint, the RSI indicator on the daily timeframe is at 37, below the neutral threshold of 50, reflecting that downward momentum is clearly dominant. Meanwhile, the MACD lines show signs of convergence, indicating that market sentiment remains cautious and lacks the momentum to form a clear trend.
Conversely, if buying interest returns, XLM could extend its recovery and continue challenging the important resistance zone around $0.22 USD.
SN_Nour
Disclaimer: The information on this page may come from third parties and does not represent the views or opinions of Gate. The content displayed on this page is for reference only and does not constitute any financial, investment, or legal advice. Gate does not guarantee the accuracy or completeness of the information and shall not be liable for any losses arising from the use of this information. Virtual asset investments carry high risks and are subject to significant price volatility. You may lose all of your invested principal. Please fully understand the relevant risks and make prudent decisions based on your own financial situation and risk tolerance. For details, please refer to
Disclaimer.
