
Date: Sun, Dec 21 2025 | 08:56 AM GMT
The broader cryptocurrency market has remained under pressure over the past several weeks, following the sharp sell-off that began on October 10. That corrective phase dragged Ethereum (ETH) down by nearly 23% over the last 60 days and weighed heavily on overall market sentiment. While many altcoins have struggled to stabilize, Quant (QNT) has shown relative resilience, posting only a modest decline and holding above a historically important support zone.
From a technical perspective, the daily chart suggests that QNT may be approaching a critical decision point, with price action forming a recognizable structure that could influence its next directional move.
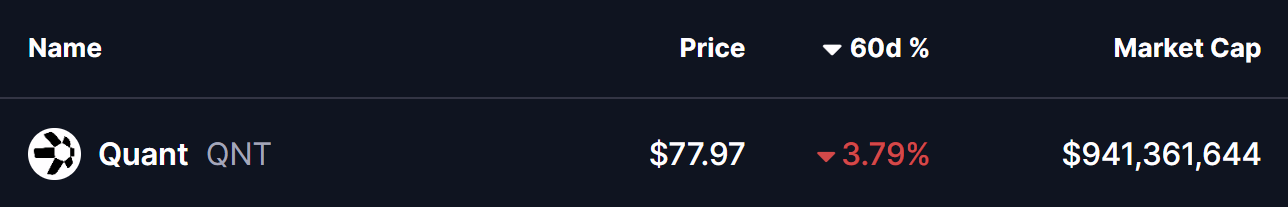
Source: Coinmarketcap
Head and Shoulders Pattern Takes Shape
On the daily timeframe, QNT appears to be carving out a head and shoulders formation, a well-known pattern that often signals a potential trend shift once the neckline is tested. Earlier in the structure, QNT formed the left shoulder before rallying sharply to its head near the $100 region. From there, price reversed lower and slid back toward the neckline, located around the $70 support zone.
This $70 area has proven to be a strong demand zone in the past, repeatedly attracting buyers and preventing deeper declines. The recent move into this region was met with a noticeable reaction, as reflected by the long lower wick on the chart. That rejection from support pushed price back toward the $78 level, suggesting that buyers are actively defending the neckline and potentially forming the right shoulder of the pattern.
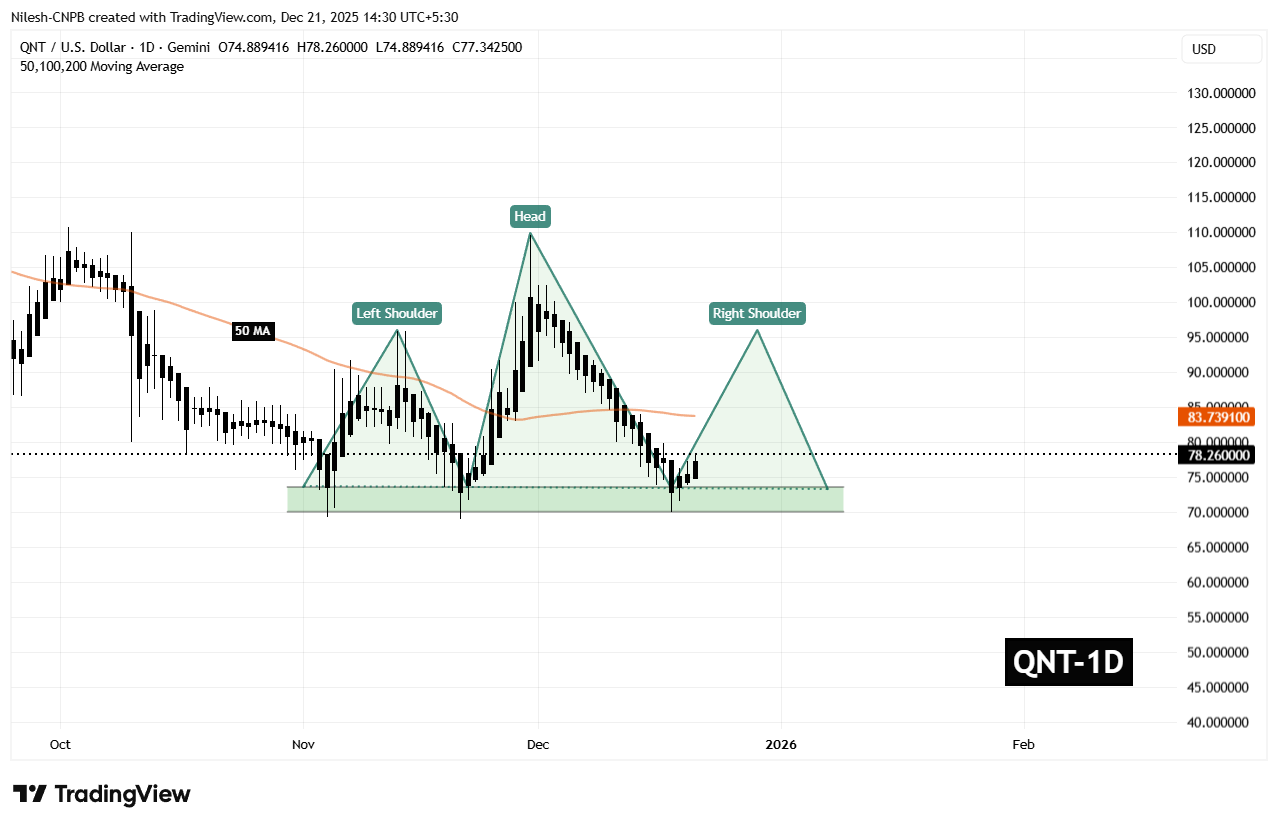
Quant (QNT) Daily Chart/Coinsprobe (Source: Tradingview)
The behavior around this zone is critical. A successful defense of the neckline often opens the door for a relief rally, especially if broader market conditions stabilize.
What’s Next for QNT?
For bullish momentum to build, QNT needs to reclaim the 50-day moving average, currently sitting near $83.73. This level now acts as a key short-term resistance, and a daily close above it would signal a shift in momentum back in favor of buyers.
If that recovery unfolds, the chart points toward a potential move into the $95.90 region. Such a move would represent a rebound of roughly 22% from current levels and align with the typical reaction seen during the right-shoulder phase of this pattern. A rally of this nature would not only ease recent selling pressure but also place QNT back into a more neutral technical posture.
That said, the setup remains delicate. If the $70 neckline support fails to hold on a sustained basis, the head and shoulders structure would remain bearish, opening the door to further downside and extending the corrective phase. For now, all eyes remain on how price behaves around this key support and whether buyers can regain control above the moving average.
Disclaimer: The views and analysis presented in this article are for informational purposes only and reflect the author’s perspective, not financial advice. Technical patterns and indicators discussed are subject to market volatility and may or may not yield the anticipated results. Investors are advised to exercise caution, conduct independent research, and make decisions aligned with their individual risk tolerance.
Disclaimer: The information on this page may come from third parties and does not represent the views or opinions of Gate. The content displayed on this page is for reference only and does not constitute any financial, investment, or legal advice. Gate does not guarantee the accuracy or completeness of the information and shall not be liable for any losses arising from the use of this information. Virtual asset investments carry high risks and are subject to significant price volatility. You may lose all of your invested principal. Please fully understand the relevant risks and make prudent decisions based on your own financial situation and risk tolerance. For details, please refer to
Disclaimer.
Related Articles
RIVER surges 25% in one day: Will the uptrend continue?
RIVER has surged by 25% in 24 hours, with a 11% increase over the past week, driven by speculative trading and a 42% rise in open interest. Despite this, actual market demand remains weak, suggesting a possibility of upcoming corrections.
TapChiBitcoin1h ago
Today's cryptocurrency fear and greed index dropped to 10, still in extreme panic state
Gate News reports that on March 22, according to data from Alternative.me, the cryptocurrency fear and greed index dropped to 10, continuing its decline from yesterday's 12, and the market remains in a state of "extreme fear."
GateNews1h ago
Shiba Inu (SHIB) Sees Shorts Exit in 4 Hours While Price Eyes Recovery - U.Today
Shiba Inu's price fluctuated recently, rising to $0.00000622 before falling below the daily MA 50 at $0.00000604. Despite brief liquidations of short positions, long traders faced larger losses. Open interest in SHIB increased by 14.31%, indicating a growing trust in its potential rise amidst market uncertainties.
UToday1h ago
Why Isn’t XRP Surging With Adoption Growth? Evernorth CEO Explains
XRP’s price disconnect from real-world usage is raising concern as Evernorth CEO Asheesh Birla signals institutional adoption remains too limited to support sustained demand, despite expanding infrastructure ambitions across the network.
XRP Pricing Disconnect Highlights Institutional Gap
A
Coinpedia2h ago
Ethereum Mirroring April 2025 Crash Points to $1,750 As the Definitive Cycle Bottom
In the fast-paced world of cryptocurrency, what initially appears to be mere coincidence in fractal patterns gradually transforms into a striking precision as these patterns evolve. A prominent analyst Ash Crypto recently made a
BlockChainReporter3h ago
