The competition among DEX platforms may have cooled down, but Avantis is showing impressive signs of breakout.
In the past 24 hours, the Avantis token (AVNT) surged over 22%, bringing the weekly cumulative increase to 62% — a figure that has caught the market’s attention. This strong rally clearly reflects growing interest from capital flows toward Avantis, despite the overall market environment becoming less lively.
Contrary to the bullish momentum of AVNT, some other Perp DEXs like AsterDEX (ASTER) are struggling in terms of price, indicating an increasing divergence within the group of emerging DEX projects.
Avantis Reverses Market Structure to an Uptrend
On the technical chart, Avantis has officially broken a downtrend structure that lasted over a month. The correction for AVNT started immediately after October 24, about two weeks after the widespread liquidation wave across the entire cryptocurrency market.
The recovery momentum was reinforced when AVNT broke above the downtrend resistance line and also surpassed the 50-day simple moving average (SMA) — an important technical signal indicating a trend reversal. This development aligns with the bullish divergence signal from the RSI indicator, which is now approaching the 68 level.
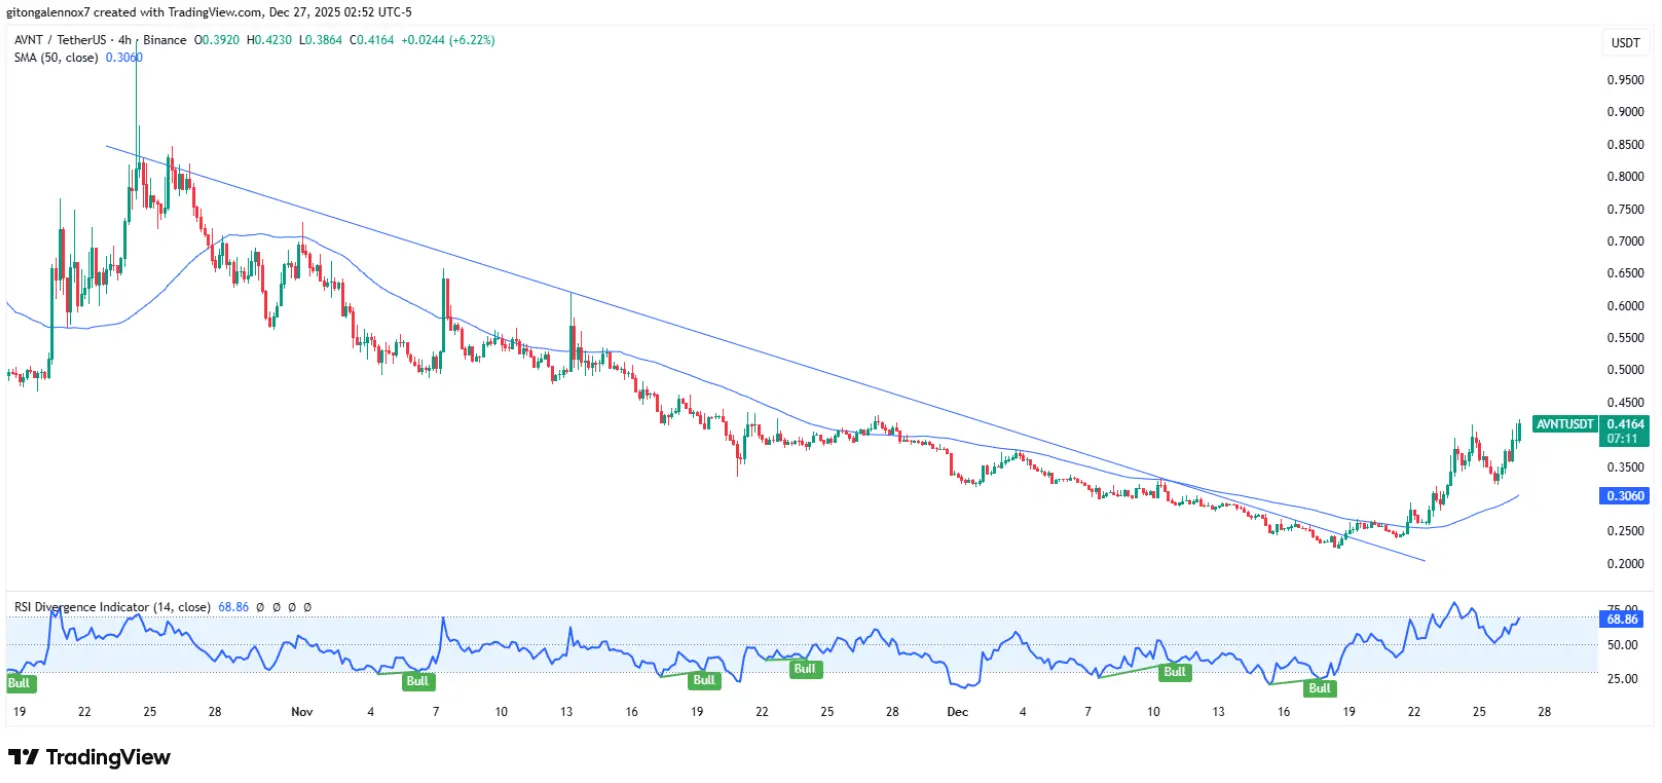 AVNT/USDT 4-hour chart | Source: TradingView
Since the breakout on December 19, AVNT has continuously set higher highs and higher lows, reflecting increasing dominance of the bulls. Notably, this altcoin rebounded from the $0.32 level on Christmas Day, maintaining a firm position above the 50 SMA.
AVNT/USDT 4-hour chart | Source: TradingView
Since the breakout on December 19, AVNT has continuously set higher highs and higher lows, reflecting increasing dominance of the bulls. Notably, this altcoin rebounded from the $0.32 level on Christmas Day, maintaining a firm position above the 50 SMA.
However, AVNT’s upward momentum is temporarily stalling as it approaches a minor resistance zone around $0.40 — an area that previously served as a key accumulation zone about a month ago.
If AVNT successfully breaks through the $0.40 threshold, it could open up new growth potential, targeting the $0.60 zone or higher. Conversely, if the price weakens and breaks below the moving average, the current uptrend is likely to be invalidated.
In addition to the technical breakout momentum, network activity indicators are also playing a crucial role, helping to reinforce AVNT’s short-term bullish outlook.
Signs of Resilience?
Disclaimer: The information on this page may come from third parties and does not represent the views or opinions of Gate. The content displayed on this page is for reference only and does not constitute any financial, investment, or legal advice. Gate does not guarantee the accuracy or completeness of the information and shall not be liable for any losses arising from the use of this information. Virtual asset investments carry high risks and are subject to significant price volatility. You may lose all of your invested principal. Please fully understand the relevant risks and make prudent decisions based on your own financial situation and risk tolerance. For details, please refer to
Disclaimer.
Related Articles
彭博社:比特币接近历史级熊市底部,4.5万至5.5万美元或为最终底部区间
彭博社分析认为,比特币接近历史熊市底部,预计4.5万至5.5万美元为最终底部。分析指出,长期技术指标显示比特币低估,市场流动性和成熟度的提升使历史熊市的跌幅逐渐缩小。
GateNews44m ago
今日加密货币恐慌与贪婪指数降至15,市场处于极度恐慌状态
Gate News 消息,3月15日,据 Alternative.me 数据显示,今日加密货币恐慌与贪婪指数降至15,较昨日的16进一步下滑,市场持续处于「极度恐慌状态」。
GateNews2h ago
Bitcoin Treasury Firms on Track to Absorb 10x Daily Mined Bitcoin Supply, Industry Leaders Say
Corporate demand for bitcoin is accelerating as publicly traded companies tap stock and preferred-share financing to accumulate supply, a trend some industry leaders say could significantly increase corporate demand for newly mined coins and potentially influence market dynamics.
Wall Street
Coinpedia2h ago
COS Price Rally Gains Strengthen Due to Persistent Whale Accumulation With Breakout Suggesting 31...
Contentos (COS) is gaining attention in the crypto market with an impressive price surge of 11.98%. As a decentralized content ecosystem, it empowers creators. Recent analysis shows a significant upward momentum, with potential for further price increases driven by whale investments and rising trading volume.
BlockChainReporter5h ago
$RIVER Price Action Is Flawless: Here’s Why Bulls Are in Control
RIVER has had one of the more compelling stories in crypto over the past week. After the recent airdrop and ecosystem announcements, the token attracted strong buying interest. that pushed it well above previous consolidation levels.
Now, as the initial hype settles, The chart is showing
CaptainAltcoin7h ago
Dogecoin at a Turning Point — Will $0.094 Resistance Finally Break?
Dogecoin was trading between $0.0925 and $0.09173 with the price stabilizing around $0.0925.
The immediate $0.09443 resistance caps the current range. A move above this level could expand today’s trading activity.
Past historical price movements coincide with a number of trend support res
CryptoNewsLand7h ago