Solana (SOL) price has decreased by approximately 12% over the past 30 days. As 2026 approaches, chart signals indicate a mix of bullish and bearish trends.
Some technical indicators forecast a potential recovery in January, while other factors warn that selling pressure could continue if market momentum is not reinforced.
Historical bias towards gains, but ETF flow and expert opinions remain divided
January is often a strong growth period for Solana, with an average return of up to 59% and a median increase of around 22%. This trend becomes even more apparent when December ends in the red.
For example, in 2022, SOL fell 29.6% in December, but immediately rebounded 140% in January 2023. Similarly, December 2024 saw SOL drop 20.5%, followed by a 22.3% increase in January 2025. This month, SOL is down 6.94%, and historical data suggests a high likelihood of recovery.
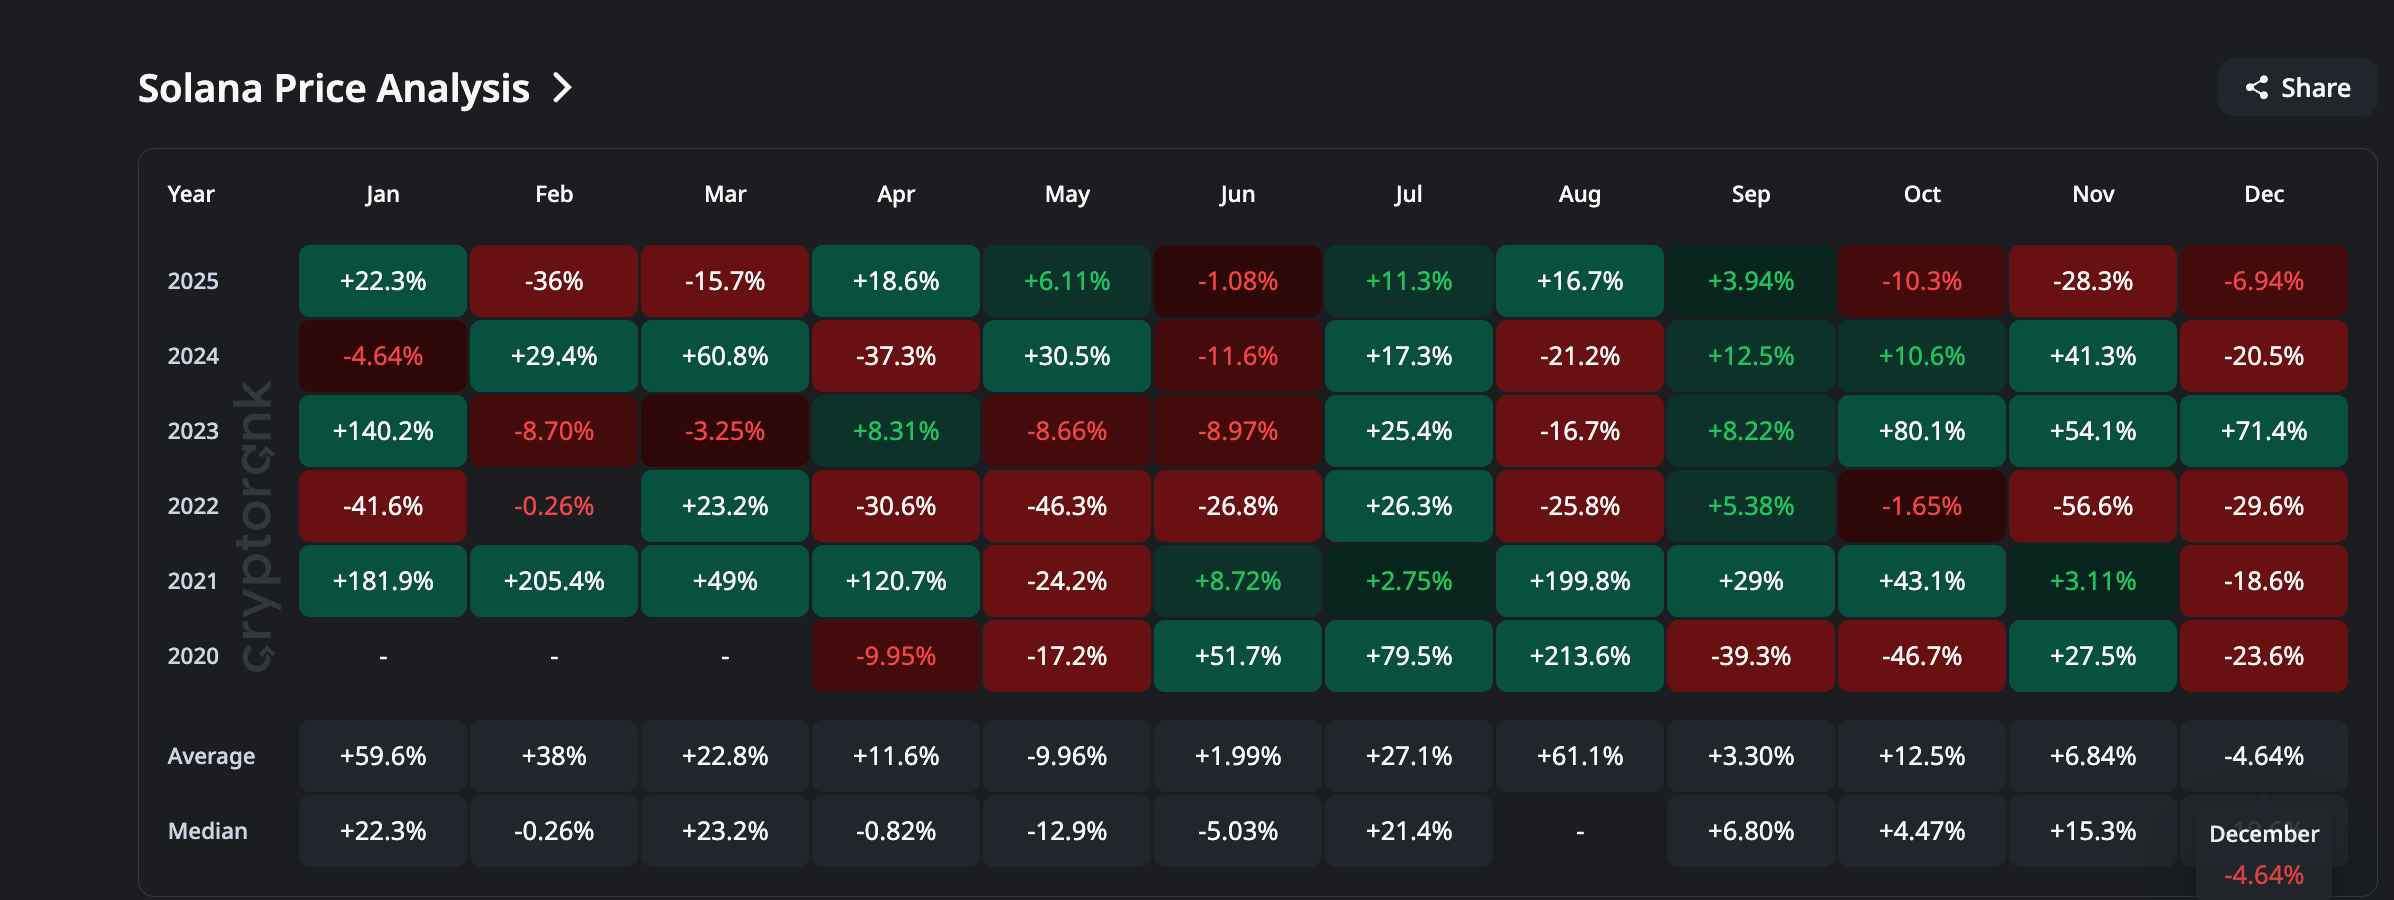 The story of “Red December – Green January” | Source: CryptoRankData from ETF funds also supports this view. Since their launch, Solana spot ETFs have never recorded a week of net withdrawals. The most recent week continued to see inflows of $13.14 million (even before the week ends), bringing total accumulated inflows to $755.77 million.
This steady demand reflects selective confidence in SOL, especially as other major currencies face withdrawal pressures.
 Solana ETF Flows | Source: SoSo ValueAccording to B2BinPay’s analysis team, this flow pattern is particularly significant for Solana and the entire market, as they share:
“Investors are not shifting all their capital from Bitcoin and Ethereum into altcoins. They selectively choose some liquid, prominent tokens where downside risk can be controlled and positions can be easily closed if needed.
That’s why only a few altcoins like Solana or XRP are seeing inflows, while most of the market remains relatively quiet. The current inflow into Solana should not be seen as the start of an altcoin season. These movements are very selective and limited.”
This assessment reinforces the trend of ETF inflows into SOL but also warns against expecting a broad bullish cycle for altcoins at this time.
Chart signals suggest a reversal, but EMA and derivatives remain barriers
On the two-day chart, SOL’s lows have been lower from 11/21 to 12/17, while the RSI has formed higher lows. This is a bullish divergence, potentially signaling a trend reversal if buying momentum persists.
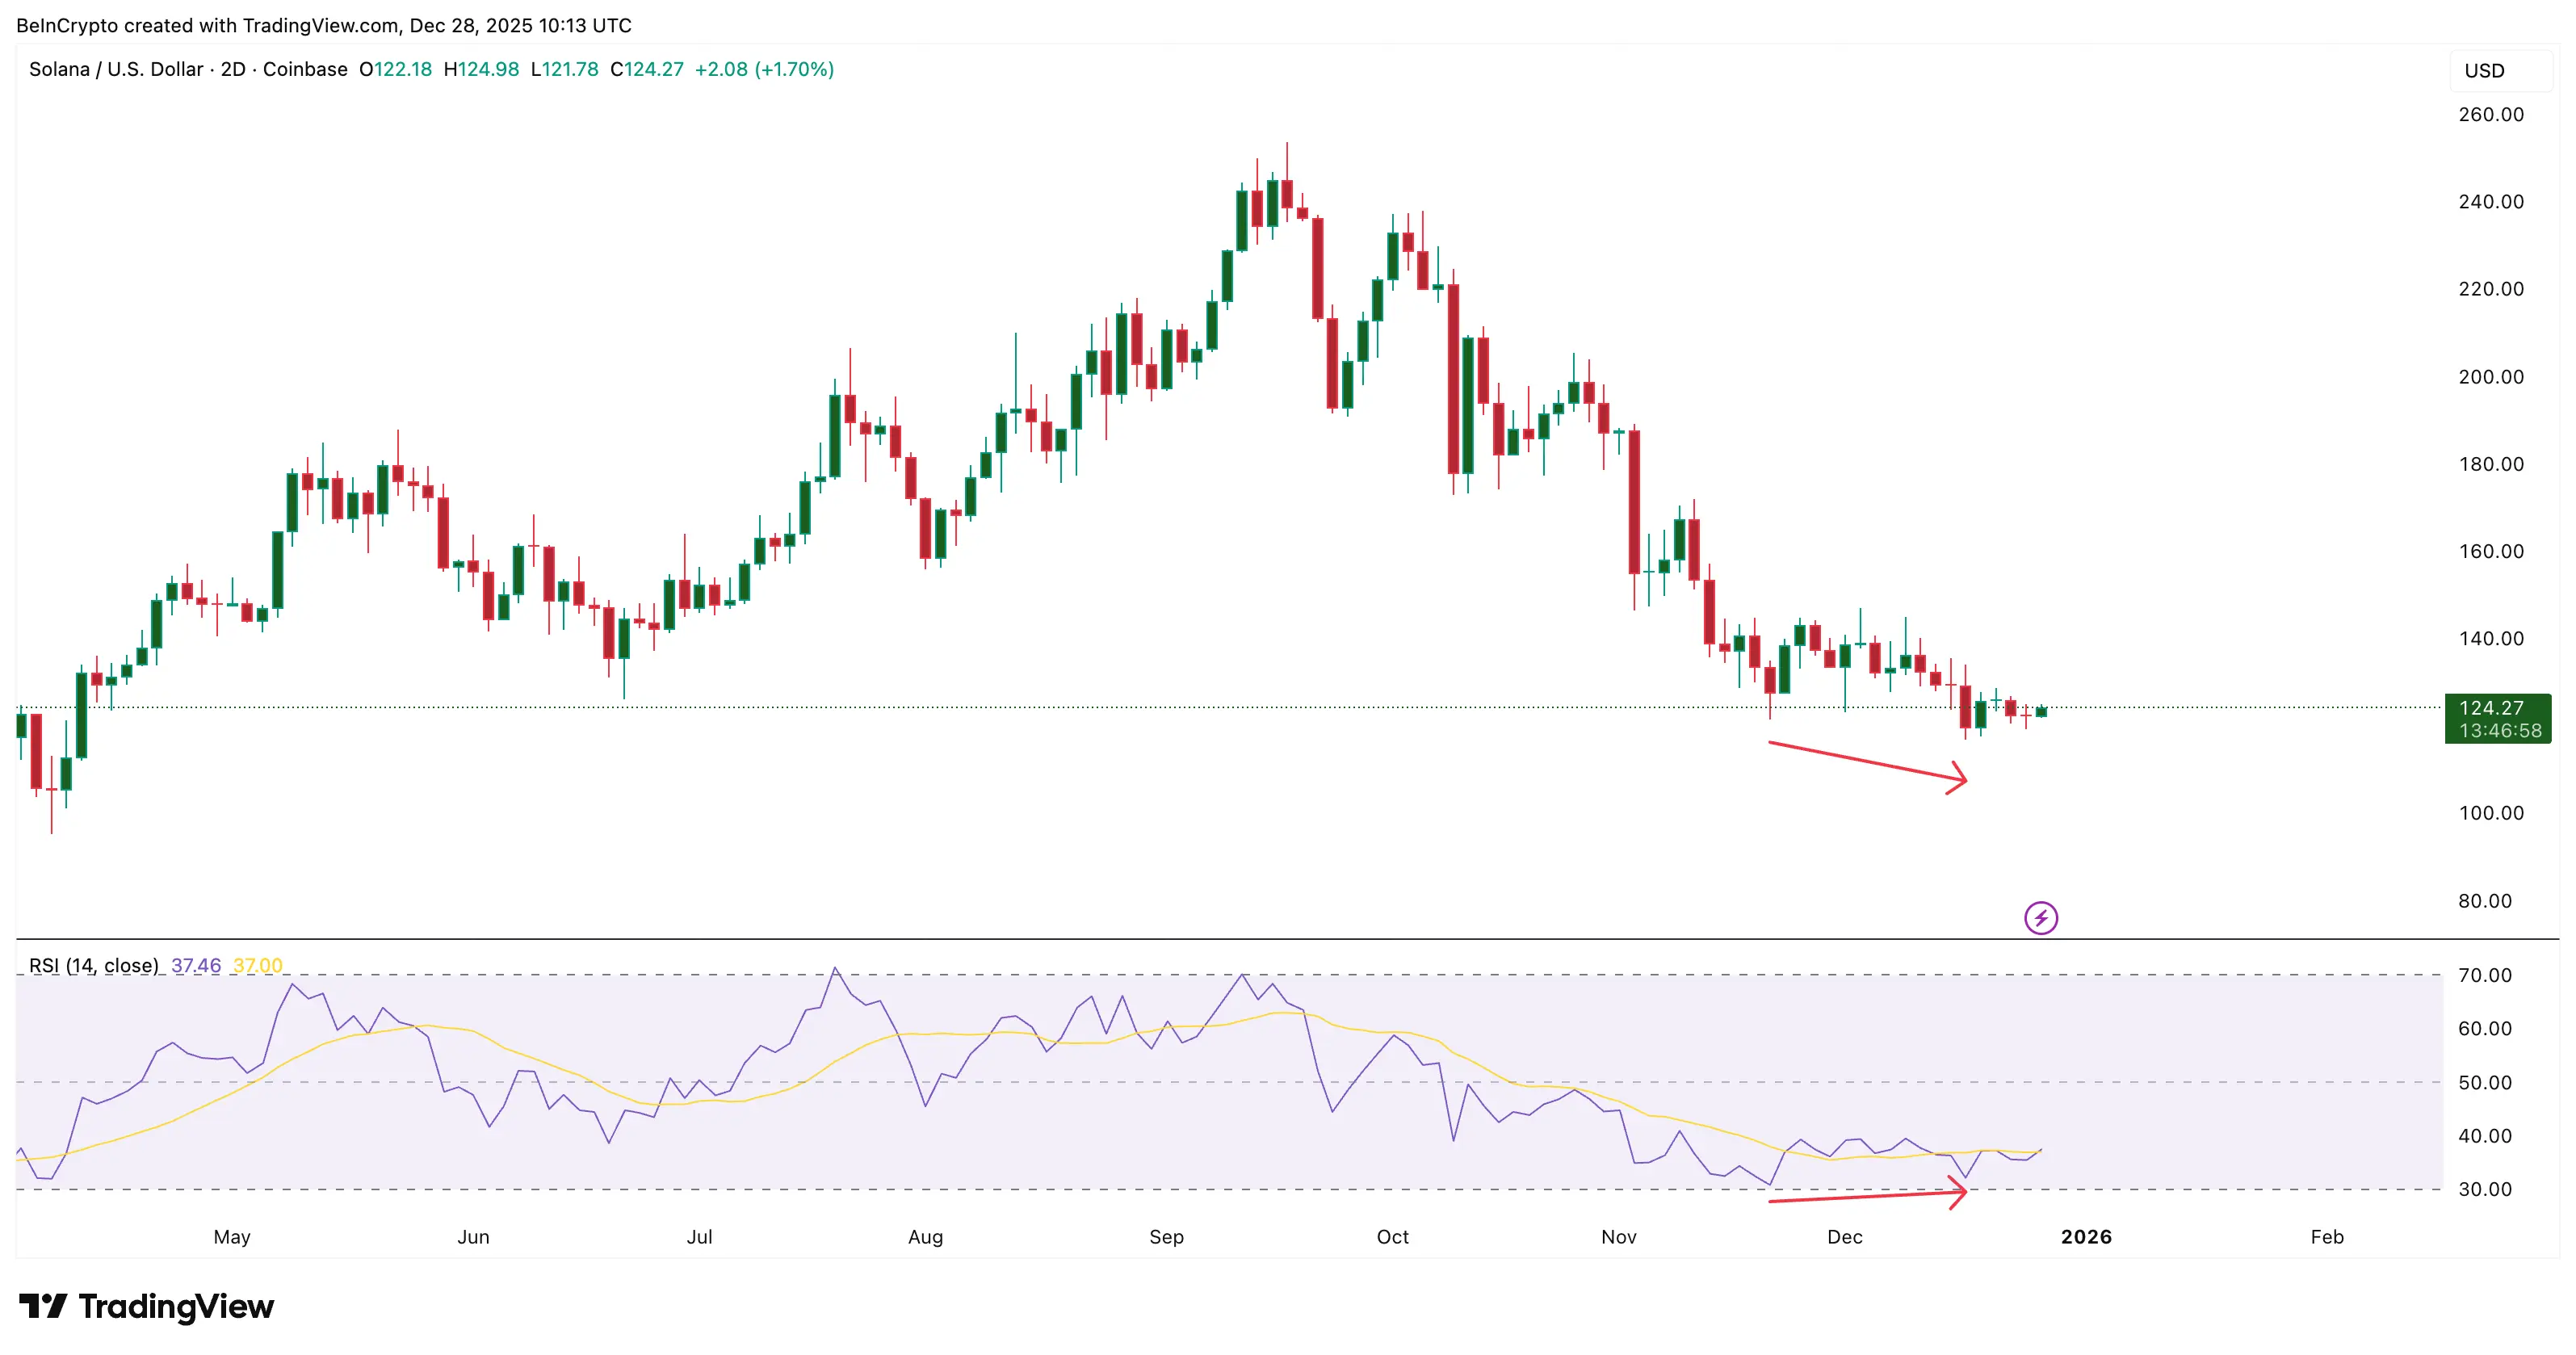 Bullish Divergence | Source: TradingViewHowever, there are also underlying bearish signs.
On the same timeframe, the 100-period EMA is about to cross below the 200-period EMA. If this bearish crossover is confirmed, selling pressure could extend into late December or early January before a strong market recovery. Until this crossover is invalidated or reversed, the technical outlook remains uncertain.
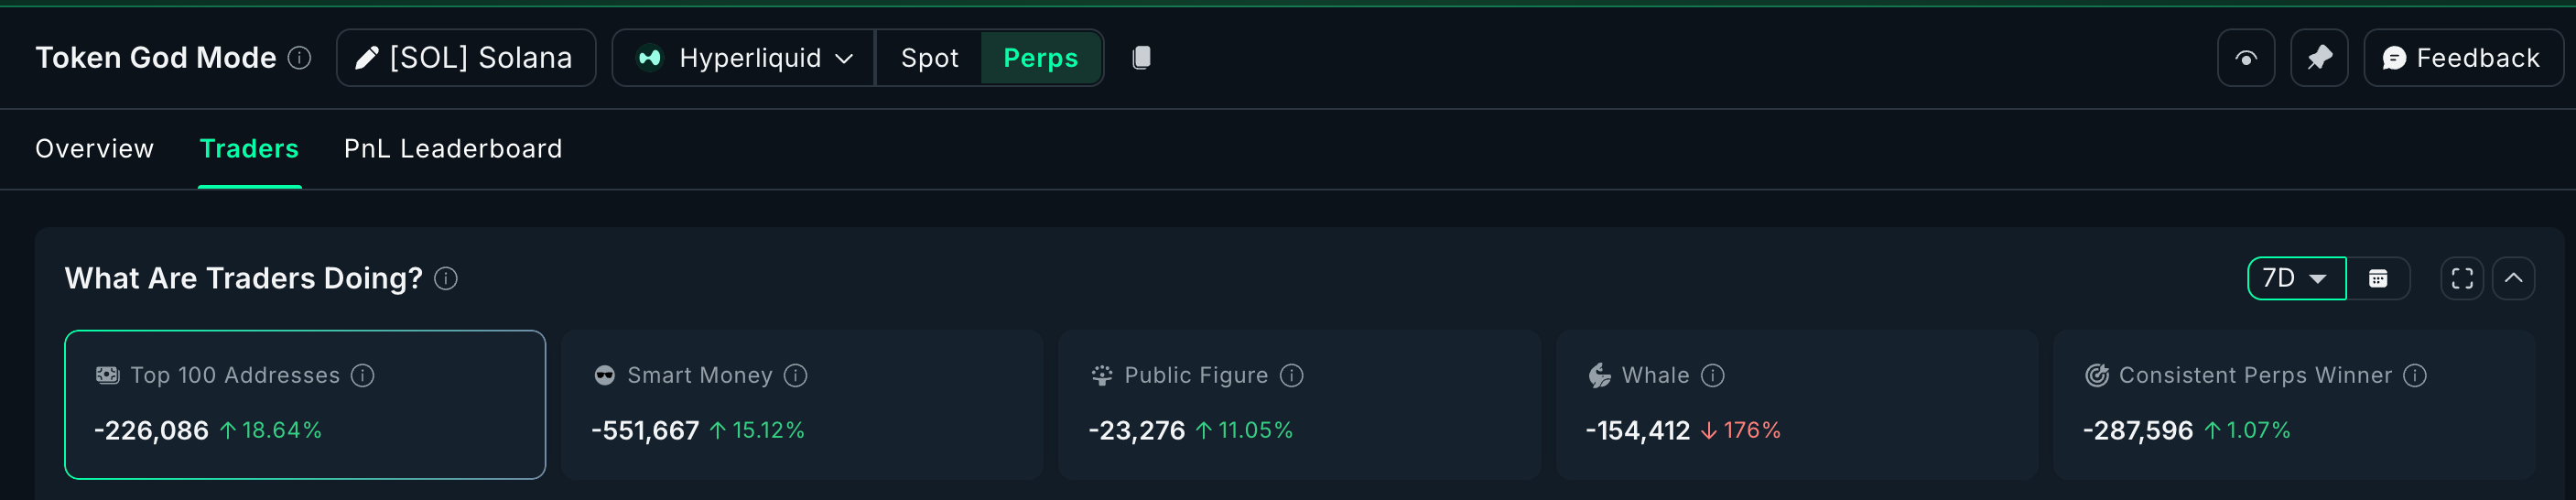
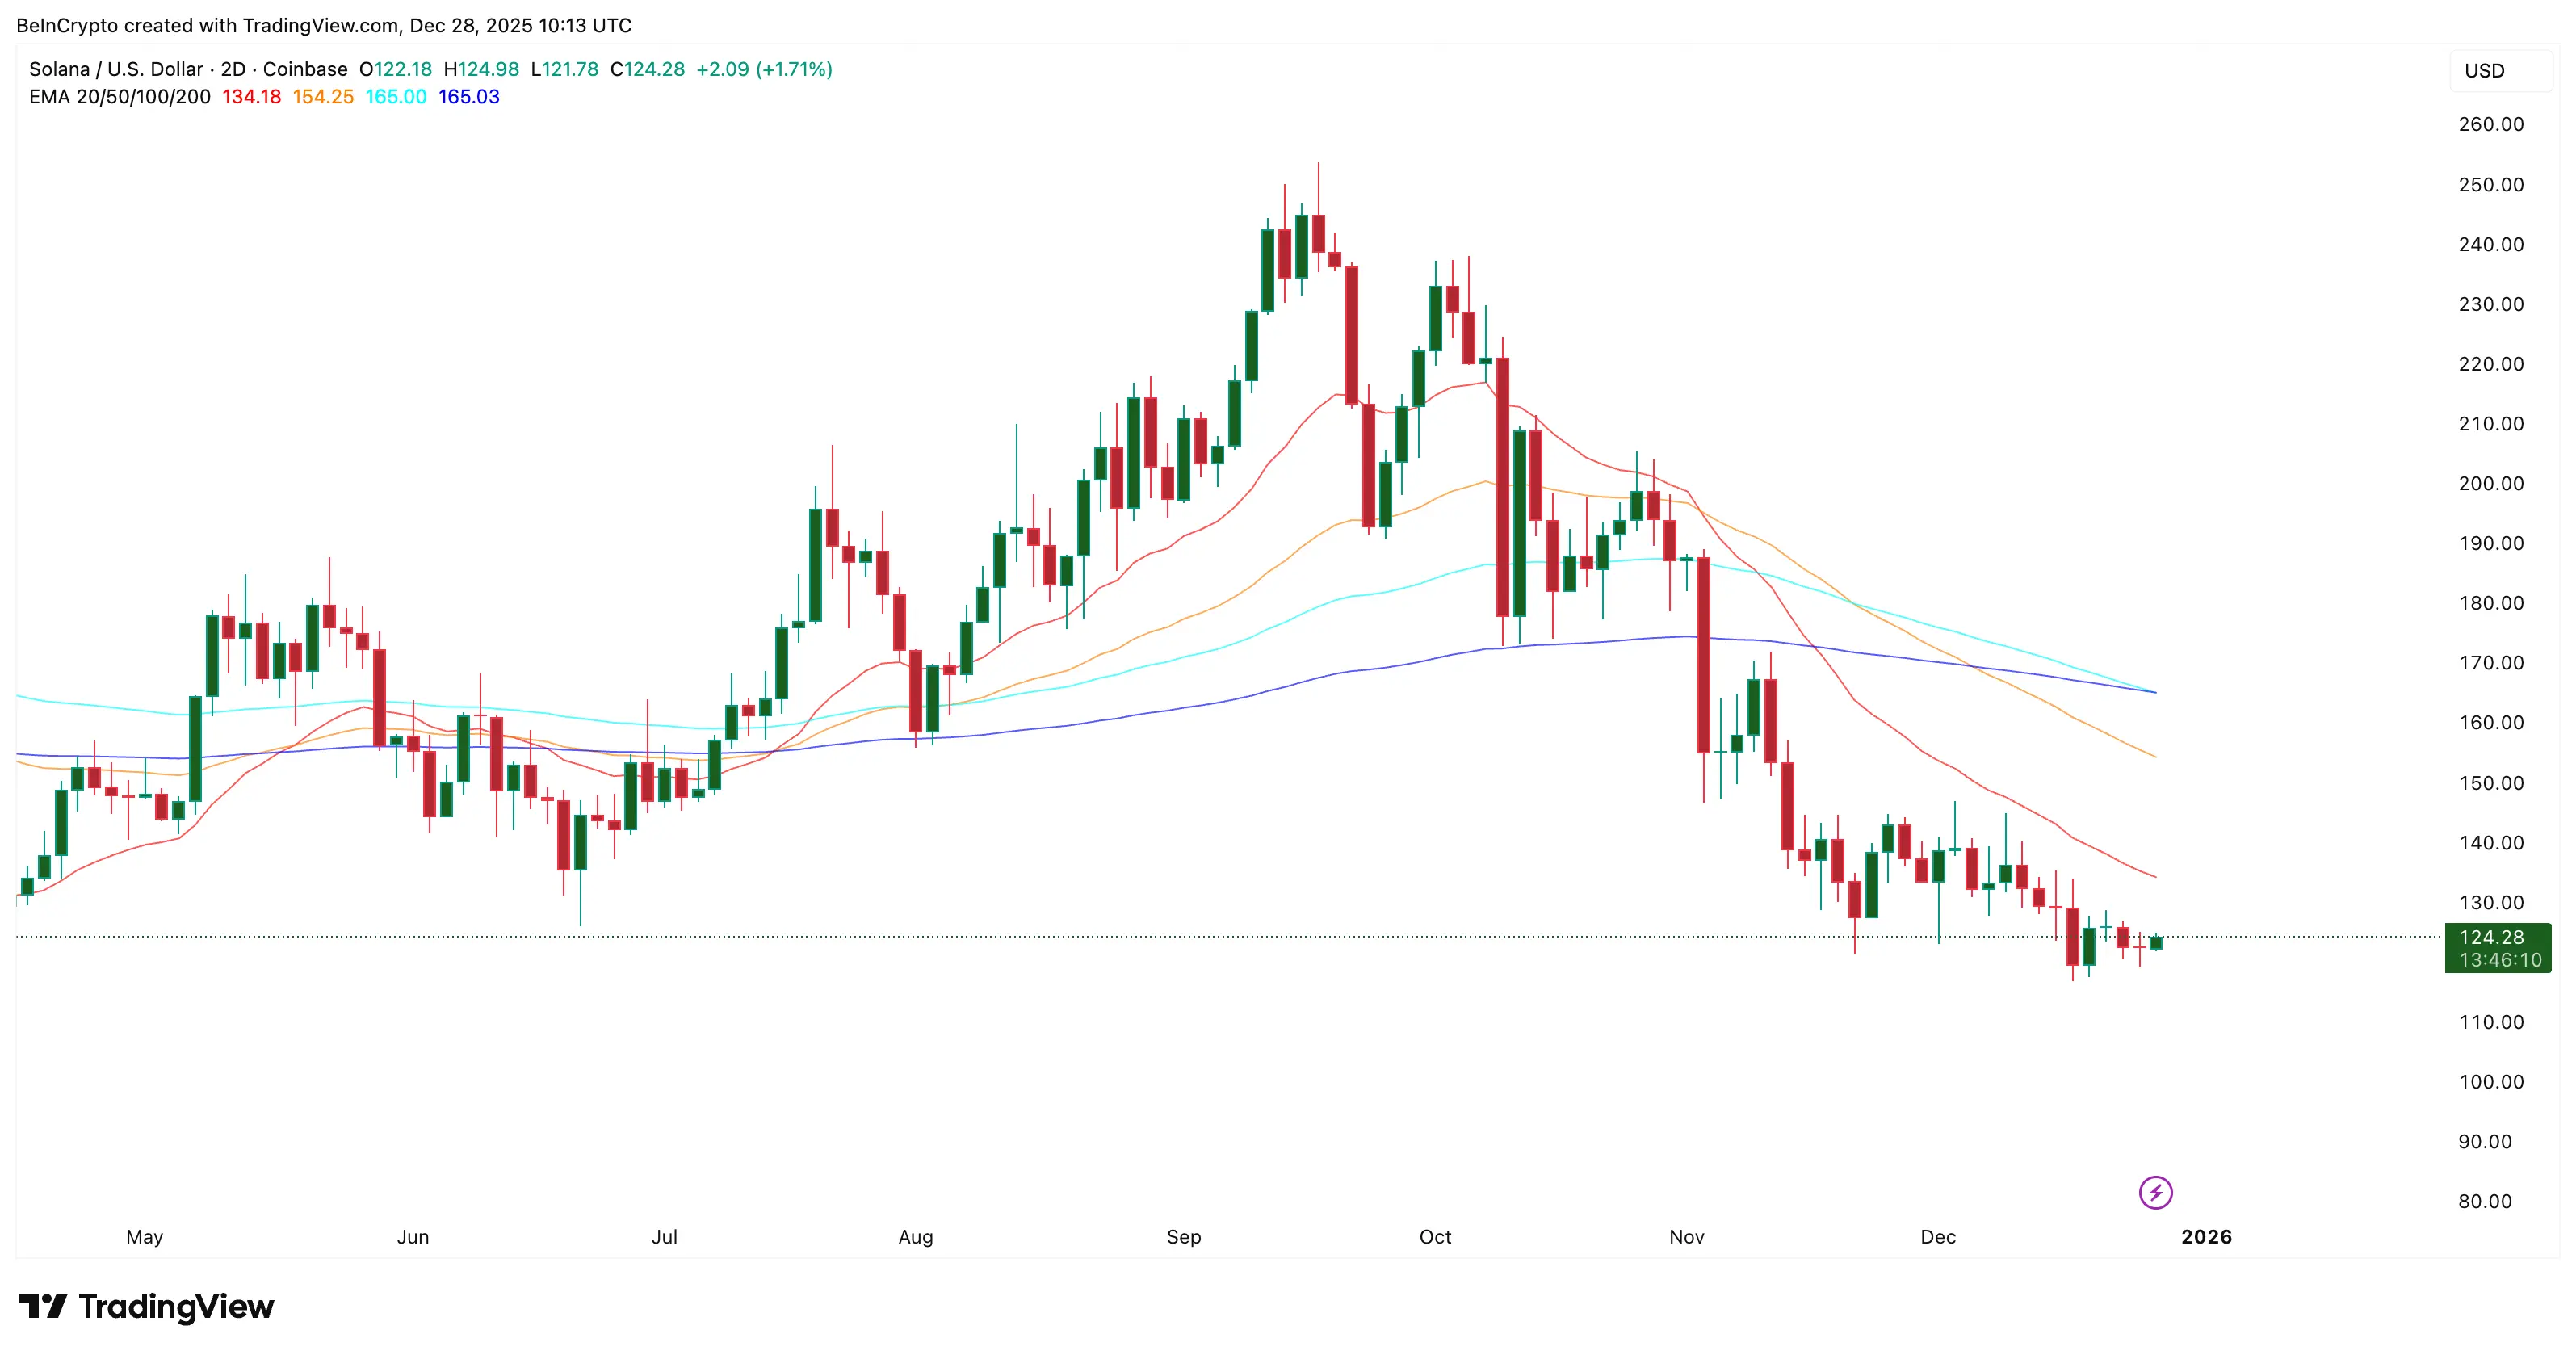 Solana shows bearish signals | Source: TradingViewFrom a derivatives perspective, market sentiment remains cautious. On Hyperliquid, nearly all investor groups have held short positions over the past 7 days.
Large addresses, “smart money,” and Solana whales are all leaning toward short positions. However, some groups like “smart money,” influential traders, and successful traders are beginning to open long positions, possibly anticipating a growth month in January 2026 as historical patterns suggest.
 Solana derivatives products | Source: NansenThis mixed picture makes the market outlook balanced. Upward momentum is forming, but EMA indicators and derivatives positions advise investors to be patient. If Solana aims to generate upward movement in January, it must reverse the derivatives sentiment from short to long and avoid confirming a bearish EMA crossover.
Key price levels: $129 is the critical threshold, $116 is the last line of defense
SOL is currently trading around $128. If the price closes above $129 for two consecutive days, it will confirm an uptrend and open the door to reaching $150. Surpassing $150, the next target could be $171, provided ETF inflows remain strong and RSI momentum stays positive.
Heatmap data based on cost basis shows why $129 is important: a large supply cluster is in the $123–$124 range, and SOL is trying to break through this barrier.
Closing above $129 will help eliminate immediate resistance above, facilitating further gains as supply diminishes from the $165–$167 zone, especially if trading volume increases.
Cost basis heatmaps help identify supply/demand zones based on where most holders bought in, thus forecasting key support or resistance levels.
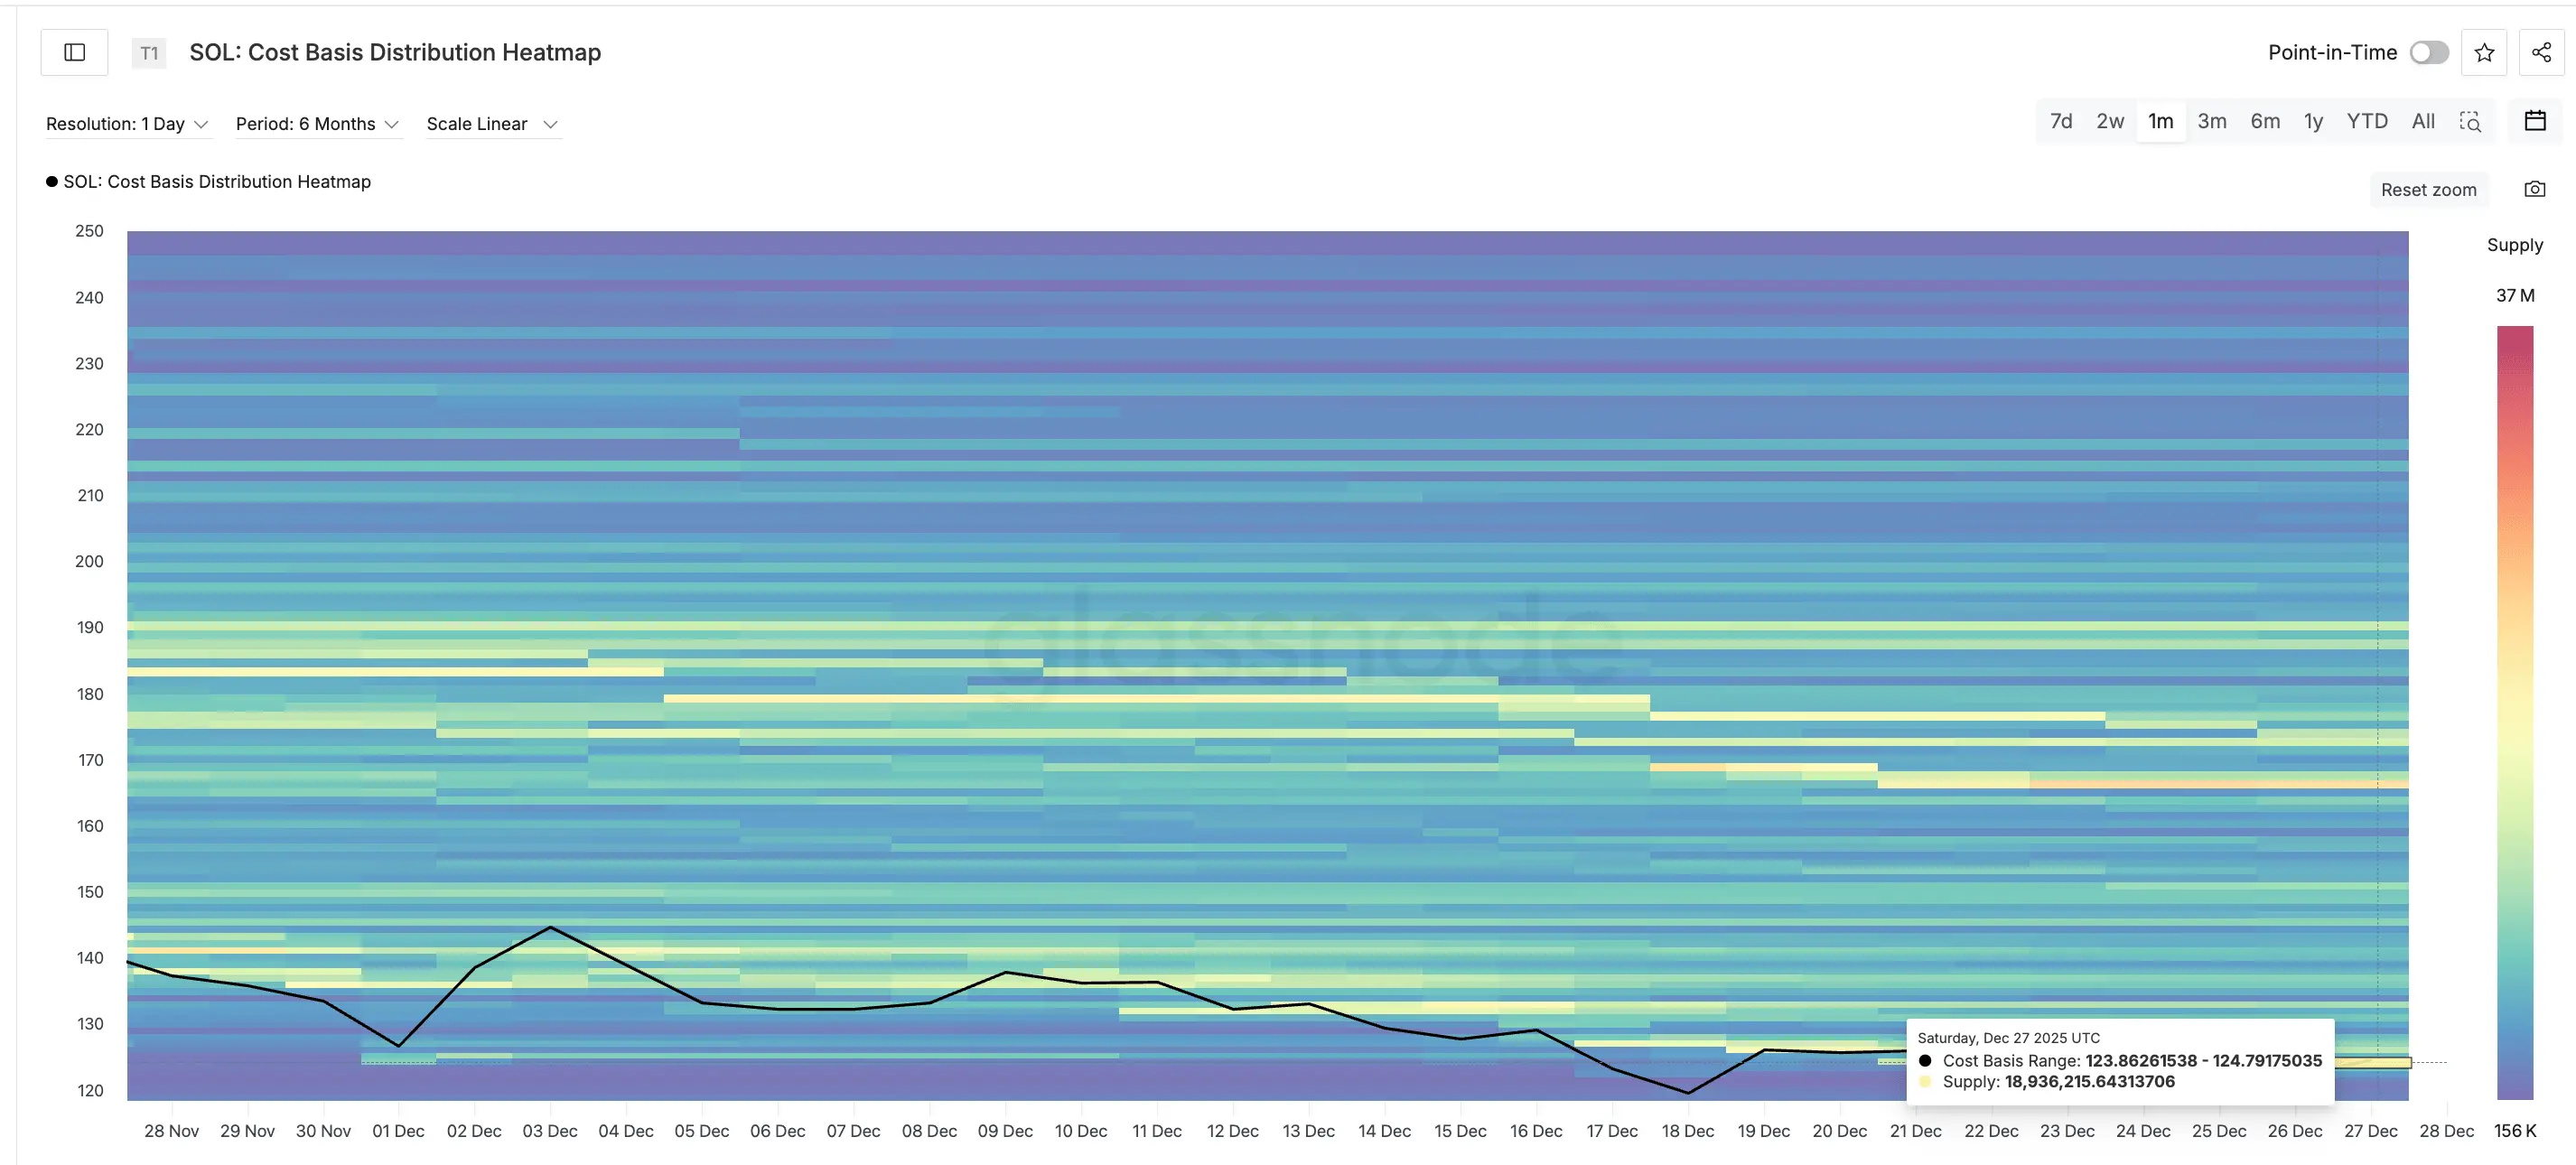 Solana Heatmap | Source: GlassnodeOn the downside, $116 is the key support zone. Losing this level would break the “December decline, January rise” pattern, risking further deep declines. A confirmed bearish EMA crossover combined with a break below $116 would reset expectations for this month.
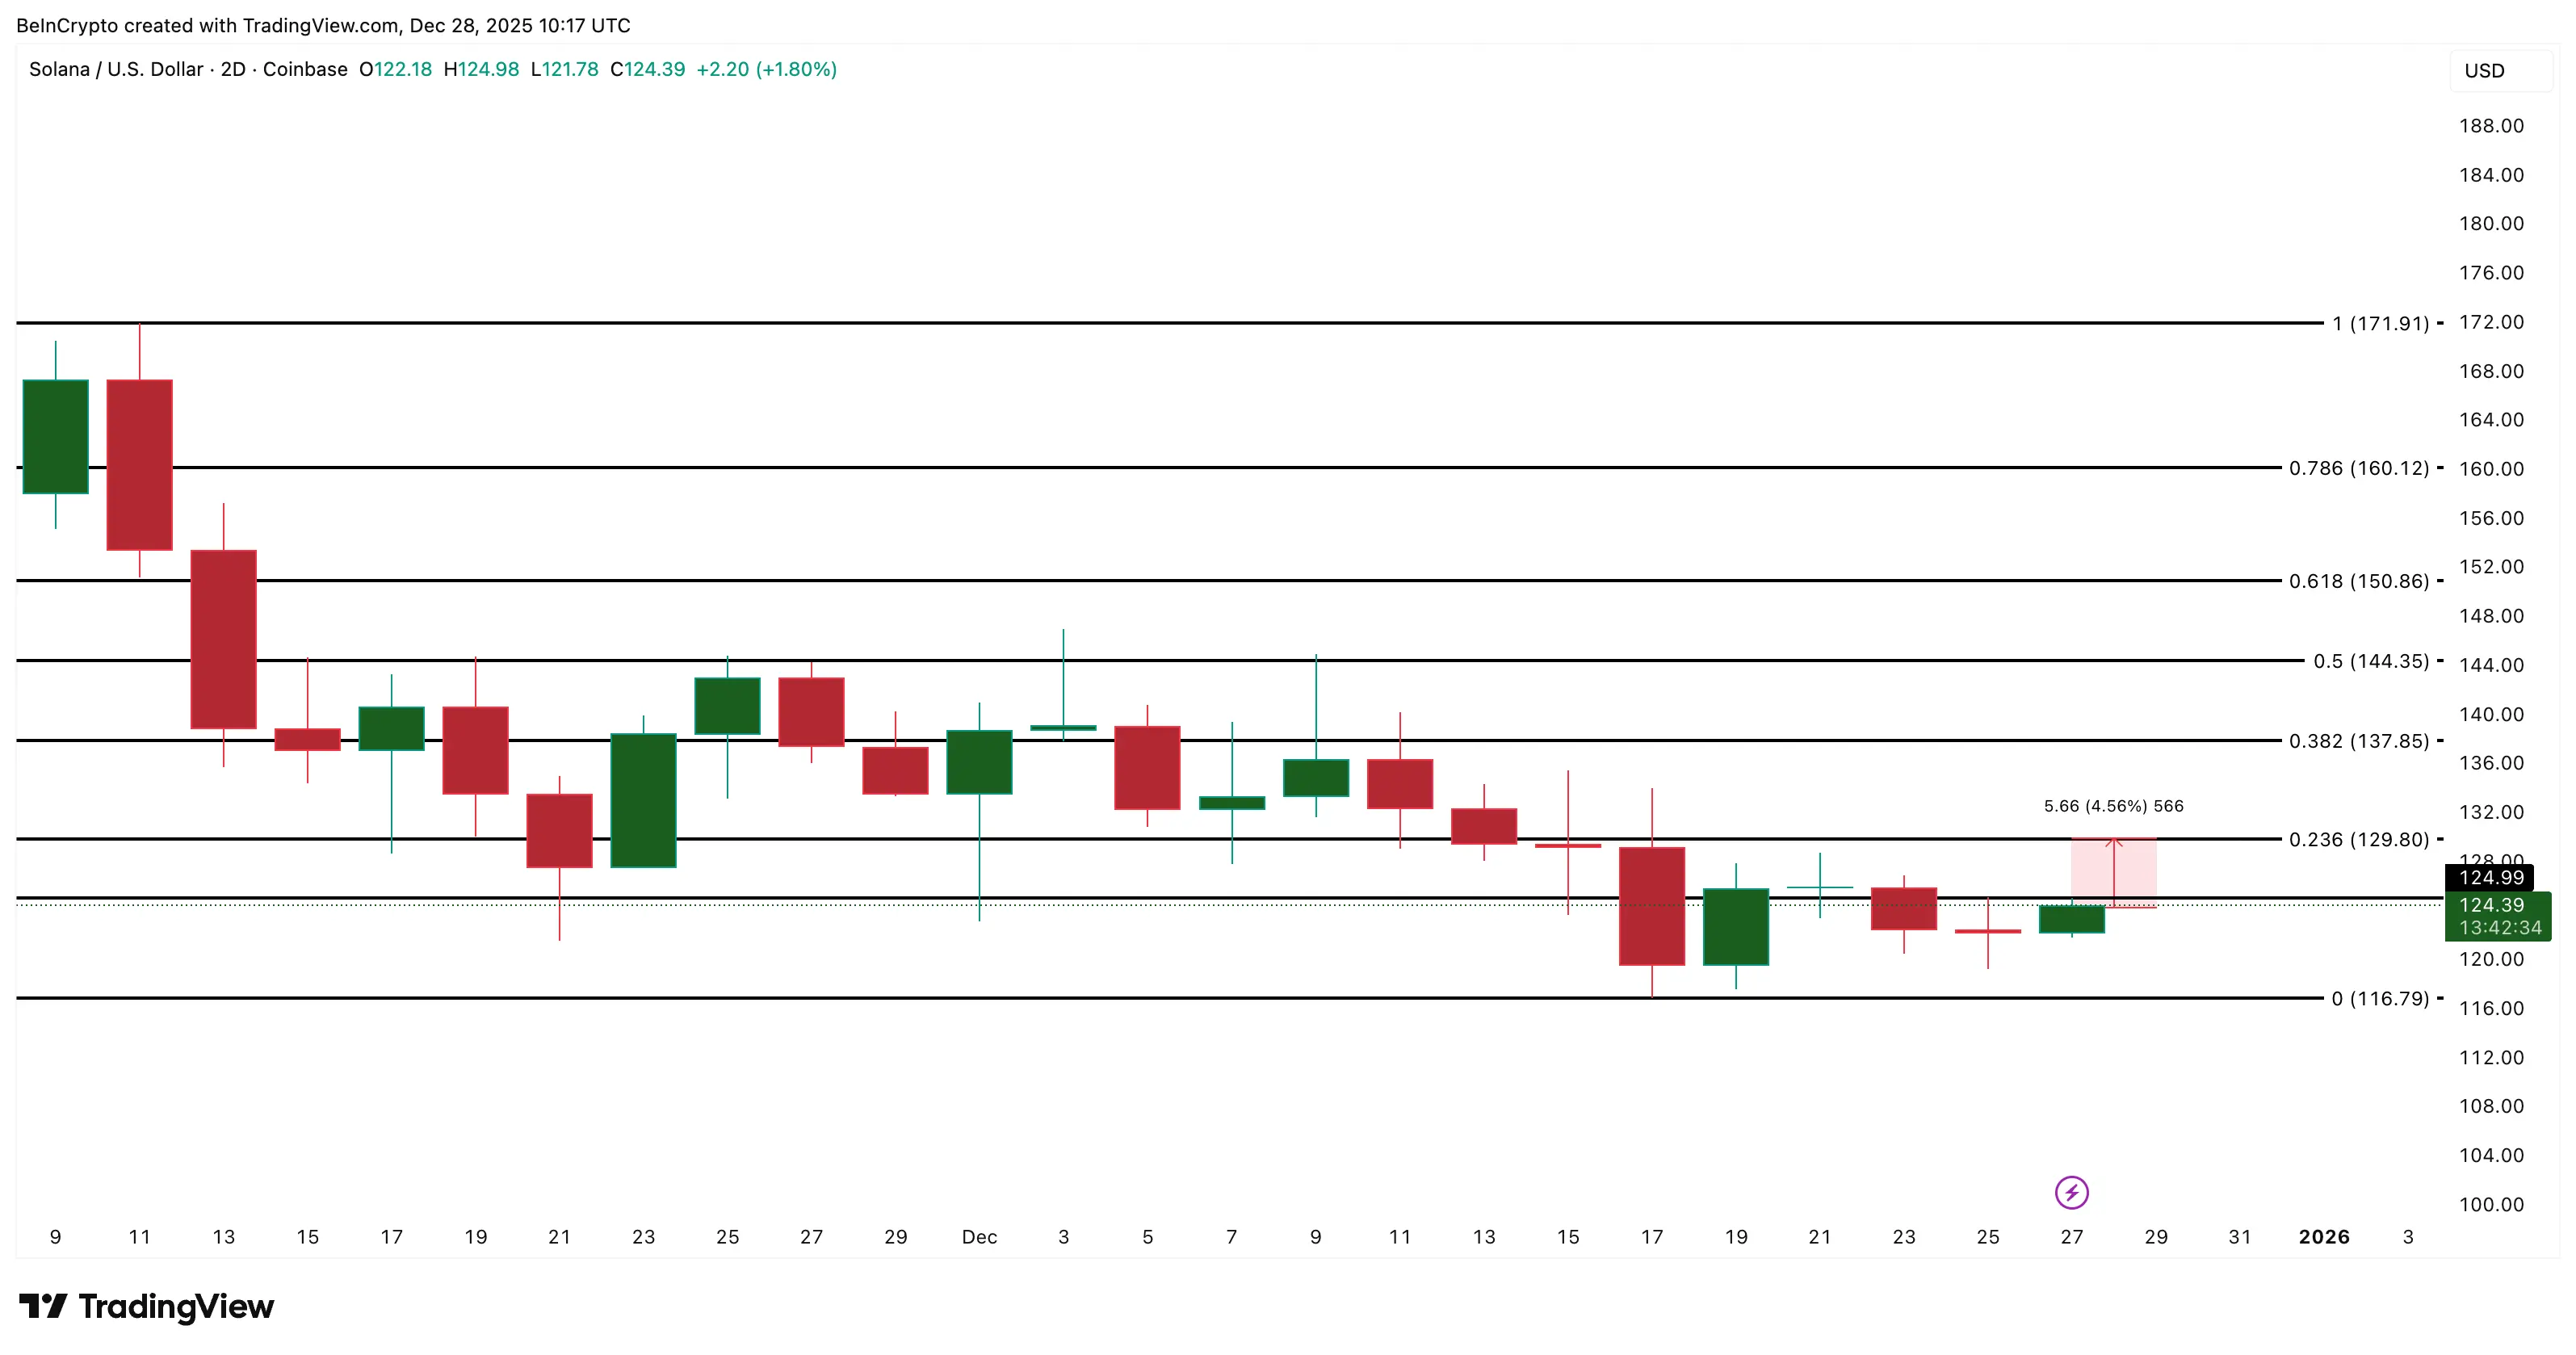 Solana price analysis | Source: TradingViewCurrently, Solana’s trading is defined by two critical levels: above $129, bullish momentum opens opportunities toward $150 and $171. Below $116, buyers lose control, and the usual strength seen in January may not materialize.
Disclaimer: The information on this page may come from third parties and does not represent the views or opinions of Gate. The content displayed on this page is for reference only and does not constitute any financial, investment, or legal advice. Gate does not guarantee the accuracy or completeness of the information and shall not be liable for any losses arising from the use of this information. Virtual asset investments carry high risks and are subject to significant price volatility. You may lose all of your invested principal. Please fully understand the relevant risks and make prudent decisions based on your own financial situation and risk tolerance. For details, please refer to
Disclaimer.