
Date: Wed, Dec 31, 2025 | 03:40 PM GMT
As the final hours of 2025 approach, the broader cryptocurrency market is showing modest strength. Both Bitcoin (BTC) and Ethereum (ETH) are trading slightly in the green, helping ease recent volatility and stabilize overall market sentiment. This calmer environment has allowed select altcoins — including Plasma (XPL) — to begin forming constructive technical setups after extended periods of downside pressure.
XPL is starting to attract attention with an impressive 11% daily jump, trimming its 60-day decline to roughly 43%. While the broader trend still reflects recovery mode, the more important signal is emerging on the daily chart, where price action is beginning to suggest a meaningful structural shift. If confirmed, this setup could mark the early stages of a bullish continuation heading into the new year.
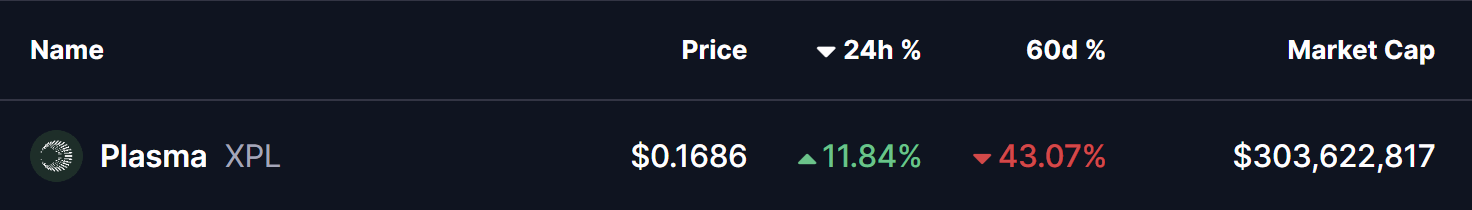
Source: Coinmarketcap
Rounding Bottom in Play
On the daily timeframe, XPL appears to be forming a textbook rounding bottom pattern — a classic bullish reversal structure that typically develops after a prolonged downtrend. This pattern reflects a slow but steady transition from selling dominance to accumulation, as bearish momentum fades and buyers gradually regain control.
Earlier in the trend, XPL faced strong rejection near the $0.3321 neckline zone, triggering a sharp decline that extended through November and December. That sell-off ultimately found a floor near the $0.1152 level, which has since proven to be a critical demand zone. Repeated defenses of this area prevented further downside and laid the foundation for a potential trend reversal.
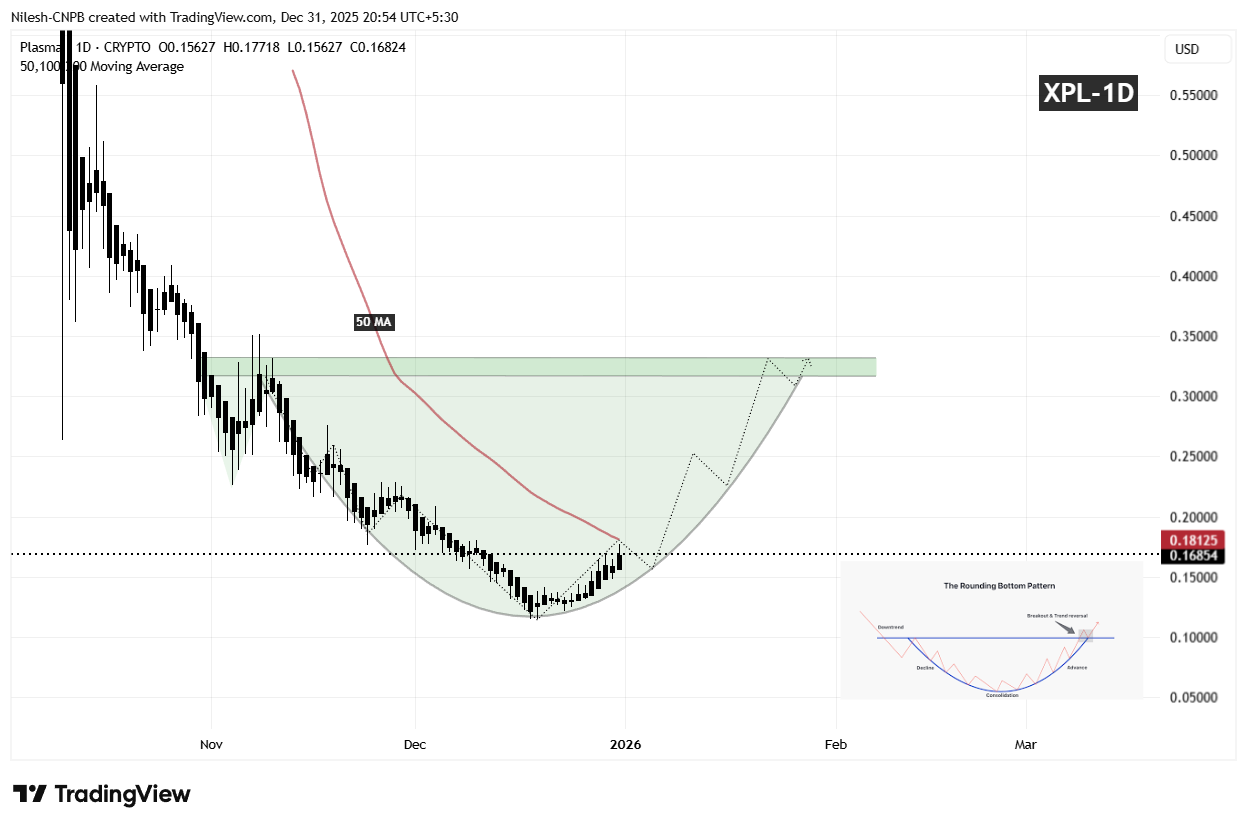
XPL Daily Chart/Coinsprobe (Source: Tradingview)
Since establishing that base, XPL has begun to curve higher in a rounded fashion, mirroring the classic structure of a developing bottom. This gradual recovery suggests that selling pressure is no longer aggressive, and that accumulation is taking place beneath the surface. The recent push back above the $0.16 region further reinforces the idea that buyers are positioning ahead of a larger directional move.
What’s Next for XPL?
For the rounding bottom pattern to gain confirmation, XPL needs to reclaim the 50-day moving average, currently positioned near the $0.1812 level. A sustained move above this area would signal a clear momentum shift and indicate that bulls are regaining control after months of corrective price action.
Looking higher, the most significant technical barrier remains the neckline resistance around $0.3321, highlighted by the prior distribution zone on the chart. A clean breakout above this region would validate the entire reversal structure and could open the door for a broader bullish expansion phase, with momentum traders and sidelined participants likely re-entering the market.
Until those levels are reclaimed, the pattern remains in its development phase. Short-term consolidation or minor pullbacks remain possible if price struggles near the 50-day moving average. However, as long as XPL continues to hold higher lows above the $0.1152 base, the broader bottoming structure remains intact.
Overall, XPL is approaching a technically important inflection point. The emerging rounding bottom formation, improving price structure, and proximity to key resistance levels suggest the coming sessions could prove decisive for Plasma’s next major directional move as the market transitions into 2026.
Disclaimer: The views and analysis presented in this article are for informational purposes only and reflect the author’s perspective, not financial advice. Technical patterns and indicators discussed are subject to market volatility and may or may not yield the anticipated results. Investors are advised to exercise caution, conduct independent research, and make decisions aligned with their individual risk tolerance.
About Author: Nilesh Hembade is the Founder and Lead Author of Coinsprobe, with over 5 years of experience in the cryptocurrency and blockchain industry. Since launching Coinsprobe in 2023, he has been providing daily, research-driven insights through in-depth market analysis, on-chain data, and technical research.

Disclaimer: The information on this page may come from third parties and does not represent the views or opinions of Gate. The content displayed on this page is for reference only and does not constitute any financial, investment, or legal advice. Gate does not guarantee the accuracy or completeness of the information and shall not be liable for any losses arising from the use of this information. Virtual asset investments carry high risks and are subject to significant price volatility. You may lose all of your invested principal. Please fully understand the relevant risks and make prudent decisions based on your own financial situation and risk tolerance. For details, please refer to
Disclaimer.
Related Articles
Zcash Holds Key Support After 18% Drop From Weekly Peak
Key Insights:
The Zcash price dropped over 18% to $232, now testing a key trendline support that may determine short-term direction and potential recovery strength.
Bullish RSI divergence and a green Supertrend suggest weakening selling pressure, with upside targets at $265 and $300 if suppo
CryptoNewsLand9m ago
ETH drops 0.85% in 15 minutes: liquidity tightening and leveraged liquidations resonate, causing a short-term pullback
From 17:45 to 18:00 (UTC) on March 26, 2026, ETH prices briefly declined within the range of 2045.86 to 2066.97 USDT. The 15-minute return was -0.85%, with a volatility of 1.02%. This fluctuation drew market attention, as the volatility was significantly higher than usual, indicating increased uncertainty about ETH's short-term trend.
The main drivers of this movement were liquidity tightening, characterized by a sharp drop in active addresses and large institutional staking. On March 25, the number of on-chain active addresses for ETH decreased by 10%.
GateNews38m ago
BTC drops 0.69% over 15 minutes: Options expiration adjustments and risk aversion amplify short-term pressure
On March 26, 2026, from 17:45 to 18:00 (UTC), Bitcoin (BTC) experienced a -0.69% return within 15 minutes, with a price range of $68,385.8 to $68,956.2 USDT and an amplitude of 0.83%. Short-term volatility increased, market attention rapidly heightened, showing concentrated downward pressure.
The main driver of this movement was the approaching options expiration, with related position investors adjusting short-term holdings in response to the "maximum pain" zone ($75,000–$80,000), combined with the put/call ratio of options.
GateNews38m ago
Ondo (ONDO) Price Is Stuck – So Why Are the Biggest Players Buying More?
The Ondo price remains stable at about $0.25 despite increasing trading volume, indicating potential accumulation rather than weakness. Institutional interest in tokenized assets may lead to long-term demand, although the price isn't fully reflecting its underlying growth yet.
CaptainAltcoin40m ago
Cardano Holds Near Key Support as Weak Data Signals Further Pressure
Key Insights
Cardano trades near $0.25 after a weekly decline, while geopolitical tensions and weak market sentiment continue to reduce investor confidence and participation.
Open interest and funding rates signal bearish positioning, as declining participation and negative rates reflect
CryptoNewsLand59m ago
XRP Price Holds Near $1.44 as Whale Activity Weakens
XRP price remains stable around $1.44 after a failed attempt to breach $1.60, driven by increased smaller wallet activity and reduced whale participation. Trading metrics indicate softer demand and neutral market momentum, reflecting balanced conditions.
CryptoNewsLand59m ago
