Date: Mon, Dec 29, 2025 | 06:36 AM GMT
The broader cryptocurrency market has kicked off the final week of 2025 with modest strength, as Bitcoin (BTC) reclaimed the $90,000 mark while Ethereum (ETH) trades over 3% higher. This improving backdrop has helped stabilize market sentiment, allowing notable altcoins — including Aptos (APT)— to begin forming constructive technical structures.
APT is trading with a modest intraday gain, but more importantly, its daily chart is now signaling a meaningful structural shift — one that could mark the early stages of a bullish continuation if confirmed.
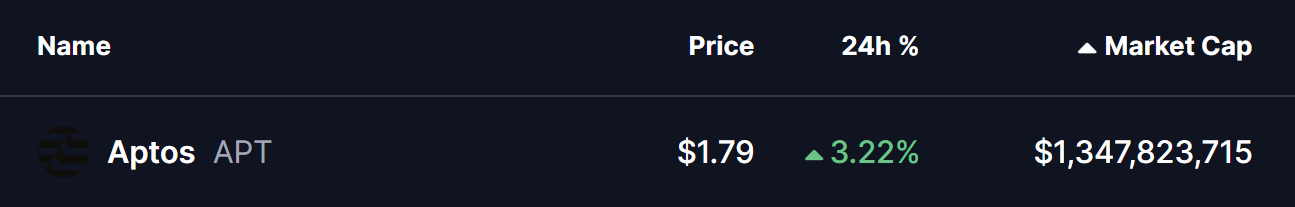
Source: Coinmarketcap
Rounding Bottom in Play
On the daily timeframe, Aptos appears to be shaping a textbook rounding bottom formation — a classic bullish reversal pattern that typically emerges after an extended period of downside pressure. This structure reflects a gradual transition from distribution to accumulation, where sellers lose control and buyers quietly begin to step in.
APT previously faced strong rejection near the $3.08 neckline zone before entering a sharp decline that eventually bottomed out near $1.42. This area acted as a critical demand zone, where price repeatedly found support, preventing any deeper breakdown and laying the groundwork for a potential trend reversal.
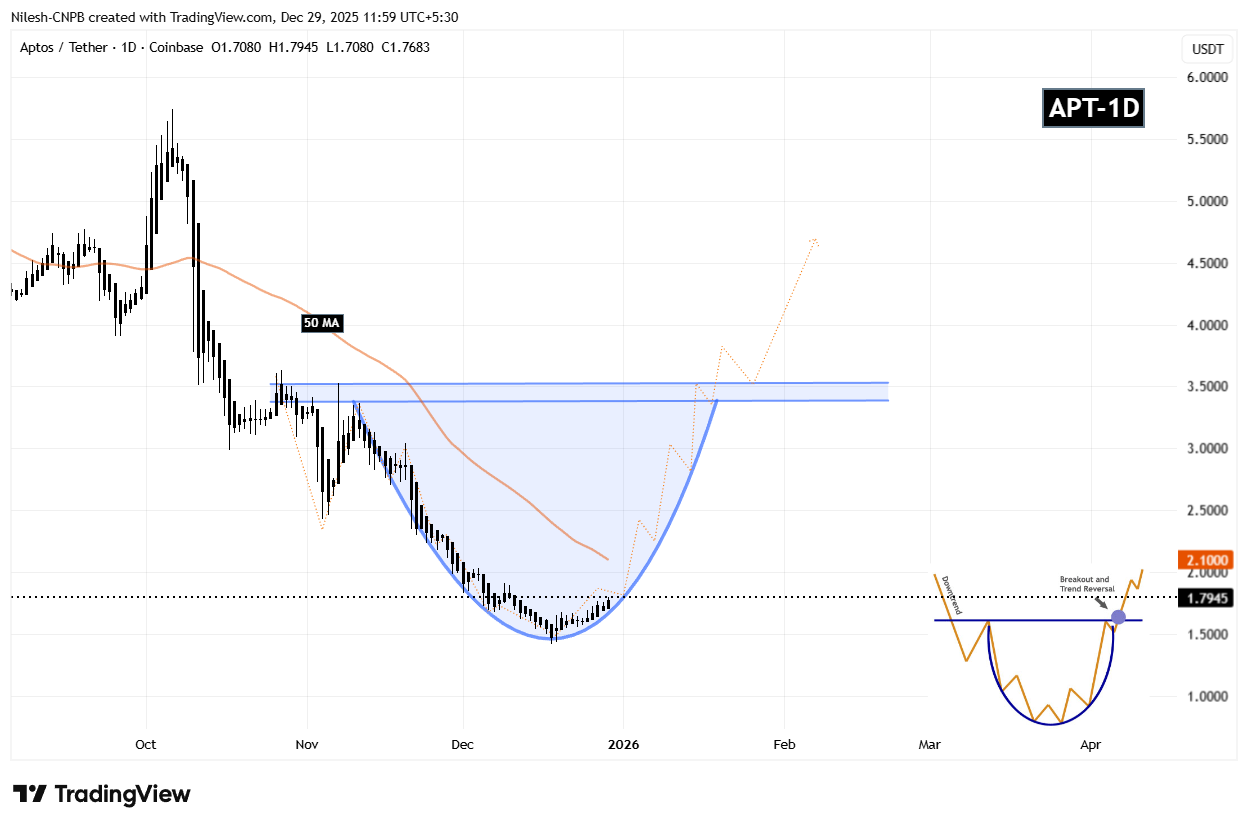
Aptos (APT) Daily Chart/Coinsprobe (Source: Tradingview)
Since establishing that base, APT has begun curving higher in a rounded fashion, signaling that selling pressure is fading. The steady recovery back toward the $1.79 region suggests that accumulation is underway and that the market is slowly preparing for a larger move.
What’s Next for APT?
For the rounding bottom pattern to fully activate, APT must reclaim the 50-day moving average, currently positioned near $2.10. A decisive move above this level would mark a key momentum shift, confirming that buyers are regaining control after months of corrective price action.
Beyond that, the major technical hurdle remains the neckline resistance around $3.08. A clean breakout above this zone would validate the entire reversal structure and could open the door for a broader bullish expansion phase, with momentum traders likely re-entering the market.
Until those levels are reclaimed, the pattern remains in development. Short-term pullbacks or consolidation are still possible if APT struggles at the 50-day MA, but as long as price continues to hold higher lows above the $1.42 base, the broader bottoming structure remains intact.
Overall, Aptos is approaching a technically important inflection point. The rounding bottom formation, improving structure, and proximity to key resistance levels suggest the coming sessions could prove decisive for the token’s next directional move.
Disclaimer: The views and analysis presented in this article are for informational purposes only and reflect the author’s perspective, not financial advice. Technical patterns and indicators discussed are subject to market volatility and may or may not yield the anticipated results. Investors are advised to exercise caution, conduct independent research, and make decisions aligned with their individual risk tolerance.
About Author: Nilesh Hembade is the Founder and Lead Author of Coinsprobe, with over 5 years of experience in the cryptocurrency and blockchain industry. Since launching Coinsprobe in 2023, he has been providing daily, research-driven insights through in-depth market analysis, on-chain data, and technical research.

Disclaimer: The information on this page may come from third parties and does not represent the views or opinions of Gate. The content displayed on this page is for reference only and does not constitute any financial, investment, or legal advice. Gate does not guarantee the accuracy or completeness of the information and shall not be liable for any losses arising from the use of this information. Virtual asset investments carry high risks and are subject to significant price volatility. You may lose all of your invested principal. Please fully understand the relevant risks and make prudent decisions based on your own financial situation and risk tolerance. For details, please refer to
Disclaimer.
Related Articles
CFX 4-hour chart reaches a new high for the phase, with approximately 14% increase over 24 hours
Gate News: On March 15, market data shows that CFX reached a new phase high on the 4-hour K-line chart, with prices touching approximately 0.06282 USDT at their peak, representing a 24-hour gain of around 14%. Some community members believe this rally may be related to recent macroeconomic catalysts. Earlier, media outlets citing sources reported that Iran is considering allowing certain tankers to pass through the Strait of Hormuz on the condition that petroleum transport be settled in Chinese yuan. Related discussions have once again sparked market attention toward yuan stablecoins and cross-border payment narratives.
GateNews9m ago
After the network upgrade: What prospects await SOL?
The official approval of protocol SIMD-0266 aims to optimize computing efficiency on the Solana network by introducing p-tokens, simplifying transaction processing. This upgrade, set for April, has prompted increased buying activity and could lead to significant cost reductions and performance improvements.
TapChiBitcoin1h ago
Track FET's journey to the $0.24 milestone as the AI cryptocurrency sector records its most positive trading week in months
The cryptocurrency industry related to AI has recently recorded an impressive performance. According to data from CoinMarketCap, the total market capitalization of this sector has grown 16% in just the past week. Many leading tokens in this category have also achieved significant growth, attracting
TapChiBitcoin1h ago
DeFi enters a "winter of yields": liquidity stagnation, leverage contraction, and the disappearance of arbitrage opportunities
Since September 2025, the DeFi market has entered a "interest rate winter," with the annualized deposit yields of mainstream stablecoins dropping to lows, and supply and demand imbalances causing excess liquidity. As borrowing demand declines, stablecoin lending rates have also decreased, and the reduced risk appetite in the crypto market has led investors to shift toward more stable assets. Some protocols, such as Sky, offer stable returns through real-world assets, but the overall trend still indicates a period of adjustment and structural reform in DeFi.
区块客1h ago
Crypto Analyst and Expert Says Bull Market Is Confirmed as Bitcoin Survives Shakeout
Crypto analyst and expert says bull market is confirmed.
Bitcoin survives a shakeout nd mirrors 2022 price chart.
This shows a positive sign for BTC to set a new ATH price soon.
The crypto market seems to be heading into a strong recovery phase as the price of Bitcoin (BTC) recovers pr
CryptoNewsLand2h ago
Crypto Market Shows Gradual Growth As Top Assets Turn Green
The global crypto market saw a slight increase in total capitalization, while trading volume dropped significantly. Bitcoin and Ethereum prices rose modestly, with notable gains from altcoins like $DOGS, $PI, and $PEPE. DeFi TVL rose slightly, but NFT sales volume fell sharply. Key developments included new investments in gold-related tokens and Aave's launch of Aave Shield to reduce transfer slippage.
BlockChainReporter2h ago