Date: Sun, Dec 28, 2025 | 09:40 AM GMT
The broader cryptocurrency market is showing modest strength, with both Bitcoin (BTC) and Ethereum (ETH) trading in the green. This steady performance among major assets has helped stabilize overall sentiment, allowing select memecoins — including SPX6900 (SPX) — to begin showing constructive technical setups.
SPX is trading with a modest intraday gain, but more importantly, its price structure is starting to reflect a classic bullish reversal pattern. After weeks of sustained downside pressure, buyers appear to be stepping back in at key levels, hinting that the worst of the correction may already be behind.

Source: Coinmarketcap
Double Bottom Pattern in Play
On the daily timeframe, SPX is forming a double bottom pattern — a widely followed bullish reversal structure that often appears near the end of prolonged downtrends. The first bottom formed in November when SPX dropped toward the $0.45 region, followed by a recovery that carried price back toward the neckline resistance near $0.7389 in early December.
That recovery attempt, however, was rejected, sending SPX back down to retest the same $0.45 support zone. Importantly, sellers failed to push price meaningfully lower on this second attempt. Instead, SPX printed another strong reaction from the same demand area and has since rebounded to trade around $0.5045.
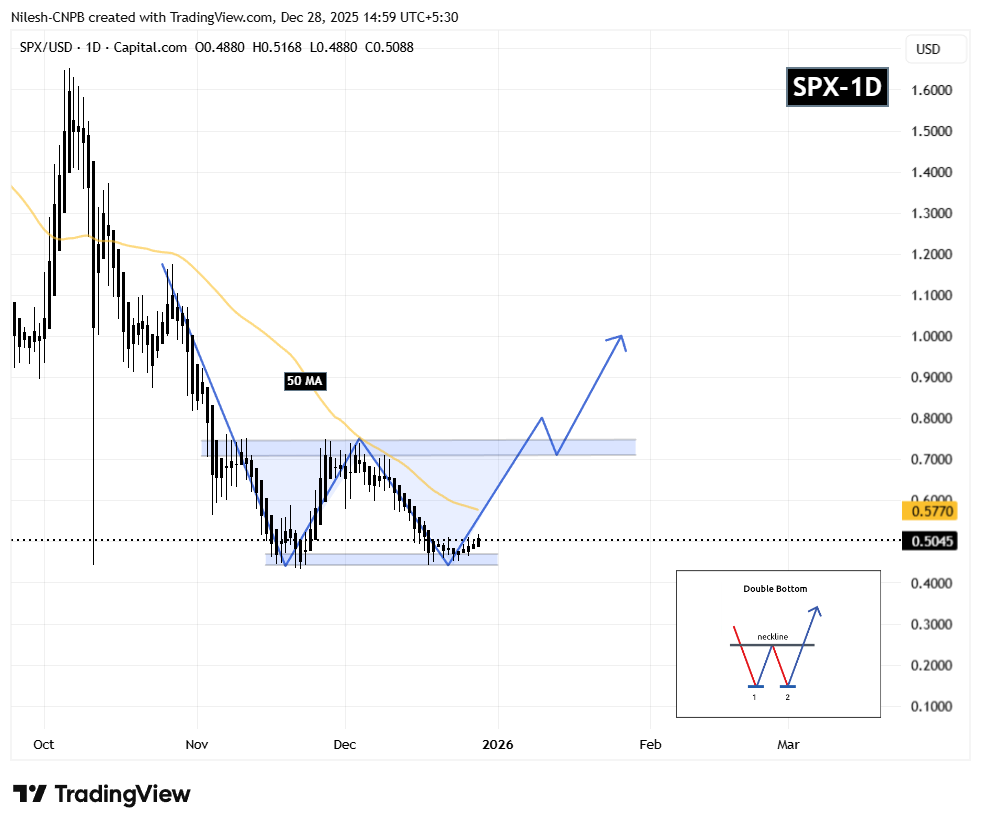
SPX6900 (SPX) Daily Chart/Coinsprobe (Source: Tradingview)
This repeated defense of the same support level is a critical technical signal. It suggests that selling pressure is weakening while buyers are gradually absorbing supply — a behavior typically seen during accumulation phases before trend reversals.
What’s Next for SPX?
For the bullish structure to strengthen, SPX must reclaim the 50-day moving average, currently positioned near $0.5770. A sustained move above this level would mark an important shift in short-term momentum and increase the probability of a continued recovery toward the neckline resistance at $0.7389.
A decisive breakout above the neckline — ideally followed by a successful retest — would confirm the full activation of the double bottom pattern. In that scenario, the technical projection points toward a potential upside target near $1.02, representing a significant expansion from current price levels.
Until then, the $0.45 support zone remains the most important level to watch. As long as SPX continues to hold above this area, the broader bullish setup stays intact and allows room for further upside attempts.
Overall, SPX’s structure appears constructive. The presence of a double bottom, repeated demand at identical lows, and proximity to the 50-day moving average suggest that this could be a pivotal moment as the token attempts to transition from accumulation into a new expansion phase.
Disclaimer: The views and analysis presented in this article are for informational purposes only and reflect the author’s perspective, not financial advice. Technical patterns and indicators discussed are subject to market volatility and may or may not yield the anticipated results. Investors are advised to exercise caution, conduct independent research, and make decisions aligned with their individual risk tolerance.
About Author: Nilesh Hembade is the Founder and Lead Author of Coinsprobe, with over 5 years of experience in the cryptocurrency and blockchain industry. Since launching Coinsprobe in 2023, he has been providing daily, research-driven insights through in-depth market analysis, on-chain data, and technical research.

Disclaimer: The information on this page may come from third parties and does not represent the views or opinions of Gate. The content displayed on this page is for reference only and does not constitute any financial, investment, or legal advice. Gate does not guarantee the accuracy or completeness of the information and shall not be liable for any losses arising from the use of this information. Virtual asset investments carry high risks and are subject to significant price volatility. You may lose all of your invested principal. Please fully understand the relevant risks and make prudent decisions based on your own financial situation and risk tolerance. For details, please refer to
Disclaimer.
Related Articles
BTC 15-minute decline of 0.61%: Major wallet selling pressure combined with negative US employment data triggers adjustment
Between 2026-03-12 14:15 and 14:30 (UTC), BTC price declined from 70660.0 USDT to 69917.2 USDT, with a 15-minute return rate of -0.61% and volatility reaching 1.06%. Trading volume increased sequentially, with market attention rising notably, and heightened fluctuations triggering alerts among short-term traders.
The primary driver of this price movement was on-chain whale wallets concentrating approximately 2,100 BTC inflows to exchanges within a short timeframe, representing an 18% increase compared to the previous period. Large holders' active position adjustments and concurrent large sell orders in spot and perpetual markets were simultaneously released.
GateNews11m ago
Stablecoin neo EURO captures only 0.35% of market supply
Stablecoins pegged to the EURO only represent 0.35% of total supply and less than 0.1% of total global trading volume, demonstrating limited market liquidity significance compared to USD stablecoins. Notable EURO stablecoins include EURC, EURCV, AEUR, EURI, and EURe.
TapChiBitcoin17m ago
ETH 15-minute rise of 0.72%: On-chain capital inflows and bullish sentiment dominating the market
2026-03-12 14:00 to 2026-03-12 14:15 (UTC), ETH spot price showed rapid upward movement with a 15-minute return rate of +0.72%, price range between 2065.45 to 2082.77 USDT, and overall volatility of 0.84%. During this market fluctuation, market attention increased, trading volume rose sequentially, and unilateral buy-side orders drove market sentiment to remain bullish.
The main driver of this price movement was large-scale on-chain capital inflows and the linkage effect between spot and futures markets. On-chain data shows multiple high-net-worth wallets
GateNews27m ago
Altcoin About to 10x? History Is Literally Repeating Itself
Crypto analysts suggest the altcoin market may be entering another expansion phase, similar to patterns seen in past rallies. While investor interest grows, indicators show the altcoin cycle hasn't begun yet, with high Bitcoin dominance and a low Altcoin Season Index.
Coinfomania41m ago
Bitcoin Trades Narrow Range As Resistance Holds Near $71K
Bitcoin is trading around $70,335, showing a 2.13% decline in 24 hours. Analysts note a resistance near $71,400 and a consolidation phase, with traders awaiting a decisive breakout above or below established support and resistance levels.
CryptoBreaking49m ago
$0 XRP ETF Netflow Might Be Positive for Price Rebound - U.Today
XRP ETFs reported $0 netflow in 24 hours, indicating a halt in intensive institutional sell-offs after three days. This stability suggests potential accumulation and a price rebound, despite recent stagnation between $1.37 and $1.41.
UToday1h ago