
**Date: **Sat, Jan 03, 2026 | 06:10 AM GMT
As the 2026 kicks off, the broader cryptocurrency market is showing renewed stability. Bitcoin (BTC) and Ethereum (ETH) are both trading slightly in the green, with ETH posting gains of over 3% today. This steady performance among major assets has helped improve overall market sentiment, allowing select altcoins — including Bitcoin Cash (BCH) — to form constructive technical setups.
Bitcoin Cash is already responding positively, jumping nearly 5% on the day. However, beyond the short-term price move, the daily chart reveals a much more important development. BCH appears to be completing a classic reversal structure, hinting that the recent strength may be the early stage of a larger trend shift rather than just a temporary bounce.
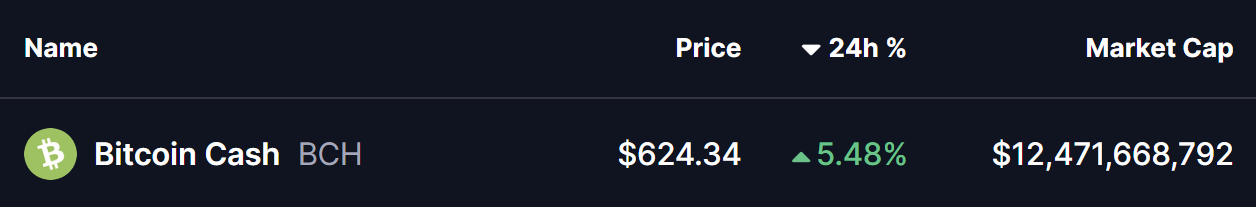
Source: Coinmarketcap
Rounding Bottom in Play?
On the daily timeframe, Bitcoin Cash is forming a rounding bottom pattern, a well-known bullish reversal formation that signals a gradual transition from selling pressure to sustained accumulation. Unlike sharp V-shaped reversals, rounding bottoms reflect patience from buyers and fading control from sellers over an extended period.
This structure began taking shape after BCH faced a strong rejection near the $630 level in September 2025. That rejection triggered a sharp sell-off, pushing price down to the $446.9 region. Crucially, bears failed to force a deeper breakdown. Instead, strong demand emerged, price stabilized, and volatility gradually compressed — laying the foundation for the rounded base visible on the chart.
As weeks passed, BCH began to print higher lows, slowly curving upward and completing the bottoming structure. The recovery has now brought price back toward the $600–$630 resistance zone, which marks the neckline of the rounding bottom and represents a key decision area for the trend.
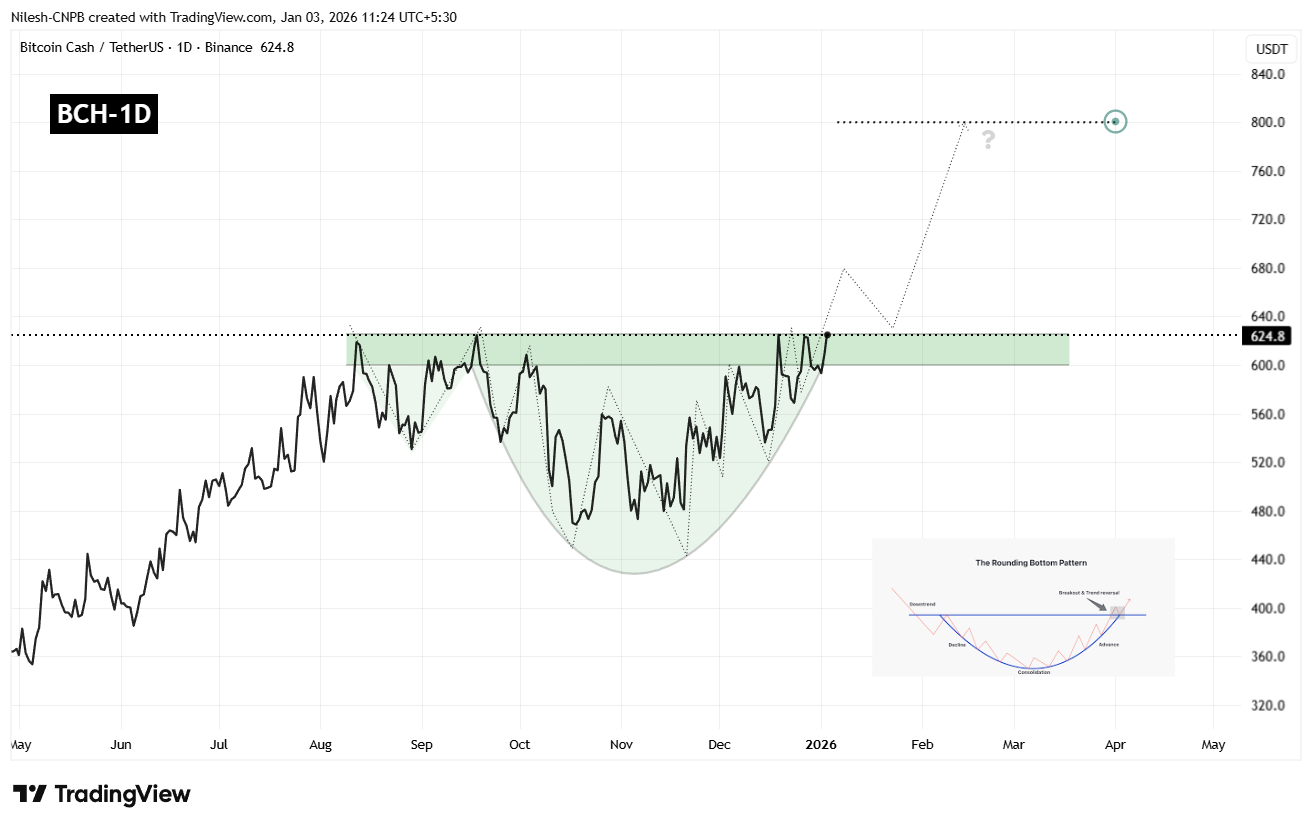
Bitcoin Cash (BCH) Daily Chart/Coinsprobe (Source: Tradingview)
Key Resistance in Focus
At present, BCH is trading near $624, repeatedly testing the $600–$630 zone. This area has historically acted as a supply zone, rejecting price advances multiple times in the past. A decisive daily close above this range would confirm a bullish breakout and signal a shift in market structure.
If bulls manage to push through this resistance and flip it into support, it would strongly validate the rounding bottom pattern and open the door for a continuation rally.
What’s Next for BCH?
A confirmed breakout above $630, followed by a successful retest of the zone as support, would significantly strengthen the bullish outlook. Based on the depth of the rounding bottom formation, the measured upside target points toward the $800–$820 region.
Reaching that level would represent a potential upside of approximately 27% from current prices, aligning well with historical behavior following similar rounding bottom breakouts.
That said, patience remains essential. Before a clean breakout occurs, BCH could still see short-term pullbacks — potentially toward the rising base of the rounded structure or near-term moving averages, which have acted as dynamic support during the recovery. Such retracements would not invalidate the bullish setup as long as price continues to hold above higher low levels.
For now, the $600–$630 zone remains the line in the sand. How BCH behaves around this resistance in the coming sessions will likely determine whether it enters a sustained bullish phase or remains range-bound a bit longer.
Disclaimer: The views and analysis presented in this article are for informational purposes only and reflect the author’s perspective, not financial advice. Technical patterns and indicators discussed are subject to market volatility and may or may not yield the anticipated results. Investors are advised to exercise caution, conduct independent research, and make decisions aligned with their individual risk tolerance.
About Author: Nilesh Hembade is the Founder and Lead Author of Coinsprobe, with over 5 years of experience in the cryptocurrency and blockchain industry. Since launching Coinsprobe in 2023, he has been providing daily, research-driven insights through in-depth market analysis, on-chain data, and technical research.
Disclaimer: The information on this page may come from third parties and does not represent the views or opinions of Gate. The content displayed on this page is for reference only and does not constitute any financial, investment, or legal advice. Gate does not guarantee the accuracy or completeness of the information and shall not be liable for any losses arising from the use of this information. Virtual asset investments carry high risks and are subject to significant price volatility. You may lose all of your invested principal. Please fully understand the relevant risks and make prudent decisions based on your own financial situation and risk tolerance. For details, please refer to
Disclaimer.
Related Articles
A whale withdrew 217.7 BTC from a certain CEX half an hour ago, accumulating 2634.7 BTC over 14 days.
Gate News reported that on March 17, on-chain data shows that a certain whale/institution withdrew 217.7 BTC from a certain CEX half an hour ago, valued at $16.04 million. This address has been continuously withdrawing BTC from the exchange since March 3, accumulating a total of 2634.7 BTC over 14 days (total value of $186 million), with an average cost of $70,805 per coin, and currently has unrealized gains of $9.05 million.
GateNews10m ago
Today Bitcoin ETF net inflows of 2,955 BTC, Ethereum ETF net inflows of 7,894 ETH
Gate News report: On March 17, according to Lookonchain monitoring, as of press time, Bitcoin ETF net inflows reached 2,955 BTC (valued at $219 million), Ethereum ETF net inflows reached 7,894 ETH (valued at $18.5 million), and SOL ETF net inflows reached 24,020 SOL (valued at $2.27 million).
GateNews11m ago
Today, US Bitcoin ETF net inflow was 2955 BTC, Ethereum ETF net inflow was 7894 ETH
Gate News reported that on March 17, according to Lookonchain monitoring, today's US Bitcoin ETF net inflows were 2955 BTC, Ethereum ETF net inflows were 7894 ETH, and Solana ETF net inflows were 24020 SOL.
GateNews11m ago
Bitcoin’s Rally Hits a Wall Near $76K — Breakout or Breakdown Next?
Over the last hour, bitcoin traded at $73,859 to $74,375 on Tuesday, with a market cap of $1.47 trillion and 24-hour volume of $55.84 trillion, while price action remained confined within a $73,143 to $75,937 range. Across the 1-hour, 4-hour, and daily charts, the price structure reflected
Coinpedia14m ago
Maestro Launches Bitcoin Credit Market Mezzamine, Targeting 8%-9% Annual Yield
Bitcoin infrastructure provider Maestro launches Mezzamine, a credit market denominated in bitcoin, targeting institutional investors with new yield opportunities and expanding miner financing. In collaboration with Sazmining, the project offers an annualized yield rate of 8%-9%, aiming to address risks in traditional mining finance.
GateNews41m ago
Crypto Market News: BlackRock $107M ETHB Success Proves the Hunt for Yield Is on but Bitcoin and ...
The financial landscape in mid March 2026 has been dominated by a singular headline: BlackRock’s aggressive push into the decentralized yield space. With the massive rollout of its iShares Staked Ethereum Trust (ETHB), the world’s largest asset manager has effectively validated a core market truth i
BlockChainReporter1h ago
