
**Date: **Mon, Jan 05, 2026 | 10:58 AM GMT
As 2026 kicks off, the broader cryptocurrency market is showing renewed stability. Both Bitcoin (BTC) and Ethereum (ETH) are up more than 6% on the week, and improving sentiment is gradually spreading across major altcoins — including the DeFi heavyweight Aave (AAVE).
AAVE has gained over 8% on a weekly basis, but the more important story is unfolding beneath the surface. While short-term strength is encouraging, the bigger development lies in the broader market structure forming on the higher timeframe. Recent price action suggests a meaningful shift in behavior — one that could mark the early stages of a bullish continuation if key technical levels hold.
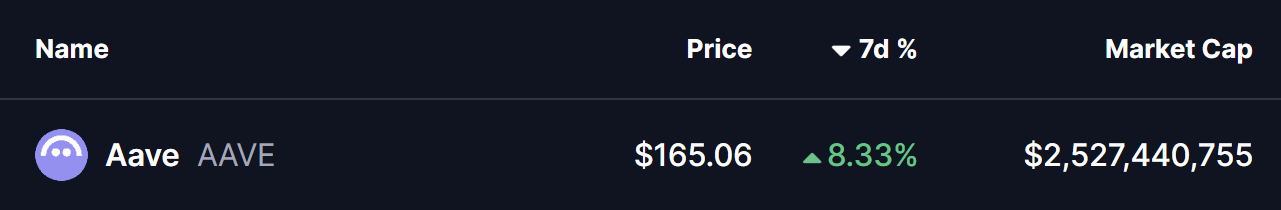
Source: Coinmarketcap
Symmetrical Triangle in Play
On the weekly chart, **AAVE **continues to trade within a symmetrical triangle, a neutral yet powerful pattern that often precedes a major volatility expansion once price approaches its apex.
The structure began forming after AAVE’s strong rally earlier in 2025. However, in August 2025, price faced firm rejection near the triangle’s descending resistance around $385, triggering a sharp corrective move. That pullback resulted in a 62% decline, eventually driving price down toward the triangle’s ascending support trendline near $143.53 last month.
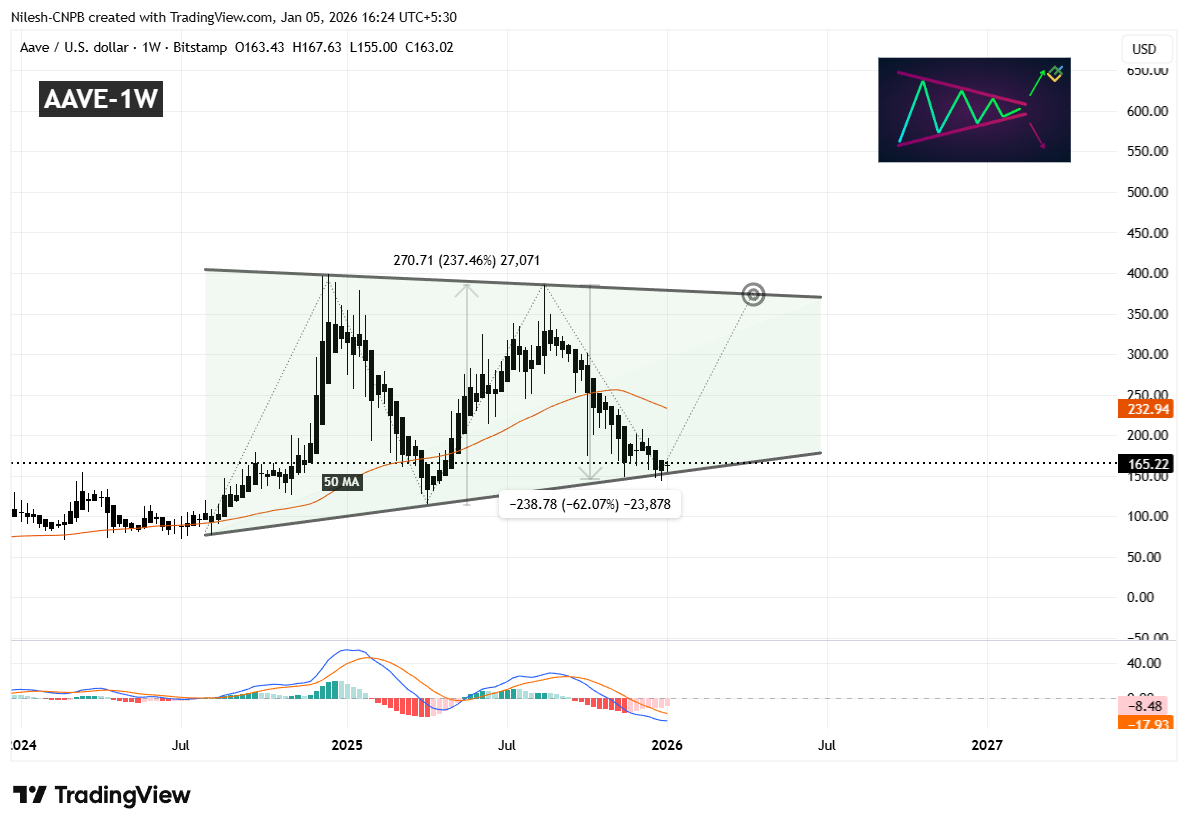
Aave (AAVE) Weekly Chart/Coinsprobe (Source: Tradingview)
Crucially, buyers once again stepped in to defend this long-term support zone. The successful reaction from this level has pushed AAVE back toward the $164 region, signaling renewed buying interest. Notably, this rebound is occurring as the MACD shows early signs of stabilization — a setup that closely resembles conditions seen before AAVE’s previous 237% rally in April 2025.
The next major technical hurdle lies at the 50-week moving average, currently positioned near $232.94. This level has acted as dynamic resistance during the recent decline, and reclaiming it would mark a meaningful shift in medium-term momentum.
What’s Next for AAVE?
If the pattern continues to develop as expected, AAVE could soon attempt a sustained move above the 50-week MA. A confirmed reclaim of this level — followed by acceptance above it — would strengthen the bullish case and increase the probability of a move toward the upper boundary of the triangle near $375.
Such a move would imply a potential upside of roughly 125% from current levels, assuming broader market conditions remain supportive and momentum continues to build.
Until then, patience remains key. Holding above the ascending support trendline is essential for preserving the bullish structure. Any sustained breakdown below this level would weaken the setup and delay the breakout thesis.
For now, the chart suggests AAVE is at a critical inflection point, where compression within the triangle could soon give way to a decisive move — with the direction likely defined by how price behaves around the 50-week moving average.
Disclaimer: The views and analysis presented in this article are for informational purposes only and reflect the author’s perspective, not financial advice. Technical patterns and indicators discussed are subject to market volatility and may or may not yield the anticipated results. Investors are advised to exercise caution, conduct independent research, and make decisions aligned with their individual risk tolerance.
About Author: Nilesh Hembade is the Founder and Lead Author of Coinsprobe, with over 5 years of experience in the cryptocurrency and blockchain industry. Since launching Coinsprobe in 2023, he has been providing daily, research-driven insights through in-depth market analysis, on-chain data, and technical research.
Disclaimer: The information on this page may come from third parties and does not represent the views or opinions of Gate. The content displayed on this page is for reference only and does not constitute any financial, investment, or legal advice. Gate does not guarantee the accuracy or completeness of the information and shall not be liable for any losses arising from the use of this information. Virtual asset investments carry high risks and are subject to significant price volatility. You may lose all of your invested principal. Please fully understand the relevant risks and make prudent decisions based on your own financial situation and risk tolerance. For details, please refer to
Disclaimer.
Related Articles
Bitcoin Price Predictions Flip Bullish, But Ethereum Is Still Stuck
Predictors have turned bullish on Bitcoin's near-term price, suggesting a rise to $84,000 before a potential drop. However, analysts remain divided on sustainability, while sentiment for Ethereum is bearish, with expectations of a decline to $1,500.
Decrypt20m ago
SHIB Faces Critical Breakout Test as Forecast Points to Short-Term 7.47% Gain
Shiba Inu (SHIB) is trading close to the support level of $0.05545, showing a recent decline but also potential for a 7.47% upside by March 2026. The price remains within established boundaries, facing key resistance at $0.055727. Future movements depend on breaking above resistance or falling below support.
CryptoNewsLand20m ago
XRP Reclaims $1.39 After $1.69M Liquidation Spike — Can Price Break $1.43 Today?
XRP has rebounded to $1.39 after an 8.2% gain, following a significant liquidation event that targeted overleveraged long positions. Current support is at $1.27, with resistance at $1.43. Market dynamics suggest cautious bullish momentum may continue, while bearish pressure could emerge if resistance fails.
CryptoNewsLand24m ago
ETH short-term decline of 1.12%: macro liquidity disturbances and whale position reduction resonance intensify volatility
On March 5, 2026, from 16:00 to 16:15 (UTC), the price of Ethereum (ETH) recorded a -1.12% return within 15 minutes, with a price range of 2056.69 to 2087.34 USDT, and an amplitude of 1.47%. Market attention during this period significantly increased, volatility intensified, mainstream coins experienced a synchronized pullback, and short-term traders engaged in frequent speculative battles.
The main driver of this fluctuation is macro-level liquidity disturbances. As the Federal Reserve's interest rate decision approaches and the U.S. non-farm payroll data is set to be released on March 6, the market shows divergence in the pace of rate cuts, prompting some short-term funds to choose
GateNews43m ago
BTC 15-minute sharp decline of 0.90%: liquidity gap area and macro risk aversion resonate, triggering short-term selling pressure
On March 5, 2026, from 16:00 to 16:15 (UTC), Bitcoin (BTC) experienced a -0.90% return within a short time window, with the price ranging from 70,800.8 to 71,653.9 USDT, and an amplitude of 1.19%. This anomaly occurred amid heightened market attention, with volatility significantly increasing, investor sentiment turning cautious, and trading volume and on-chain activity remaining high, intensifying short-term trading pressure.
The main driver of this anomaly is that BTC is in a "gap zone" — meaning liquidity above 72,000 USDT is extremely thin, with only about 1% of circulation.
GateNews43m ago
Bit Digital CEO: Ethereum has stabilized in the $1800–$2100 range, and the recent pullback is more like a "value reset"
Bit Digital CEO Sam Tabar stated that recent Ethereum market conditions resemble a "value reset," with market leverage rapidly re-evaluating after a significant increase, leading to increased volatility. Currently, the price remains stable in the $1800 to $2100 range, with fundamentals unchanged. This event demonstrates how leverage can distort the market, but Ethereum's long-term value remains solid.
GateNews1h ago

