
**Date: **Tue, Jan 06, 2026 | 11:20 AM GMT
The broader cryptocurrency market continues to show renewed strength as 2026 gets underway. Bitcoin (BTC) is up around 6% on the week, while Ethereum (ETH) has posted gains of over 8%, helping improve overall sentiment across the market. This positive momentum is now spreading into major altcoins — including** Algorand (ALGO).**
ALGO has already delivered a strong 22% weekly gain, but the more important development is unfolding beneath the surface. Recent price action suggests a clear structural shift is taking place, one that could mark the early stages of a sustained bullish continuation if a critical resistance zone is decisively cleared.
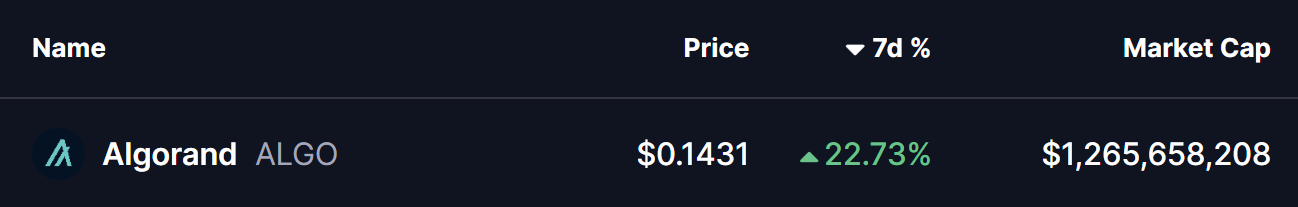
Source: Coinmarketcap
Right-Angled Descending Broadening Pattern in Play
On the 4-hour timeframe, ALGO had been trading inside a right-angled descending broadening formation — a bullish reversal structure defined by a flat overhead resistance and a rising lower boundary. For several weeks, price struggled to overcome the $0.1340–$0.1486 resistance band, with each rejection keeping ALGO locked in consolidation.
The recent rebound from the lower boundary of the structure marked a key turning point. Buyers stepped in aggressively, allowing ALGO to reclaim the 200-period moving average around $0.1225 — a level that had previously acted as dynamic resistance. This reclaim signaled improving momentum and a shift in short-term trend control.
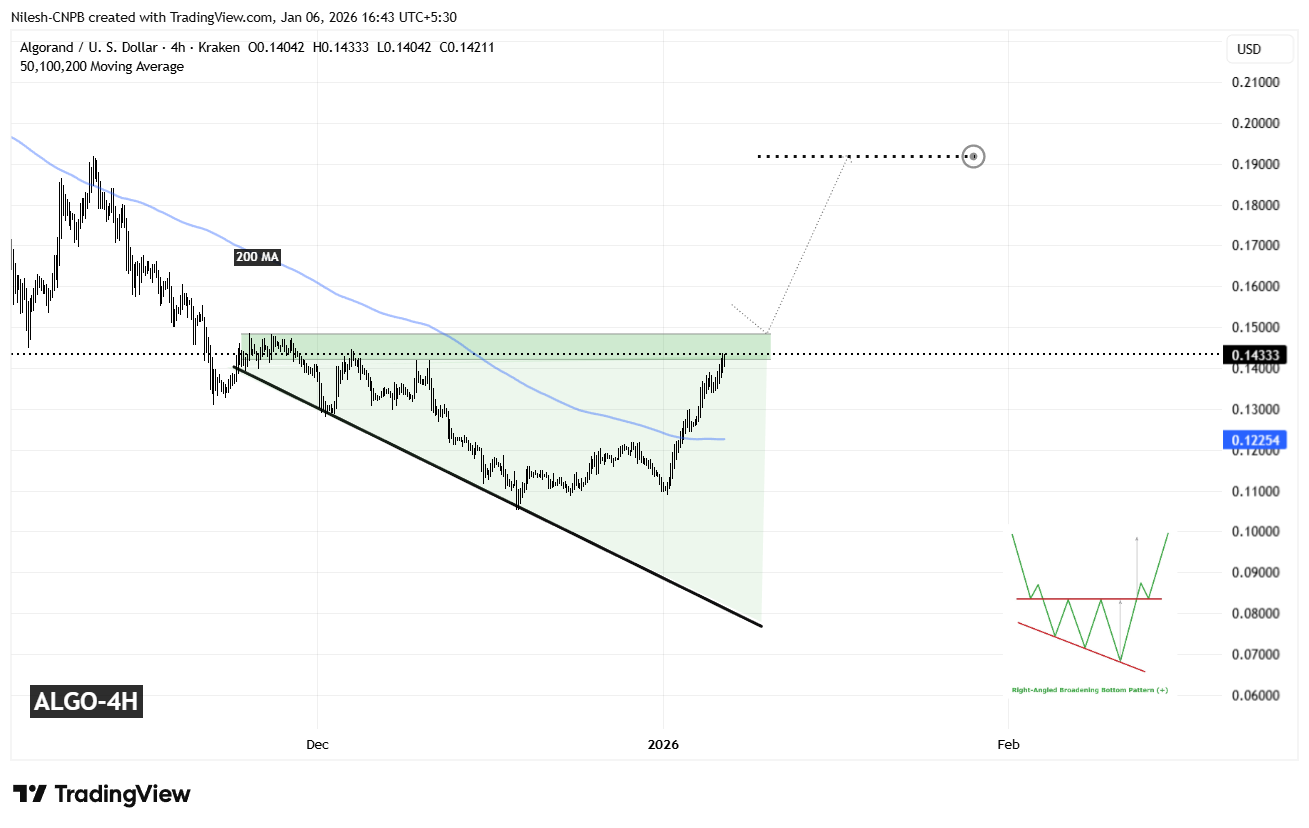
Algorand (ALGO) 4H Chart/Coinsprobe (Source: Tradingview)
Since then, ALGO has continued to push higher and is now pressing back into the same resistance zone that capped upside attempts in the past. This return to resistance places price at a critical inflection point where the broader trend direction could soon be decided.
What’s Next for ALGO?
A decisive close above the $0.1340–$0.1486 resistance zone would confirm a breakout from the descending broadening structure and validate the broader bullish reversal setup. Acceptance above this zone could attract fresh momentum participation and open the door to a stronger expansion phase.
Based on the depth of the formation and the projected measured move, the upside target points toward the $0.1920 region. Reaching that level would imply a potential upside of roughly 33% from current prices, aligning well with the typical behavior seen following successful breakouts from this pattern.
That said, patience remains important. Before any confirmed breakout, ALGO could still see short-term pullbacks — including a retest of the 200-period moving average, which has now turned into dynamic support. Such pullbacks would not invalidate the bullish setup as long as price continues to hold higher-low structures.
Until a clear breakout and follow-through occur, traders may want to remain cautious and avoid chasing price. The $0.1340–$0.1486 zone remains the key decision area that will determine whether Algorand transitions into a sustained bullish phase or continues consolidating as the new year unfolds.
Disclaimer: The views and analysis presented in this article are for informational purposes only and reflect the author’s perspective, not financial advice. Technical patterns and indicators discussed are subject to market volatility and may or may not yield the anticipated results. Investors are advised to exercise caution, conduct independent research, and make decisions aligned with their individual risk tolerance.
About Author: Nilesh Hembade is the Founder and Lead Author of Coinsprobe, with over 5 years of experience in the cryptocurrency and blockchain industry. Since launching Coinsprobe in 2023, he has been providing daily, research-driven insights through in-depth market analysis, on-chain data, and technical research.
Disclaimer: The information on this page may come from third parties and does not represent the views or opinions of Gate. The content displayed on this page is for reference only and does not constitute any financial, investment, or legal advice. Gate does not guarantee the accuracy or completeness of the information and shall not be liable for any losses arising from the use of this information. Virtual asset investments carry high risks and are subject to significant price volatility. You may lose all of your invested principal. Please fully understand the relevant risks and make prudent decisions based on your own financial situation and risk tolerance. For details, please refer to
Disclaimer.
Related Articles
Did Kaspa (KAS) Price Just Hit Its Cycle Low? Analyst Breaks Down What Could Happen Next
Kaspa (KAS) may be nearing a price bottom as it approaches key technical indicators like Fibonacci levels and a long-term trendline. Analysts suggest the cryptocurrency could stabilize around $0.24, potentially paving the way for a future upward move towards $1, contingent on market conditions.
CaptainAltcoin28m ago
Polkadot to Reset Tokenomics on March 12 With Major DOT Supply and Staking Changes
Polkadot will introduce a new monetary framework on March 12 that sets DOT’s supply cap at 2.1 billion and lowers emissions by 53.6%.
The overhaul will also create a Dynamic Allocation Pool and shorten the DOT unbonding period from 28 days to 24–48 hours.
On March 12, Polkadot will reset
CryptoNewsFlash1h ago
Solana Eyes $90.6 Trigger Point as $83 Support Holds and Liquidation Pressure Builds
A large cluster of short positions faces liquidation if SOL reaches $90.6, potentially increasing volatility.
SOL trades between $83.00 support and $89.58 resistance, keeping price action compressed in the short term.
SOL posts a 0.8% daily gain and rises 0.7% against BTC, holding
CryptoNewsLand1h ago
Will XRP Hold $1.33 or Extend Toward $1.30 Before Rebound?
XRP is currently trading at $1.35, experiencing a 1.3% decline. Key support is at $1.34, while resistance is at $1.40. The price is testing around the Fibonacci levels of $1.33 and $1.30, crucial for potential upward movement or deeper decline.
CryptoNewsLand2h ago
Solana Nears $95 Resistance With $17B Volume Surge
Solana approaches a key resistance level near $95, with increased trading volume and open interest signaling active trader interest. The token is currently at $90.20, facing potential upward movement if it surpasses $95, but may test $85 if rejected.
CryptoFrontNews2h ago
Analyst Says Bittensor (TAO) Could Be Ready for a Spike – Here’s the Price Target
Bittensor (TAO) is standing out again after spending months moving sideways. The AI-focused token has been hovering near a key support zone, and some analysts believe the chart may be setting up for a larger move.
Crypto analyst Karamata shared a breakdown of the TAO chart, arguing that
CaptainAltcoin2h ago

