JasmyCoin (JASMY), Cosmos (ATOM), and Bittensor (TAO) are emerging as the most impressive-performing cryptocurrencies in the past 24 hours. Leading the market enthusiasm, JasmyCoin has broken out strongly with double-digit gains, as buying pressure continues to dominate and fuel expectations of reaching higher milestones. Conversely, Cosmos and Bittensor, although still maintaining a positive trend, are beginning to slow down as their upward momentum weakens after six consecutive recovery sessions.
JasmyCoin Approaches a Key Psychological Level
As of Wednesday, JasmyCoin is trading around $0.00950, following an impressive breakout with a 27% increase in the previous session. This strong recovery is pushing JASMY close to the 200-day EMA at $0.01105 – a critical technical threshold.
In the scenario where the price decisively breaks above this long-term moving average, the bullish trend is likely to be reinforced and expanded, with the next target around $0.01361 – a level last tested on 10/3.
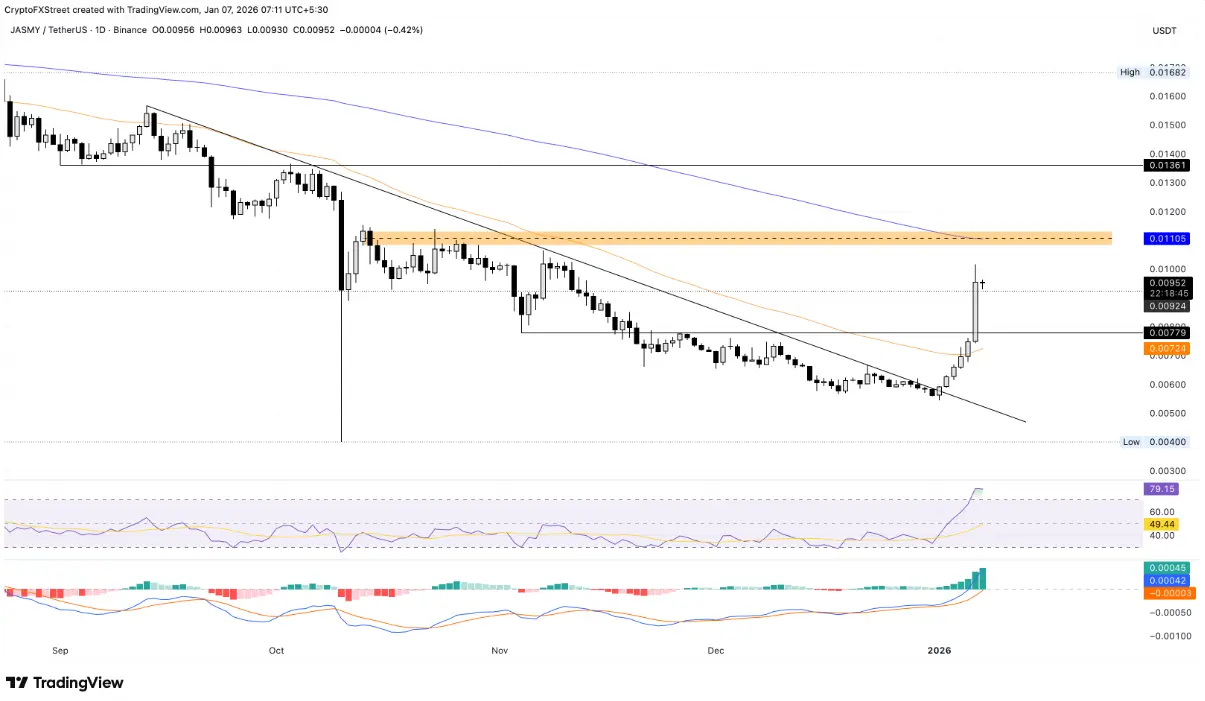 Daily JASMY/USDT Chart | Source: TradingView Technical signals on the daily timeframe are clearly favoring the bulls. The RSI has surged to 79, entering overbought territory, indicating strong buying pressure but also warning of a potential correction if the rally becomes overheated.
At the same time, momentum remains supported as the MACD continues its steady upward trend, accompanied by expanding green histogram bars, reflecting the strength of the current bullish momentum.
In a less optimistic scenario, if JASMY fails to sustain its upward momentum and reverses from the $0.01000 level, the price could retreat to test the support at $0.00779 – the recent low established on 11/4.
Cosmos Cannot Extend 6-Day Recovery Streak
Cosmos experienced a slight correction of about 2% as of Wednesday, ending its six consecutive days of gains. The daily decline pushed the price back toward the 2.346 USD low formed on 11/4, and it approached the 50-day EMA at $2.321 – a key support zone.
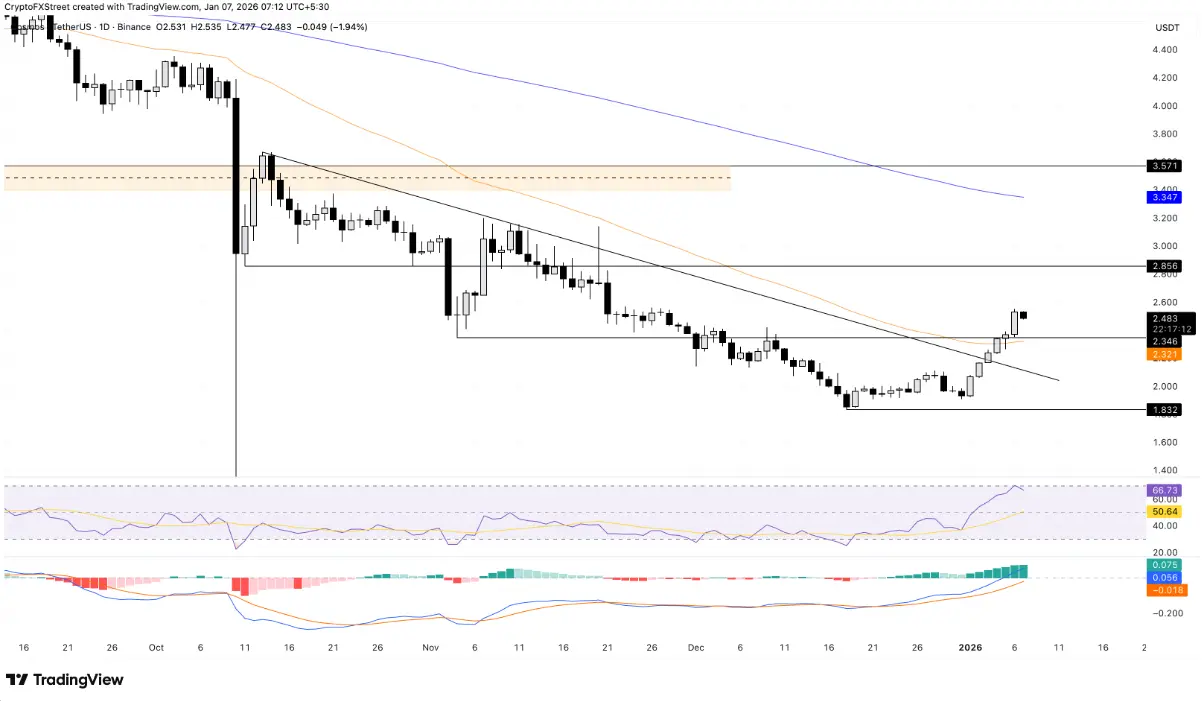 Daily ATOM/USDT Chart | Source: TradingView On the daily timeframe, momentum indicators are sending mixed signals as ATOM’s price trend shows signs of stalling. The RSI has fallen to 66 after leaving overbought territory, reflecting waning buying strength. Conversely, the MACD and its signal line continue to expand upward, indicating that the overall bullish momentum remains intact.
On the downside, the October 11 low around $2.856 now stands out as the nearest resistance level that bulls need to overcome to resume the upward trend.
Bittensor’s Recovery Stalls Below $300
Bittensor (TAO) failed to sustain its six-day recovery streak when it was unable to break through the psychological $300 level. At the time of reporting, TAO was down over 3% in Wednesday’s session, approaching the 50-day EMA at around $271 – just slightly above the critical support zone at $260.
In a negative scenario, if the $260 support is broken, selling pressure could increase, pushing the price down toward $206 – the low established on 12/24.
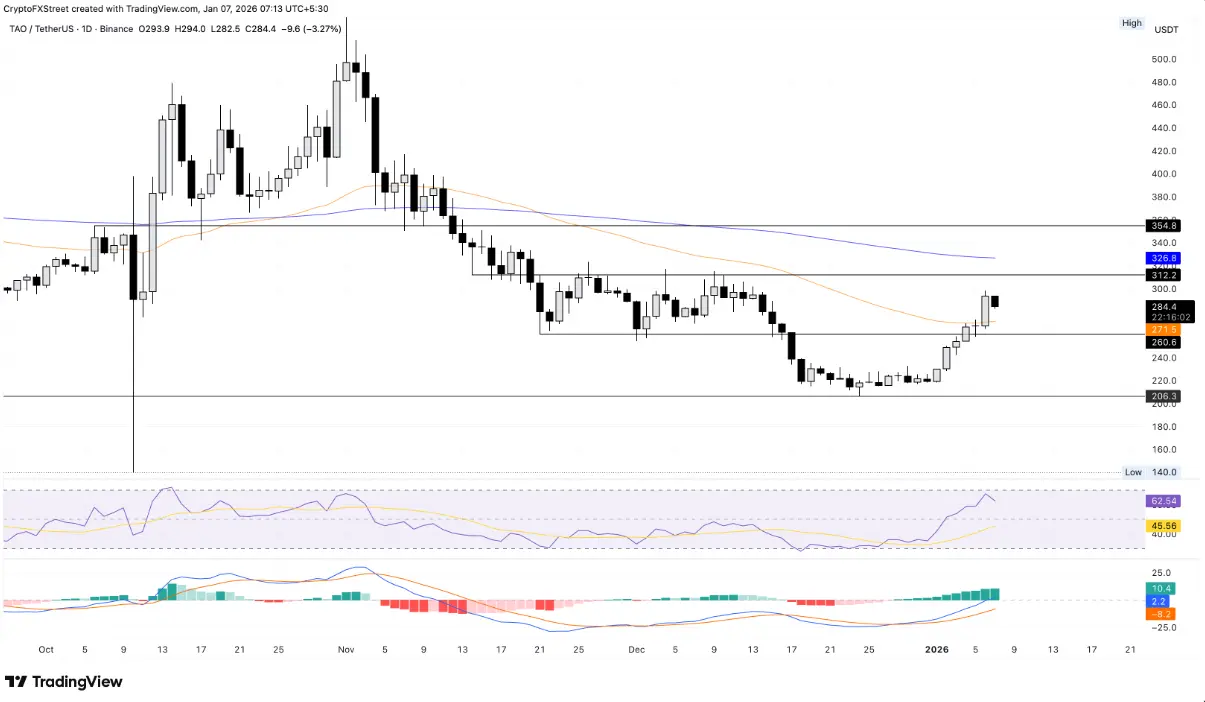 Daily TAO/USDT Chart | Source: TradingView Similar to Cosmos, momentum indicators on TAO are sending mixed signals. The RSI at 62 has turned downward from overbought levels, while the MACD and its signal line continue to trend upward, suggesting that buying interest has not fully waned.
Conversely, if TAO successfully regains the $300 level, the rally may face significant resistance at around $312 – the nearest resistance level tested on 12/12.
Disclaimer: The information on this page may come from third parties and does not represent the views or opinions of Gate. The content displayed on this page is for reference only and does not constitute any financial, investment, or legal advice. Gate does not guarantee the accuracy or completeness of the information and shall not be liable for any losses arising from the use of this information. Virtual asset investments carry high risks and are subject to significant price volatility. You may lose all of your invested principal. Please fully understand the relevant risks and make prudent decisions based on your own financial situation and risk tolerance. For details, please refer to
Disclaimer.
Related Articles
Interest in altcoins cools down: Can Ethereum trigger a new altcoin season?
The market is forcing investors to bring risk management back to the center.
From a technical perspective, the inflow of funds over the past week has driven
TapChiBitcoin1m ago
Aster Price Nears $0.79 Breakout as Reversal Pattern Strengthens
Key Insights
Aster price structure shows an inverse head and shoulders pattern forming beneath $0.79 resistance, signaling growing buying pressure and possible trend reversal ahead.
Repeated tests of the $0.79 neckline suggest weakening selling pressure as buyers steadily absorb supply
CryptoFrontNews2h ago
The HYPE price could surge despite the upcoming $2.8 million short squeeze.
The recent price movements of Hyperliquid (HYPE) are characterized by stagnation around 30 USD. A symmetrical triangle pattern indicates potential for a breakout in either direction, but market sentiment is cautious. Short squeeze risks may boost prices, while weak market flow and deteriorating demand pose challenges. The token could face significant support levels if it dips below 30 USD. An improved market sentiment could lead to a breakout above 33 USD, sparking recovery momentum.
TapChiBitcoin2h ago
Ethereum Price Holds Key Support: Is $2,200 the Next Test for ETH?
March 6, 2026 7:15 pm EST
TheCoinRepublic4h ago
Cardano Price Trends: Bulls Eye Opportunity as Indicator Flashes Green
ADA: Trading near $0.27, facing resistance at $0.28 and support at $0.26.
Technical Indicators: RSI and MACD show weak momentum, signaling short-term consolidation and cautious trading.
Macro Outlook: Rising PMI and historical patterns suggest potential bullish rebound if resistance
CryptoNewsLand5h ago
CryptoQuant: Bitcoin NUPL--MVRV indicator reaches 0.33, or has entered the mid-stage of a bear market
Gate News Announcement, March 7th, CryptoQuant analyst Axel pointed out on the X platform that the Bitcoin NUPL--MVRV harmonic composite indicator has reached 0.33, while historical cycle bottoms typically occur around the 0.5 range. The chart shows that the bear market cycle is beginning to shift upward, indicating that Bitcoin may have entered the mid-stage of this bear market cycle, suggesting that extreme selling conditions are easing. However, this indicator is still well above historical bottom levels, implying that a market-wide bottom has not yet been confirmed.
GateNews5h ago