
Date: Fri, Jan 02, 2026 | 10:54 AM GMT
The broader cryptocurrency market has started the new year with modest strength, as both Bitcoin (BTC) and Ethereum (ETH) trade slightly higher with gains of over 2%. This renewed stability across majors has helped improve overall sentiment, allowing several altcoins to regain momentum — including Aster (ASTER).
ASTER is currently trading around 4% higher on the day, but the more important development lies beneath the surface. On lower timeframes, price action is beginning to highlight a constructive bullish structure, suggesting that the token may be preparing for a meaningful breakout if the setup confirms.
Source: Coinmarketcap
Ascending Triangle Structure Takes Shape
On the 4-hour chart, ASTER is forming a clear ascending triangle, defined by a series of higher lows pressing steadily against a horizontal resistance zone. This type of structure is widely regarded as a bullish continuation pattern, particularly when it develops during consolidation and shows consistent buyer accumulation at rising support levels.
ASTER recently faced rejection near the $0.7367 neckline resistance, which pushed price back toward its ascending support trendline around the $0.68 region. Importantly, each dip has been met with strong buying interest, preventing any deeper pullback and keeping the bullish structure intact. This behavior indicates that sellers are gradually losing control as buyers step in earlier on every retracement.
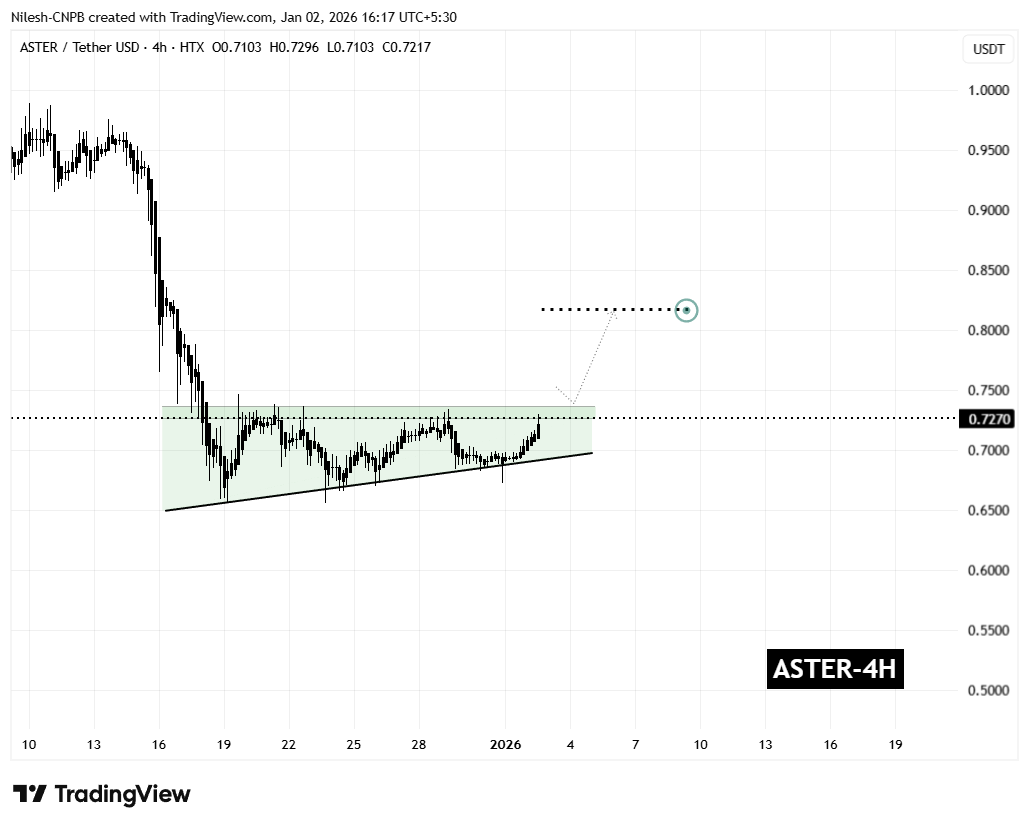
Aster (ASTER) 4H Chart/Coinsprobe (Source: Tradingview)
The latest rebound has once again carried ASTER toward the upper boundary of the triangle, reinforcing the idea that demand remains firm. Rather than signaling weakness, this sideways-to-higher price action reflects healthy consolidation as volatility tightens ahead of a potential breakout.
What’s Next for ASTER?
From here, ASTER appears to be preparing for another test of the $0.7367 resistance zone. A decisive breakout above this level, followed by a sustained close and a successful retest as support, would confirm the ascending triangle pattern and likely trigger a bullish expansion phase.
Based on the measured move of the formation, the technical upside projection points toward the $0.8178 region. This target represents a potential upside of roughly 12% from current levels and also aligns with previous price structure, adding further confidence to the bullish outlook.
That said, caution remains warranted. If ASTER fails to break above resistance, price could once again drift back toward the rising support trendline. As long as this trendline continues to hold, the broader bullish setup remains valid. A decisive breakdown below support, however, would invalidate the pattern and postpone any breakout scenario.
For now, the combination of improving market sentiment, consistent dip-buying, and a tightening ascending triangle structure suggests that Aster is approaching a critical decision point — one that could define its next significant move as 2026 begins.
Disclaimer: The views and analysis presented in this article are for informational purposes only and reflect the author’s perspective, not financial advice. Technical patterns and indicators discussed are subject to market volatility and may or may not yield the anticipated results. Investors are advised to exercise caution, conduct independent research, and make decisions aligned with their individual risk tolerance.
About Author: Nilesh Hembade is the Founder and Lead Author of Coinsprobe, with over 5 years of experience in the cryptocurrency and blockchain industry. Since launching Coinsprobe in 2023, he has been providing daily, research-driven insights through in-depth market analysis, on-chain data, and technical research.
Disclaimer: The information on this page may come from third parties and does not represent the views or opinions of Gate. The content displayed on this page is for reference only and does not constitute any financial, investment, or legal advice. Gate does not guarantee the accuracy or completeness of the information and shall not be liable for any losses arising from the use of this information. Virtual asset investments carry high risks and are subject to significant price volatility. You may lose all of your invested principal. Please fully understand the relevant risks and make prudent decisions based on your own financial situation and risk tolerance. For details, please refer to
Disclaimer.
Related Articles
Bitcoin Nearing Undervalued Territory? CryptoQuant Flags Key On-Chain Signal
CryptoQuant sparked fresh debate in markets this week after posting a short-but-sharp take on a once-obscure on-chain gauge: the one-week-to-one-month holding ratio. The firm pointed out that this ratio, a measure of how much Bitcoin is being held for very short windows versus slightly longer
BlockChainReporter15m ago
XRP Holds $1.34 Support While Leverage Heatmap Highlights $1.30 Risk Zone
XRP is trading at $1.36 in a tight range of support at $1.34 and resistance at $1.37.
The heatmap data indicates that there is a huge amount of long positions in the range of $1.30.
Should prices fall to around $1.30, long positions with high leverage in this region might
CryptoNewsLand44m ago
BTC 15-minute decline of 0.60%: key support broken, combined with leverage deleveraging triggering short-term selling pressure
2026-03-11 17:30 to 2026-03-11 17:45 (UTC), BTC's 15-minute return decreased by -0.60%, with prices fluctuating between 70515.2 and 71317.0 USDT, with an amplitude of 1.13%. Trading volume significantly increased compared to the previous period, with selling pressure dominating, short-term market volatility intensifying, and market attention heating up.
The main driver of this anomaly was BTC losing the key support zone at $68,000-$68,200, triggering algorithmic trading sell-offs and stop-loss orders to be released in concentration, leading to a short-term decline. Meanwhile,
GateNews1h ago
Polkadot Holds $1.46 Support as Descending Channel Caps Upside Near $1.53
The heaviest resistance is at the 4-hour chart where DOT trades within a downward channel and resistance levels are formed near the levels of $1.50-$1.53.
The nearest support is at $1.46 and a more profound zone of demand is at the range of $1.38 to $1.40.
Even with a 1.5 price drop, DOT
CryptoNewsLand1h ago
SOL Consolidates Near $84 While Chart Highlights Possible $45 Demand Zone
Solana (SOL) trades at $83.87 within a range defined by $81.03 support and $84.43 resistance, showing consolidation below a $90 supply zone. There is a broader demand area near $45, indicating potential downward movement before recovery.
CryptoNewsLand1h ago
XRP Eyes $3 As Bollinger Band Squeezes, Setting Stage for Massive 217% Price Spike
In the volatile cryptocurrency landscape, the XRP coin is drawing investor interest for its ability to spur liquidity-driven moves. Today, market analyst Ali Martinez examined the latest chart trajectory of XRP and disclosed a Bollinger Band squeeze that suggests that the market is building for a
BlockChainReporter2h ago