Key Insights
- SUI is currently battling a 4% daily drop as selling pressure increases near the important $1.80 level.
- Trading volume has fallen by over 32% since yesterday. This indicates a strong decline in market participation and trader activity.
- Technical indicators like the MACD and CMF are currently showing that capital is flowing out of the asset as it tests a neutral RSI zone.
The crypto market has entered a period of cooling after a volatile start to the new year. While several major assets struggle to hold their ground, SUI in particular is facing a difficult test of its recent recovery.
After a brief climb toward the $2.00 mark, the token has started to drift lower as buyers lose their grip.
Most digital assets are trading in the red today, and the general market sentiment remains stuck in a neutral zone.
Technical Signals Weigh on the SUI Price
Market data from TradingView shows that the short-term outlook for SUI has turned quite heavy.
The 4-hour chart shows several red candles in a row, which is a classic sign of bearish control.
Many traders are now watching the $1.70 range as a support level. If the price fails to hold there, it could trigger a “death cross.”
For context, this happens when short-term moving averages fall below long-term ones and often leads to more selling.
The daily chart shows a descending channel as SUI trades between its 100 and 50-day EMAs.
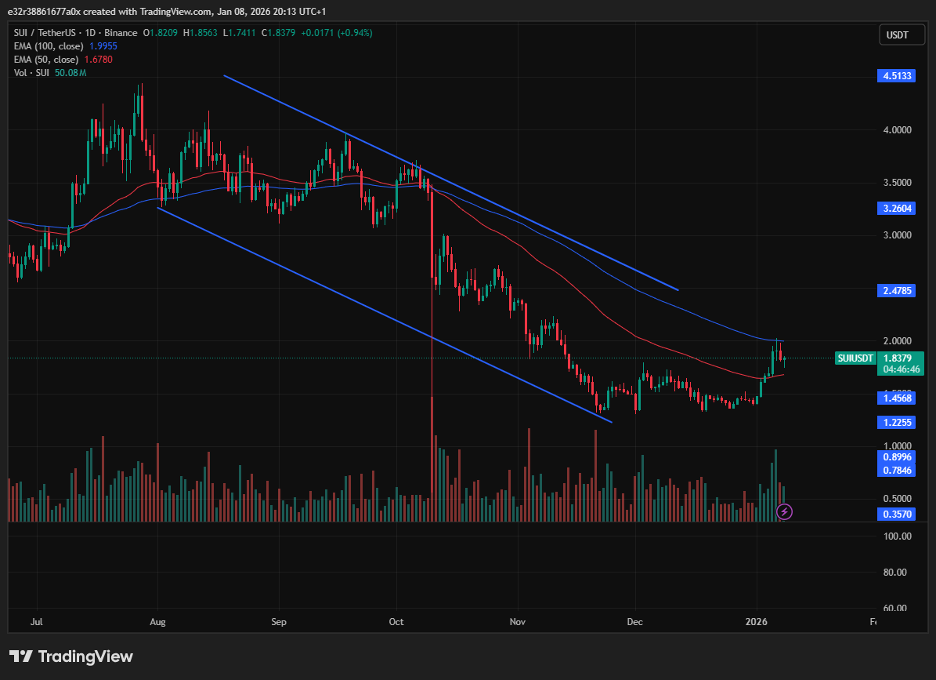
SUI shows a descending channel on daily charts | Source: TradingView
Indicators like the MACD are currently below the signal line. This confirms that the trend is moving against the bulls. The Chaikin Money Flow (CMF) also shows a reading of -0.07, which means that there is mild capital outflow.
In other words, more people are selling than buying right now. While the momentum is not yet in a state of freefall as of writing, the gap between these lines is widening, and traders need to stay alert.
A Look Back at the Early 2026 Recovery
Despite the recent dip, it is important to remember that SUI started the year with a massive 30% surge.
In the first week of the year alone, the token briefly reclaimed the $2.00 level for the first time since November. This rally was a breath of fresh air after a long decline that dominated the second half of last year.
During that time, social interest in the project had fallen by nearly 95% according to data from Santiment.
This recent recovery happened even though online discussion remained very low. Usually, when prices go up without a lot of social media hype, it tends to mean that whales are the only ones buying.
Can SUI Break the Cycle of Decline?
The biggest challenge for the SUI is breaking the long-term downtrend that began last year.
Analysts recently noted that the price had managed to break above a major descending trendline earlier this month.
This was a major win for the bulls, and it showed that the demand zone between $1.00 and $1.20 was strong enough to act as a solid base for future growth.
$SUI is turning out to be a great deal. 👀✔️ https://t.co/hvv6n1lu9d pic.twitter.com/yylhKDE7ST
— Lucky (@LLuciano_BTC) January 6, 2026
Even with the current 1% to 4% daily loss, some technical analysts are still hopeful.
They believe that as long as SUI stays above the $1.50 mark, the “bullish thesis” is still alive.
The daily RSI is currently at 51.49, which means that the market’s momentum is neutral. In other words, the market is in a period of consolidation and investors are playing a waiting game to see if the bulls will step back in.
Disclaimer: The information on this page may come from third parties and does not represent the views or opinions of Gate. The content displayed on this page is for reference only and does not constitute any financial, investment, or legal advice. Gate does not guarantee the accuracy or completeness of the information and shall not be liable for any losses arising from the use of this information. Virtual asset investments carry high risks and are subject to significant price volatility. You may lose all of your invested principal. Please fully understand the relevant risks and make prudent decisions based on your own financial situation and risk tolerance. For details, please refer to
Disclaimer.
Related Articles
鏈上熱到爆、以太幣卻漲不動?專家揭「致命死穴」:恐下探 1,500 美元
CryptoQuant 報告指出,以太坊面臨「採用悖論」,雖然網路活躍度創新高,但幣價卻下滑。若熊市持續,到第三季末以太幣可能跌至 1,500 美元。智能合約活躍度上升與以太幣價格脫鉤,交易所流入量更能反映價格動態。投資需求疲軟,資金持續流失是主要隱憂。
区块客3m ago
Dogecoin (DOGE) phát tín hiệu khởi sắc khi dòng tiền nhà đầu tư cá nhân quay lại
Dogecoin (DOGE) is experiencing a recovery, currently up over 2% and nearing the psychological $0.1000 mark. Increased speculative activity is attracting traders to the derivatives market, and technical indicators suggest a cautious positive outlook for DOGE.
TapChiBitcoin13m ago
DePIN and AI Lead the Charge – Analyzing the Top Weekly Crypto Gainers
The cryptocurrency market serves as an indicator for new technological trends, and weekly data for the cryptocurrency market collected by CoinMarketCap show that investor sentiment has recently changed a lot. The market remains directionless overall, yet an exclusive set of projects, particularly in
BlockChainReporter13m ago
Liệu RAVE có sẵn sàng tăng 30% sau khi lấy lại được mức hỗ trợ này?
RaveDAO (RAVE) hiện đang giao dịch ở mức $0,2475 sau khi ghi nhận mức tăng ấn tượng 16,45%. Đáng chú ý, sự gia tăng mạnh mẽ trong hoạt động thị trường đã được ghi nhận, với khối lượng giao dịch tăng vọt 125%, đạt $88,15 triệu. Điều này phản ánh sự quan tâm lớn từ các nhà đầu tư và nhà giao dịch đối
TapChiBitcoin1h ago
+112 Billion Shiba Inu (SHIB) in 24 Hours Returns Notorious 80 Trillion Threshold - U.Today
Shiba Inu finally recovering
Shiba Inu are ready to sell
More than 112 billion SHIB tokens were transferred to exchanges in the past day, bringing total exchange reserves back above the 80 trillion SHIB threshold, indicating a discernible change in Shiba Inu's on-chain dynamics.
Shiba Inu final
UToday1h ago
Solana Tests $90 Resistance as Fibonacci Confluence Signals Key Turning Point
Key Insights
Solana price is nearing a major resistance near $90 where Fibonacci retracement and value area levels align, creating a decisive technical barrier.
Market structure shows the rally forming part of an ABC corrective pattern, keeping the broader consolidation intact while price tr
CryptoFrontNews1h ago