
Key Highlights: Canton (CC) Technical Setup
-
Bullish Chart Pattern: Canton (CC) has confirmed a textbook Cup-and-Handle breakout on the daily timeframe, a structure typically signaling the start of a massive uptrend.
-
Critical Support Zone: Price is currently undergoing a “healthy” retest of the $0.1390 neckline. This former resistance-turned-support aligns with a major institutional demand block.
-
Institutional Catalyst: The technical breakout follows news of JPMorgan and Lloyds Bank integrating the Canton Network for real-world asset (RWA) tokenization and settlement.
-
Market Resilience: Despite Bitcoin (BTC) slipping below $90,000, $CC is showing relative strength by holding its breakout structure, signaling strong dip-buying activity.
The broader cryptocurrency market is taking a breather after a strong start to the year. Bitcoin (BTC), which surged close to the $94,000 level earlier this week, has slipped back below $90,000, dragging overall market sentiment slightly lower. Ethereum (ETH) is also under pressure, down around 3% on the day.
However, while the majors altcoins retreat, Canton (CC) is quietly flashing a technically “constructive” setup. Backed by a wave of RWA (Real World Asset) tokenization news, the CC daily chart suggests a massive bullish move is brewing beneath the surface.
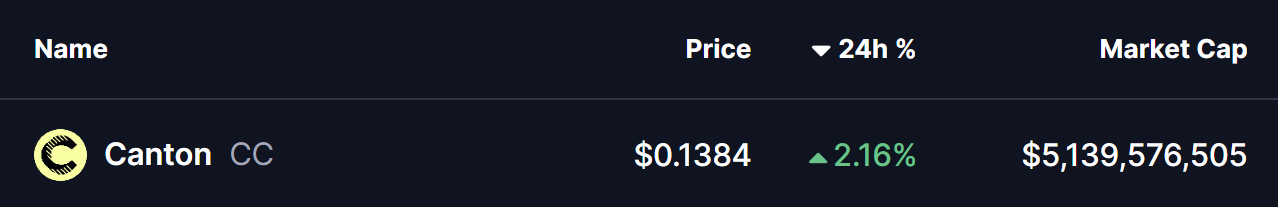
Source: Coinmarketcap
Fundamental Catalyst: The JPMorgan & Lloyds Bank Effect
Canton’s resilience isn’t accidental. On January 7, 2026, the network saw two massive institutional wins:
-
JPMorgan announced a phased 2026 rollout of JPM Coin natively on the Canton Network.
-
Lloyds Banking Group executed the UK’s first tokenized gilt transaction on the platform.
These milestones have transformed $CC from a speculative altcoin into a critical piece of global financial infrastructure, providing the fundamental “fuel” for the current chart breakout.

Source: @CantonFdn (X)
Cup-and-Handle Breakout Enters Retest Phase
On the daily timeframe, Canton had been consolidating within a textbook cup-and-handle formation, a bullish continuation structure that often precedes strong upside expansion once confirmed.
This pattern began forming in early November after CC faced rejection near the $0.1360 resistance zone. That rejection led to a prolonged decline, with price eventually bottoming around $0.0586. From that low, selling pressure gradually faded and buyers stepped in consistently, allowing price to carve out a smooth, rounded base over several weeks — a classic cup structure.
The consolidation resolved with a clean breakout above the neckline near $0.1390, propelling CC sharply higher toward a local peak at $0.1768. Following this impulsive move, price entered a controlled pullback — a normal and healthy behavior after a breakout — setting up a retest of the former resistance area.
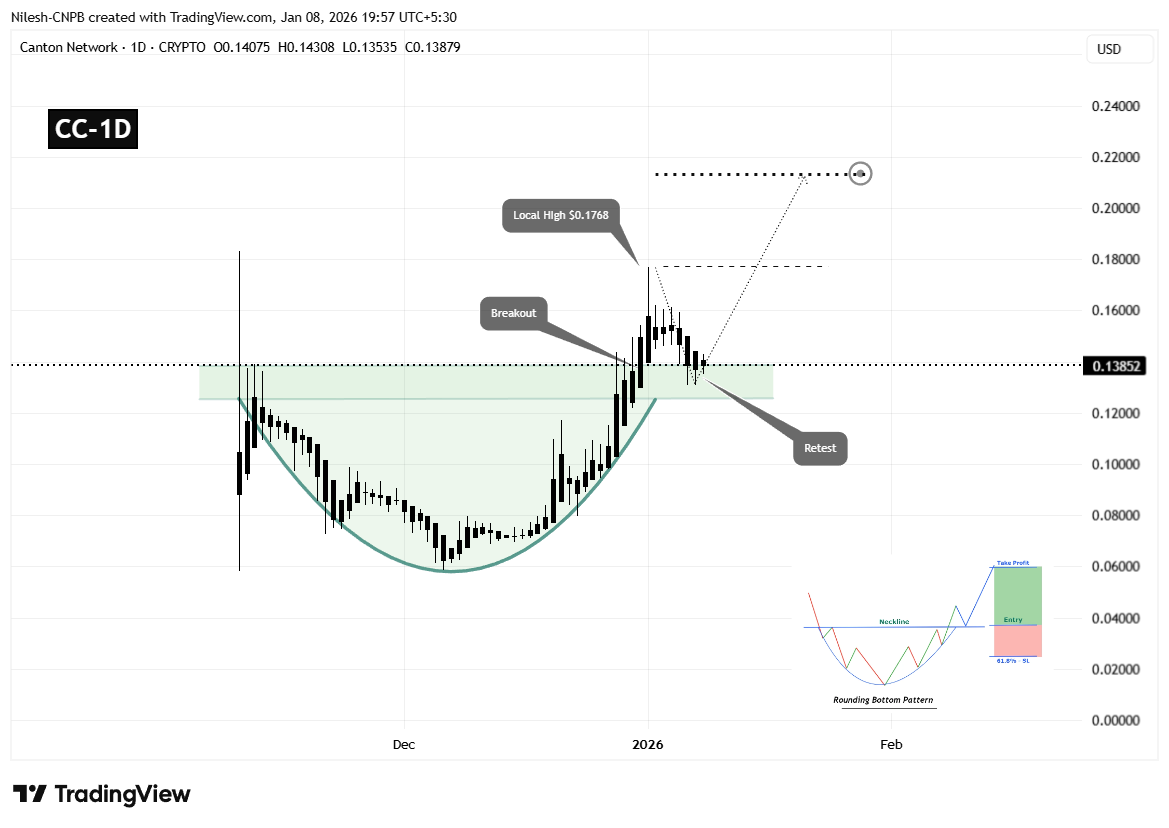
Canton (CC) Daily Chart/Coinsprobe (Source: Tradingview)
Currently, CC is trading back near the $0.1390 region, which now acts as a resistance-turned-support zone. This area also overlaps with the broader demand block highlighted on the chart, making it a technically important level for the next directional move.
What the Chart Suggests Next for CC
The ongoing retest phase remains constructive as long as buyers continue to defend the $0.1390–$0.1308 support zone. A strong reaction from this region would signal that market participants are using the pullback to accumulate rather than exit positions.
If support holds and bullish momentum resumes, the first upside objective would be a reclaim of the $0.1768 local high. A decisive move above this level would reinforce bullish control and confirm strength following the breakout-retest structure.
Based on the measured move projection of the broader rounding bottom and cup formation, a successful continuation could push CC toward the $0.2130 region. This target aligns with the projected extension shown on the chart and represents approximately 50%–55% upside from the breakout zone.
On the flip side, failure to hold above the $0.1308 support area would weaken the bullish setup and increase the risk of a deeper pullback, potentially turning the recent breakout into a failed move.
For now, the structure favors patience. As long as CC maintains support and avoids aggressive rejection from this retest zone, the broader technical outlook continues to lean bullish.
Why is Canton (CC) rising in 2026?
The rise is driven by institutional adoption. Major entities like the DTCC and JPMorgan are using Canton for tokenizing U.S. Treasuries and cross-border settlements.
Disclaimer: The views and analysis presented in this article are for informational purposes only and reflect the author’s perspective, not financial advice. Technical patterns and indicators discussed are subject to market volatility and may or may not yield the anticipated results. Investors are advised to exercise caution, conduct independent research, and make decisions aligned with their individual risk tolerance.
About Author: Nilesh Hembade is the Founder and Lead Author of Coinsprobe, with over 5 years of experience in the cryptocurrency and blockchain industry. Since launching Coinsprobe in 2023, he has been providing daily, research-driven insights through in-depth market analysis, on-chain data, and technical research.
Disclaimer: The information on this page may come from third parties and does not represent the views or opinions of Gate. The content displayed on this page is for reference only and does not constitute any financial, investment, or legal advice. Gate does not guarantee the accuracy or completeness of the information and shall not be liable for any losses arising from the use of this information. Virtual asset investments carry high risks and are subject to significant price volatility. You may lose all of your invested principal. Please fully understand the relevant risks and make prudent decisions based on your own financial situation and risk tolerance. For details, please refer to
Disclaimer.
Related Articles
Bitcoin Cash Battles $459 Resistance as Massive Sell Walls Stack Toward $650
BCH is trading at $455.86 close to the resistance range of $459.20 with the support level of $447.44.
The chart data indicates that the chart has strong resistance levels at around $520, $580 and $650 which restricts the momentum on short term upside.
Following a sharp fall, price
CryptoNewsLand2m ago
PEPE Consolidates Above $0.05324 Support as Momentum Strengthens and Resistance Near $0.05336 Holds
PEPE has a tight intraday price compression with a support level of $0.053243 and resistance level of $0.053363.
A RSI of 64.13 represents the moderate bullish momentum whereas MACD history is slightly positive, which indicates the gradual buying momentum.
The price is at $0.053364
CryptoNewsLand52m ago
HYPE Hits $35.53 After 2.4% Jump — Will Momentum Hold as Price Tests $35.59 Resistance?
Hyperliquid’s HYPE trades at $35.53, approaching the $35.59 resistance after a 2.4% daily gain.
The chart shows the $33.67 zone acting as support after price moved above a previously contested level.
Price now trades between $33.67 support and $35.59 resistance, shaping the immediate
CryptoNewsLand57m ago
Cardano áp sát mốc 0,28 USD khi lực mua nhỏ lẻ tăng mạnh – Đà bứt phá đã cận kề?
The current price of Cardano (ADA) is around $0.270, having risen from a support level of $0.254-$0.260. It underwent a dip to $0.2194 before buyers returned, leading to a structure indicating accumulation. The price tests resistance at $0.287, while whale activity raises market uncertainty. Despite a reduction in ADA holdings among large wallets, the supply remains concentrated in their hands, suggesting strategic liquidity reallocation rather than widespread selling. Meanwhile, retail investors continue accumulating ADA.
TapChiBitcoin3h ago
Bitcoin MVRV Z-Score Drops Below 1 Again
The MVRV Z-Score is a key on-chain indicator for assessing Bitcoin's value by comparing market and realized capitalizations. Historical data shows that when the score drops below 1, it often signals significant market recovery. However, changing market dynamics and institutional influences may alter future patterns.
Coinfomania3h ago
「刻舟求劍」式幣價預測走紅,玄學預言的實戰邏輯與缺陷
作者:Frank,PANews
每當市場進入不上不下的迷惘階段,就會有人試圖用「刻舟求劍」式的歷史回溯方法去預測下一段走勢。在這種情況下,人們往往能從這些理論和圖表中看到歷史總是在重演,並似乎自動將未來一段時間的行情走勢與過去的某一段進行重疊驗證。
這種重合似乎有著神奇的效果,也常常被驗證。有部落客自稱這種預測的準確率能到達 75%~80% 。
這種在社群媒體上屢屢爆紅的「刻舟求劍」式價格預測,究竟是在幫助市場識別階段,還是在把噪音包裝成預言?
從「滴答分形」到「歷史押韻」
關於 2025 年 10 月市場頂點預測的巔峰操作是名為 CryptoBullet 的分析師,他所創建的一種名為「ti
区块客4h ago