
The XRP price is always in the spotlight, especially after failing to stay above a key resistance level. That rejection got attention from a few crypto veterans, who are now warning that downside risk is still on the table. In a chart shared by CasiTrades, XRP appears vulnerable to a deeper pullback if nearby support does not hold.
XRP started the year with strong momentum and briefly pushed above the $2.40 level. Since then, price action has slowed, with XRP now trading closer to the $2.10–$2.15 range. The broader crypto market remains mixed, but XRP’s rejection at a major Fibonacci level has shifted short-term momentum and raised fresh questions about where the XRP price is headed next.
- What CasiTrades Is Seeing on the XRP Chart
- Why $2.03 Matters for the XRP Price
- XRP Indicators: RSI and Momentum Context
- Where Is the XRP Price Headed Next?
What CasiTrades Is Seeing on the XRP Chart
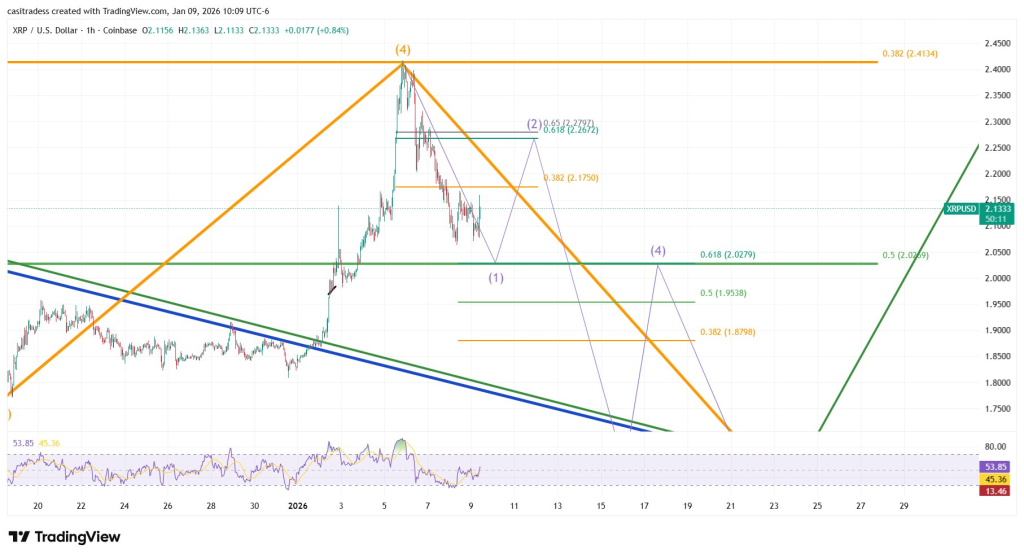
Based on CasiTrades’ take, XRP rallied into the macro 0.382 Fibonacci resistance near $2.41, a zone that often decides whether a move continues or stalls during a correction. The initial push into that level looked promising, but buyers were unable to maintain pressure. Without strong follow-through, price rolled over, suggesting the move was running out of strength rather than breaking into a new trend.
From a structural standpoint, this type of rejection often leads to a pullback toward lower support levels rather than immediate continuation higher.
Source: X/@CasiTrades
Why $2.03 Matters for the XRP Price
The $2.03 area is now the key level to watch. This zone lines up with the macro 0.5 Fibonacci retracement and has acted as a support area in the recent structure. CasiTrades expects XRP to react here, potentially producing a short-term bounce toward the local 0.618 retracement near $2.26.
However, the quality of that bounce matters. If XRP fails to reclaim $2.41 after bouncing from $2.03, it would suggest the move is corrective rather than bullish. In that case, downside pressure could remain intact.
One of the more cautious parts of CasiTrades’ XRP price prediction is that $1.65 remains a valid downside target. This level represents the macro 0.618 Fibonacci support, a zone where buyers may step in more aggressively if price continues lower.
The analyst points out that the earlier move into $2.41 lacked strong volume and impulsive structure. Without those characteristics, the market often needs more time to reset. A failure at $2.03 could open the door for a deeper move toward $1.65 before XRP finds more stable footing.
XRP Indicators: RSI and Momentum Context
Momentum indicators add to this cautious outlook. RSI has cooled significantly from overbought levels and now sits in a neutral range. That leaves room for a short-term bounce, but it also reflects fading upside momentum after the rejection.
CasiTrades notes that if XRP bounces from $2.03, traders should watch closely for signs of weakness, such as declining volume or bearish divergence. Those signals would strengthen the case for another leg lower.
Rea also: How Much Will XRP Be Worth at the Bitcoin, Silver, or Apple Market Cap?
Where Is the XRP Price Headed Next?
So where is the XRP price headed next? In the short term, everything revolves around $2.03. A strong hold and convincing reaction could keep XRP trading in a range between $2.00 and $2.40. On the other hand, a weak bounce or a clean break below $2.03 would increase the chances of a move toward $1.65.
This analysis does not invalidate XRP’s longer-term outlook. Instead, it suggests that the current phase may still involve deeper consolidation before any sustained upside move can develop.
For now, CasiTrades’ XRP price prediction serves as a reminder that failed breakouts often lead to retests of lower support, and that structure, not excitement, usually decides the next move.
Disclaimer: The information on this page may come from third parties and does not represent the views or opinions of Gate. The content displayed on this page is for reference only and does not constitute any financial, investment, or legal advice. Gate does not guarantee the accuracy or completeness of the information and shall not be liable for any losses arising from the use of this information. Virtual asset investments carry high risks and are subject to significant price volatility. You may lose all of your invested principal. Please fully understand the relevant risks and make prudent decisions based on your own financial situation and risk tolerance. For details, please refer to
Disclaimer.
Related Articles
Crypto Market Review: Shiba Inu (SHIB) Breaks Curse, Ethereum Can Hit $2,500 After This Breakout, XRP's First Attempt to Hit $2 - U.Today
Shiba Inu starts breakout march
Is SHIB out of downtrend?
Ethereum looking up again
Issues with ETH
XRP finally alive
The market is certainly looking better and healthier. We are witnessing the recovery of large and smaller assets like Shiba Inu, XRP and Ethereum. However, we are seeing an
UToday26m ago
XRP Surges Toward $1.43 After Rebounding From $1.33 Demand Zone — Is $1.50 the Next Test?
XRP recovered out of the $1.33 Fibonacci demand pocket, with price supported at the $0.618 level at $1.3329.
The chart shows that, above the price of $1.34, there are several higher lows structures, representing a sustained recovery following the earlier fall just around the price of $1.26.
CryptoNewsLand4h ago
Price Predictions 3/13: BTC ETH BNB XRP SOL DOGE HYPE ADA BCH XMR
The article discusses price predictions for various cryptocurrencies including BTC, ETH, BNB, XRP, SOL, DOGE, HYPE, ADA, BCH, and XMR, providing insights into market trends and forecasts.
CryptoBreaking5h ago
XRP Price Prediction As Ripple Breaks Out and Expands in Australia, Could AlphaPepe Be the Next T...
XRP is back in the spotlight after a fresh breakout above a key resistance zone coincided with a meaningful business expansion for Ripple in Australia. That combination matters because traders are not just looking at a chart this time. They are looking at a token tied to a company that is still
BlockChainReporter5h ago