
**Date: **Fri, Jan 02, 2026 | 03:10 PM GMT
The broader cryptocurrency market has started the new year with modest strength, as both Bitcoin (BTC) and Ethereum (ETH) trade firmly in the green with gains of over 2%. While this positive momentum is lifting most altcoins, the privacy-focused token Zcash (ZEC) is moving against the broader trend.
ZEC is down more than 8% on the day. However, despite the red candles, the daily chart suggests this pullback may be a healthy bullish retest rather than the start of a trend reversal.
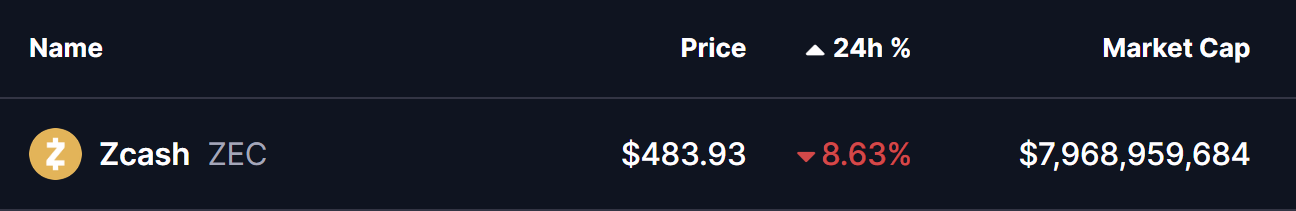
Source: Coinmarketcap
Retesting the Ascending Triangle Breakout
On the daily timeframe, ZEC had been consolidating inside a well-defined ascending triangle pattern, characterized by a series of higher lows pressing against a flat resistance zone near $476. This structure signaled steady accumulation and growing buyer confidence.
Earlier, bulls successfully broke above the $476 ceiling with strong momentum, sending ZEC sharply higher by nearly 66% — from the breakout base to a local peak around $556.59. This move confirmed the validity of the pattern and marked a clear shift in market structure.
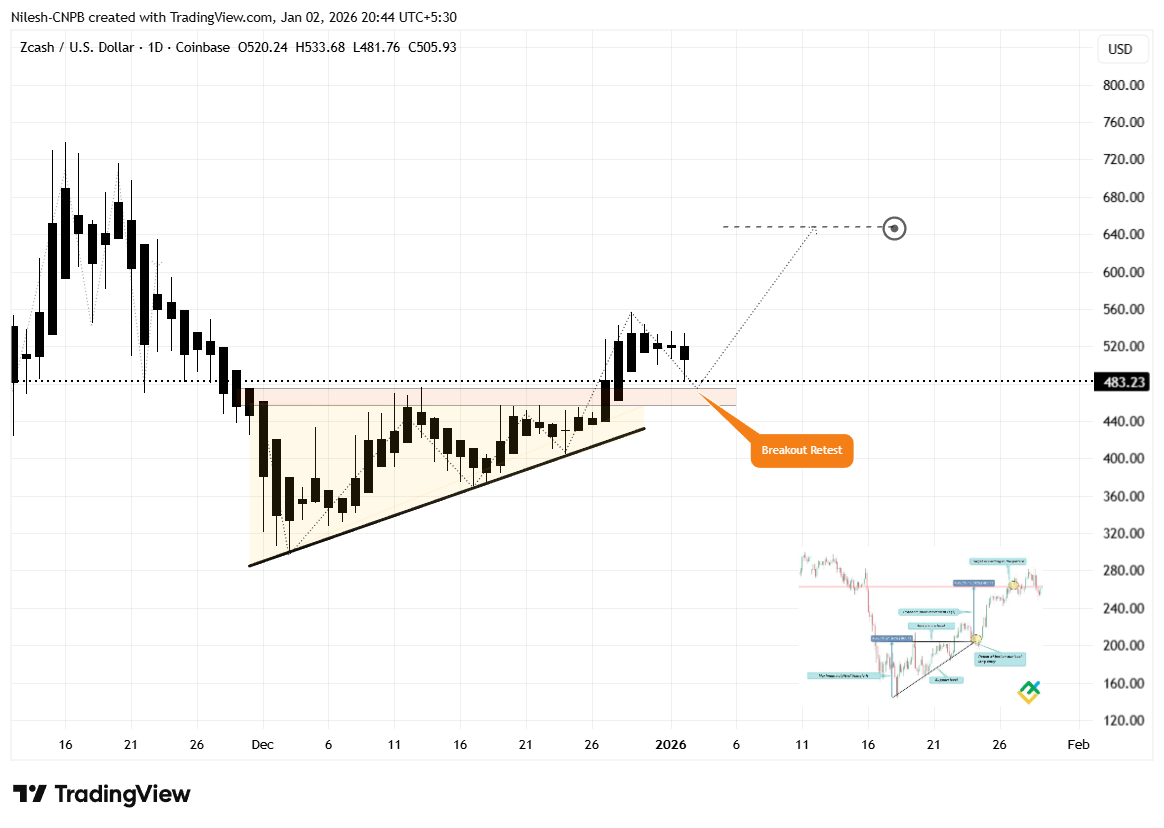
Zcash (ZEC) Daily Chart/Coinsprobe (Source: Tradingview)
Following that rally, price has pulled back and is now trading near the $483 region. Crucially, this zone aligns closely with the former breakout level, making it a classic resistance-turned-support area. Such retests are common after strong breakouts and often act as a launchpad for the next leg higher if buyers defend the level.
What’s Next for ZEC?
The current retest phase is technically constructive, but the next move will depend on whether bulls can firmly defend the broader $426–$476 support zone. A strong reaction from this area would signal that buyers remain in control and are using the dip to accumulate.
If support holds and momentum returns, ZEC’s first key objective will be a reclaim of the $556.59 local high. A decisive move above this level would confirm strength and open the door for further upside.
In that scenario, ZEC could advance toward the ascending triangle’s measured target near $647.73, representing a potential upside of roughly 32% from current levels.
On the downside, failure to hold above the $426 support zone would weaken the bullish breakout structure and raise the risk of a deeper pullback, potentially turning the recent move into a failed breakout.
For now, all eyes remain on the breakout retest. How ZEC reacts around this key support area will likely determine whether the recent rally was just the beginning — or a move that needs more time to rebuild momentum.
Disclaimer: The views and analysis presented in this article are for informational purposes only and reflect the author’s perspective, not financial advice. Technical patterns and indicators discussed are subject to market volatility and may or may not yield the anticipated results. Investors are advised to exercise caution, conduct independent research, and make decisions aligned with their individual risk tolerance.
About Author: Nilesh Hembade is the Founder and Lead Author of Coinsprobe, with over 5 years of experience in the cryptocurrency and blockchain industry. Since launching Coinsprobe in 2023, he has been providing daily, research-driven insights through in-depth market analysis, on-chain data, and technical research.
Disclaimer: The information on this page may come from third parties and does not represent the views or opinions of Gate. The content displayed on this page is for reference only and does not constitute any financial, investment, or legal advice. Gate does not guarantee the accuracy or completeness of the information and shall not be liable for any losses arising from the use of this information. Virtual asset investments carry high risks and are subject to significant price volatility. You may lose all of your invested principal. Please fully understand the relevant risks and make prudent decisions based on your own financial situation and risk tolerance. For details, please refer to
Disclaimer.
Related Articles
Aave Price Holds Near $111 After $27M Liquidation Error Shakes DeFi
Key Insights
Aave traded near $111 after a CAPO oracle configuration error triggered $27 million in liquidations across 34 wstETH-backed accounts.
Trading activity cooled as derivatives volume dropped and open interest declined, signaling that traders stepped back following the liquidation i
CryptoFrontNews40m ago
Cardano Price Holds Above $0.26 as Upgrade Buzz Builds Toward $0.30
Key Insights
Cardano price trades above $0.26 as investors position ahead of the Leios and Midnight upgrades, while derivatives data reflect rising bullish sentiment.
Futures open interest reached $416 million while funding rates favor long positions, signaling stronger trader confidence des
CryptoFrontNews44m ago
Cardano’s 307% Rally Started With This Signal – And ADA Price Just Flashed It Again
Cardano has been quietly building something that caught the interest of technical analysts. After months of grinding sideways and frustrating holders, the ADA price finally showed signs of life.
The move caught many off guard, but for those watching the charts, the signal was impossible to
CaptainAltcoin49m ago
XRP Price Structure Tightens While Heatmap Highlights $1.30 Liquidity Zone
XRP trades near $1.37 support after a 0.9% daily decline, while the $1.44 level remains the immediate resistance in the current range.
A three-week liquidity heatmap highlights a large order cluster around $1.30, indicating a strong liquidity zone below price.
A three-month Gaussian
CryptoNewsLand1h ago
Billionaire Investor Stanley Druckenmiller Bullish on Stablecoin Growth
Billionaire investor Stanley Druckenmiller believes stablecoins will become the backbone of the financial system in 10-15 years, citing their efficiency. However, he views much of the wider crypto market as unnecessary, describing it as “a solution looking for a problem.”
Decrypt1h ago
SOL Consolidates Near $84 While Chart Highlights Possible $45 Demand Zone
Solana (SOL) trades at $83.87 within a range defined by $81.03 support and $84.43 resistance, showing consolidation below a $90 supply zone. There is a broader demand area near $45, indicating potential downward movement before recovery.
CryptoNewsLand2h ago