
**Date: **Sat, Jan 03, 2026 | 01:26 PM GMT
As 2026 kicks off, the broader cryptocurrency market is showing renewed stability. Ethereum (ETH) has reclaimed the $3,100 level, and several major altcoins are already beginning to pick up momentum. Against this improving backdrop, Kaspa (KAS) is quietly positioning itself as a potential late mover, with its chart structure starting to flash early bullish signals.
While KAS is trading slightly in the red today and remains mostly flat on the weekly timeframe, the more important story is unfolding beneath the surface. Recent price action suggests a meaningful structural shift may be underway — one that could mark the early stages of a bullish continuation if confirmed.
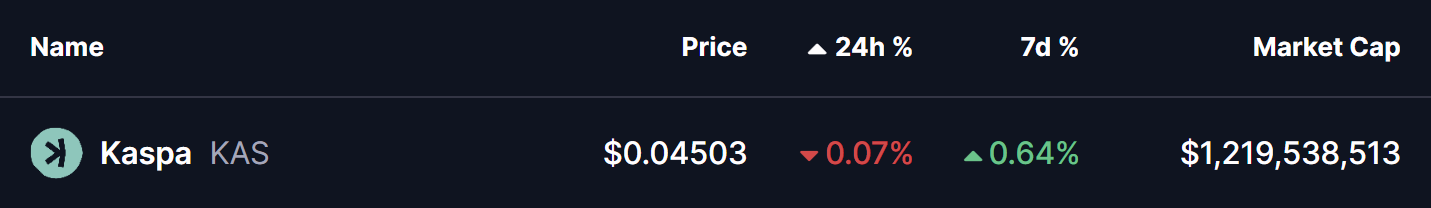
Source: Coinmarketcap
Rounding Bottom in Play
On the 4-hour timeframe, Kaspa appears to be forming a rounding bottom pattern, a classic bullish reversal structure that typically develops after a prolonged corrective phase. This pattern reflects a slow but steady transition from distribution to accumulation, as selling pressure weakens and buyers gradually regain control.
The setup began after KAS faced strong rejection near the $0.06310 neckline zone, which triggered a sharp decline through late November and December. That downside move eventually found strong demand near the $0.040 level, which has since acted as a key support area. Multiple defenses of this zone prevented further downside and helped establish a stable base for a potential trend reversal.
Since carving out that bottom, KAS has started to curve higher in a smooth, rounded fashion — closely matching the textbook structure of a developing rounding bottom. The recent stabilization above the $0.045 region further supports the idea that downside momentum is fading.
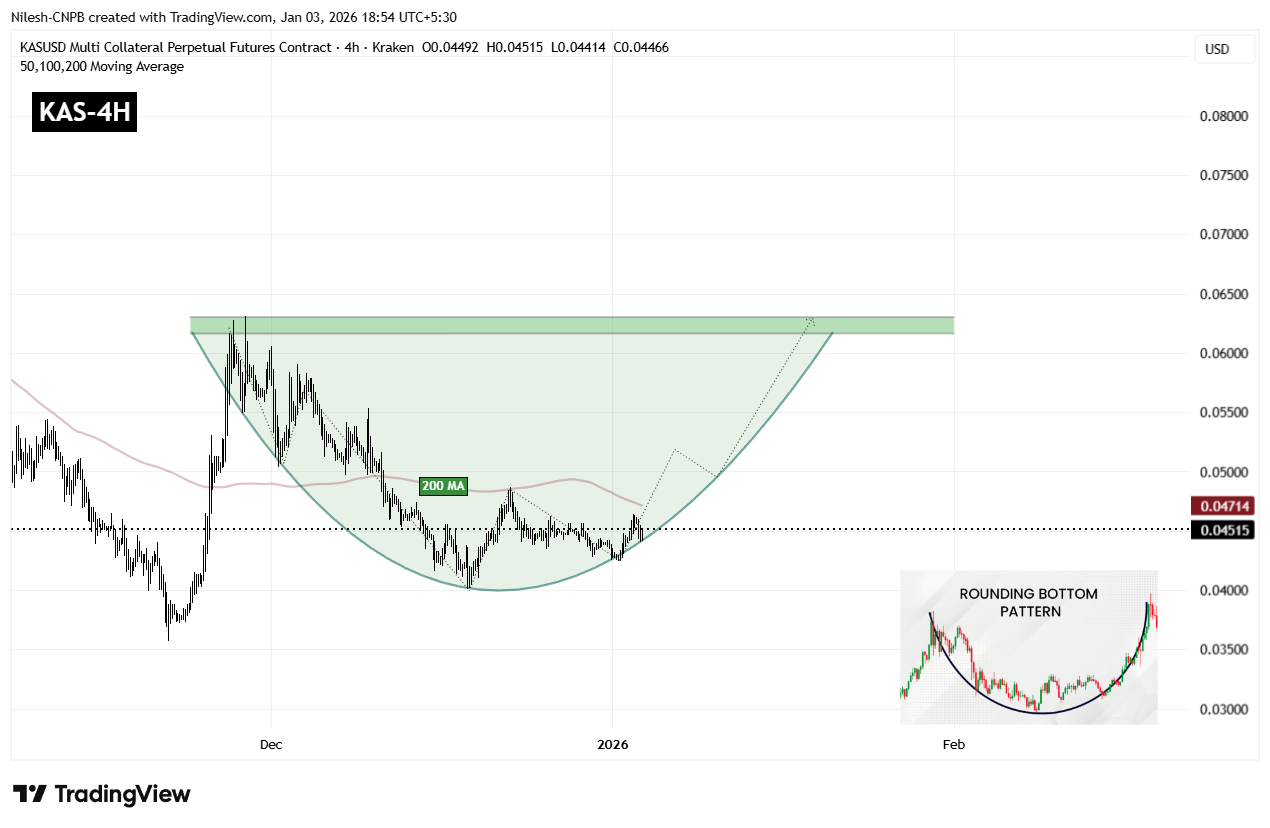
Kaspa (KAS) 4H Chart/Coinsprobe (Source: Tradingview)
A key technical level now comes into focus: the 200-period moving average, currently hovering near $0.04714. This level has acted as dynamic resistance during the recovery phase, and reclaiming it would mark an important shift in short-term market structure.
A sustained move above the 200 MA would indicate that buyers are regaining control after months of corrective price action and could act as the trigger for a stronger upside continuation.
What’s Next for KAS?
For full confirmation of the rounding bottom pattern, KAS must eventually reclaim the $0.06310 neckline resistance. A clean breakout above this zone would validate the entire reversal structure and could open the door to a broader bullish expansion phase, with momentum traders likely re-entering the market.
Until that breakout occurs, the pattern remains in development. Short-term consolidation or shallow pullbacks remain possible, especially near moving average resistance. However, as long as price continues to hold above the $0.04245 support base and maintains higher lows, the broader bottoming structure remains intact and constructive.
In the near term, all eyes remain on the 200 MA and the neckline zone. How Kaspa reacts around these levels will likely determine whether this emerging bullish setup evolves into a confirmed breakout move or requires more time to mature.
Disclaimer: The views and analysis presented in this article are for informational purposes only and reflect the author’s perspective, not financial advice. Technical patterns and indicators discussed are subject to market volatility and may or may not yield the anticipated results. Investors are advised to exercise caution, conduct independent research, and make decisions aligned with their individual risk tolerance.
About Author: Nilesh Hembade is the Founder and Lead Author of Coinsprobe, with over 5 years of experience in the cryptocurrency and blockchain industry. Since launching Coinsprobe in 2023, he has been providing daily, research-driven insights through in-depth market analysis, on-chain data, and technical research.
Disclaimer: The information on this page may come from third parties and does not represent the views or opinions of Gate. The content displayed on this page is for reference only and does not constitute any financial, investment, or legal advice. Gate does not guarantee the accuracy or completeness of the information and shall not be liable for any losses arising from the use of this information. Virtual asset investments carry high risks and are subject to significant price volatility. You may lose all of your invested principal. Please fully understand the relevant risks and make prudent decisions based on your own financial situation and risk tolerance. For details, please refer to
Disclaimer.
Related Articles
Avalanche Hits Key Resistance – Is AVAX Headed Toward $8.25?
AVAX struggles at $9.77 resistance, signaling potential downward movement toward support.
Strong selling pressure dominates, supported by spot outflows and derivative short positions.
A drop to $8.25 could occur if resistance holds and buyers fail to push higher.
Avalanche — AVAX, has
CryptoNewsLand4m ago
DeFiance Capital Founder: Going long on cryptocurrencies and shorting stocks trading strategies may be attractive, as USDC supply returns to a historical high
DeFiance Capital founder Arthur believes that the current stock market is priced too optimistically, and market shifts will accelerate adjustments. He thinks that Bitcoin and crypto assets present opportunities to perform amid uncertainty, and recommends a "long crypto, short stocks or high-yield bonds" strategy. Additionally, he mentioned that USDC supply has rebounded to historical highs, which may drive CRCL growth.
GateNews7m ago
Dogecoin (DOGE) Erases Zero as Price Rallies 11% - U.Today
Dogecoin (DOGE) has risen 11% in a week, surpassing the $0.10 mark due to short liquidations and increased whale purchases. The potential to breach the $0.105 resistance could lead to further gains. Market dynamics remain crucial for DOGE's future.
UToday11m ago
Analysts: Oil prices are returning to the mean from overbought levels, Bitcoin is returning to the mean from local oversold levels
Gate News reported that on March 16, in response to community users asking why oil prices have recently declined while Bitcoin prices have surged parabolically, crypto analyst Willy Woo responded that current oil prices are reverting to the mean from a previously overbought state, while Bitcoin is experiencing mean reversion from a locally oversold level. Willy Woo stated that this change is mainly a short-term technical adjustment and "should not be over-interpreted."
GateNews15m ago
Trader Eugene: Switched to long positions, multiple altcoins showing arc bottom formations
Trader Eugene Ng Ah Sio stated on March 16 that he would shift to a long position, believing that despite weakening global risk assets, the crypto market is performing strongly. He pointed out that the probability of a short-term rally is high and expects Bitcoin breaking through $74,000 to drive a market-wide recovery.
GateNews1h ago
XRP Price Breaks Through Key Resistance Level to $1.48, Trading Volume Surges Over 250%
On March 16, XRP price broke through the consolidation zone, rising rapidly from approximately $1.41 to $1.4798, with trading volume increasing over 250%. The current price is stabilizing above $1.4550, and technical analysis shows the next resistance level at $1.48 to $1.50. On-chain activity is also growing, indicating improved market sentiment and increased activity. Key support levels are at $1.43 to $1.44.
GateNews1h ago
