
The price of Optimism (OP) is now showing some legitimate signs of a rebound after a substantial period of weakness.
With lower highs being formed over the course of several months and substantial pressure being maintained through constant sales, it appears as if buyers are finally entering the market.
Analyst Michaël van de Poppe pointed out on X that OP held its 21-day moving average as support. That level often acts as a key signal during early trend reversals.
Since bouncing from it, the OP price has continued to push higher, suggesting this move may carry more weight than a simple relief rally.
_****Why Is Stellar (XLM) Price Up Today?**
However, the reaction from the 21-day moving average was clean and controlled. There was no sudden spike with subsequent rapid selling, but the price began to move upwards step by step. It usually reveals smooth purchasing, rather than speculative purchases for the short term.
When altcoins reclaim and hold this level, it often marks the point where momentum begins to turn. In OP’s case, the bounce helped shift the short-term trend from neutral to positive.
The Optimism Chart Shows Accumulation, Not Panic
Zooming out, the OP price appears to have formed a rounded base after its long downtrend. Following the sharp sell-off earlier in the cycle, price spent weeks moving sideways while volatility faded. This phase is often where sellers lose control and stronger hands begin accumulating.
Since then, short-term moving averages have started to curl upward, and price is now trading above them. That shift suggests downside pressure has eased and the market is trying to build a higher range.
_****SUI Short-Term Outlook: Where Could Price Be Headed Next?**
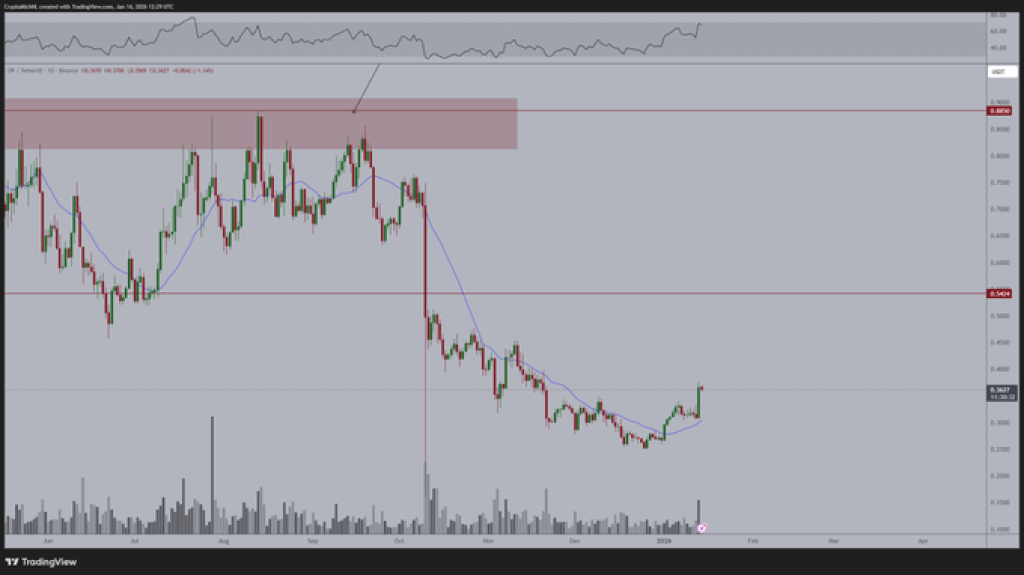
Source: X/MichealvandePoppe
Why Analysts Are Staying Patient With OP Price
Van de Poppe made it clear that he is not looking to sell OP at these levels. In his view, the project remains strong, and the current chart supports that outlook.
His comment that “the trend is now up” reflects the broader idea that OP has moved out of a defensive phase and into early recovery.
For this move to stay intact, the OP price needs to hold above recent support zones. Shallow pullbacks that respect prior lows would reinforce the bullish structure. A drop back below the 21-day average, however, would weaken the setup.
Right now, OP no longer looks heavy. Buyers are stepping in earlier, momentum has improved, and price behavior is shifting from breakdown to rebuilding. While confirmation will depend on follow-through, the current setup suggests this move is more than just a short-term bounce.
_****How Much Will 10,000 Monero (XMR) Be Worth in 2027?**
Disclaimer: The information on this page may come from third parties and does not represent the views or opinions of Gate. The content displayed on this page is for reference only and does not constitute any financial, investment, or legal advice. Gate does not guarantee the accuracy or completeness of the information and shall not be liable for any losses arising from the use of this information. Virtual asset investments carry high risks and are subject to significant price volatility. You may lose all of your invested principal. Please fully understand the relevant risks and make prudent decisions based on your own financial situation and risk tolerance. For details, please refer to
Disclaimer.
Related Articles
Crypto Market Update – River and Hyperliquid Lead Gainers As Decentralized Infrastructure Gains M...
The crypto market is displaying its typical volatility once again, yet under the noise of price movements, the beginnings of a narrative are starting to take shape. As of today, the “Top Gainers” on CoinMarketCap leans heavily towards projects targeting decentralized infrastructure and fast Layer-1s
BlockChainReporter32m ago
Solana Approaches Key Sell Wall at $84.78 — Will Momentum Hold for a Move Toward $89?
Solana is trading at an approximate price of $83.18, although a solid sell wall is at an approximate price of $84.78, which prevents upward movement.
The price is trapped between the support at $81.99 and the resistance at $84.78 which is short term consolidation.
Once buyers hit the
CryptoNewsLand1h ago
SOL Consolidates Near $84 While Chart Highlights Possible $45 Demand Zone
Solana (SOL) trades at $83.87 within a range defined by $81.03 support and $84.43 resistance, showing consolidation below a $90 supply zone. There is a broader demand area near $45, indicating potential downward movement before recovery.
CryptoNewsLand1h ago
Santiment: The surge in active USDT addresses on a certain public blockchain is correlated with the rebound of BTC
Research firm Santiment found that over the past year, when USDT active addresses on a certain public blockchain surged three times, BTC price rebounded each time, indicating that USDT liquidity has a significant impact on BTC price.
GateNews2h ago
PEPE Consolidates Above $0.05324 Support as Momentum Strengthens and Resistance Near $0.05336 Holds
PEPE has a tight intraday price compression with a support level of $0.053243 and resistance level of $0.053363.
A RSI of 64.13 represents the moderate bullish momentum whereas MACD history is slightly positive, which indicates the gradual buying momentum.
The price is at $0.053364
CryptoNewsLand2h ago
Michael Saylor: Strategy - There is a time lag between buying Bitcoin and price appreciation
Gate News reports that on March 12, Strategy founder Michael Saylor posted: "There is a time lag between when we purchase Bitcoin and when the Bitcoin price skyrockets."
GateNews2h ago