
Key Takeaways
-
OriginTrail (TRAC) has surged around 12% in a single day, drawing renewed attention to the token.
-
TRAC has broken out from an ascending triangle near $0.46 on the daily chart, signaling growing bullish momentum.
-
Similar breakout structures in July and October 2025 previously led to strong rallies of 63% and 113%.
-
Holding the $0.44–$0.46 zone as support will be crucial to keep the bullish fractal setup intact.
-
If the pattern plays out, TRAC could attempt a move toward its long-term ascending resistance above $1.00.
OriginTrail, the decentralized knowledge graph protocol, is stepping back into the spotlight as its native token TRAC records a strong 12% daily surge. Beyond the price jump, the real signal is coming from the charts, where a familiar fractal breakout structure is starting to emerge on the daily timeframe, hinting that a larger upside move could be forming.
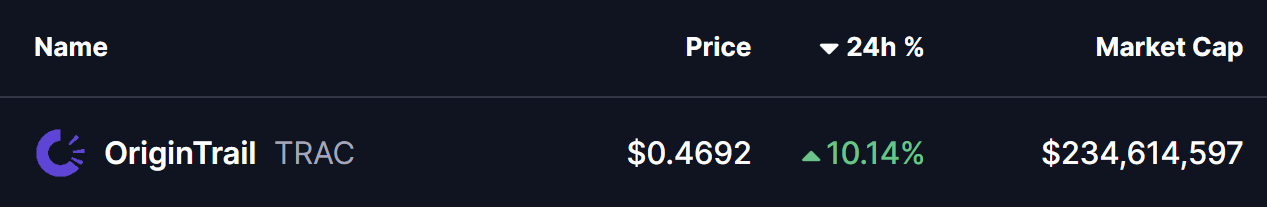
Source: Coinmarketcap
Fractal Breakout Hints at Potential Upside Move
On the daily chart, TRAC has confirmed a breakout from an ascending triangle pattern near the $0.46 level. This breakout is particularly important as price is now trading just above the 200-day moving average, a level that has historically acted as a major trend-defining zone for TRAC.
What makes this setup more compelling is its similarity to previous breakout phases. In late July 2025, a comparable structure resulted in a 63% upside move after price held above its breakout base. Later, in early October 2025, TRAC broke out from a right-angled descending broadening wedge pattern. That move was followed by a reclaim of the 200-day moving average and ultimately led to a powerful 113% rally.
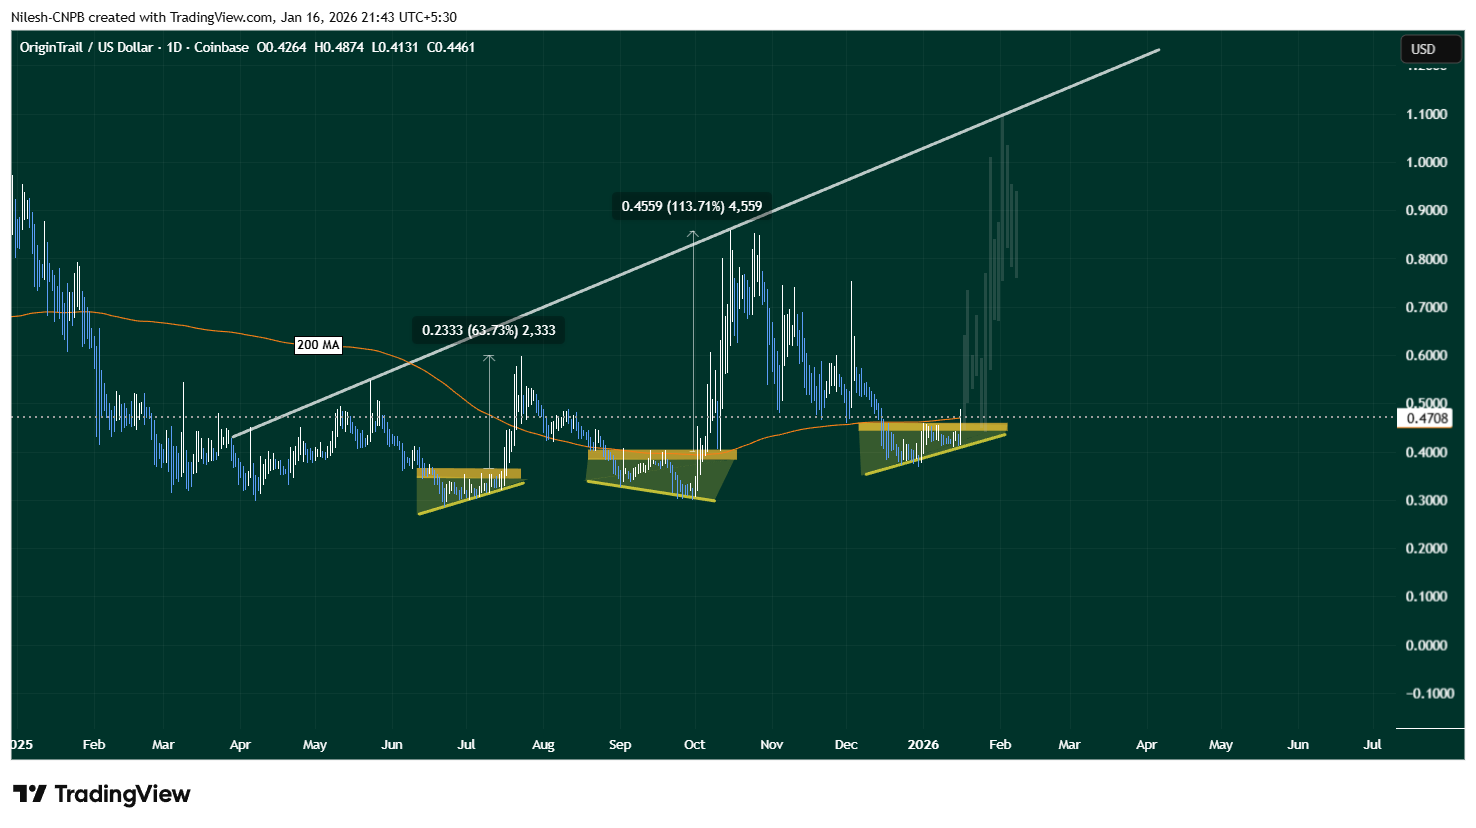
OriginTrail (TRAC) Daily Chart/Coinsprobe (Source: Tradingview)
The current setup shares key characteristics with those earlier moves. Price compression, a clean breakout, and interaction with the 200-day MA suggest that TRAC may once again be transitioning from consolidation into expansion.
What’s Next for TRAC?
If this fractal breakout plays out as expected, holding the $0.44–$0.46 zone as support will be crucial. A sustained hold above this range, along with continued strength above the 200-day moving average, could act as a launchpad for further upside.
In that scenario, TRAC may attempt a move toward its long-term ascending resistance trendline, which currently sits above the $1.00 level. A push toward that zone would align closely with the magnitude of prior fractal-driven rallies seen on the chart.
That said, fractal patterns are never guarantees. Broader market conditions, liquidity, and overall sentiment will continue to influence price action. A failure to hold the $0.44–$0.46 support zone or a rejection back below the 200-day moving average could invalidate the breakout and weaken the bullish fractal thesis.
Bottom Line
TRAC is showing early signs of another technically significant breakout, supported by historical fractal behavior and a reclaim of a key long-term moving average. If buyers can defend the current support zone, the chart suggests that OriginTrail may be positioning itself for a larger upside move in the weeks ahead.
Disclaimer: The views and analysis presented in this article are for informational purposes only and reflect the author’s perspective, not financial advice. Technical patterns and indicators discussed are subject to market volatility and may or may not yield the anticipated results. Investors are advised to exercise caution, conduct independent research, and make decisions aligned with their individual risk tolerance.
About Author: Nilesh Hembade is the Founder and Lead Author of Coinsprobe, with over 5 years of experience in the cryptocurrency and blockchain industry. Since launching Coinsprobe in 2023, he has been providing daily, research-driven insights through in-depth market analysis, on-chain data, and technical research.
Disclaimer: The information on this page may come from third parties and does not represent the views or opinions of Gate. The content displayed on this page is for reference only and does not constitute any financial, investment, or legal advice. Gate does not guarantee the accuracy or completeness of the information and shall not be liable for any losses arising from the use of this information. Virtual asset investments carry high risks and are subject to significant price volatility. You may lose all of your invested principal. Please fully understand the relevant risks and make prudent decisions based on your own financial situation and risk tolerance. For details, please refer to
Disclaimer.
Related Articles
Bitcoin Gets Its Own ‘Fear Gauge’ as Cboe Announces BITVX Index
Cboe Global Markets is bringing Wall Street’s favorite volatility playbook to bitcoin, announcing plans to launch a new index designed to track the market’s expected price swings using options tied to the popular Ishares Bitcoin Trust ETF.
BITVX: Cboe Applies VIX Methodology to Bitcoin ETF
Coinpedia1h ago
Strategy’s Michael Saylor Reveals $1.28B Bitcoin Purchase, Holdings Reach 738,731 BTC
Michael Saylor, executive chairman of Strategy, posted a brief but blunt update that stopped scrolling feeds: “Strategy has acquired 17,994 BTC for ~$1.28 billion at ~$70,946 per Bitcoin. As of 3/8/2026, we hodl 738,731 $BTC acquired for ~$56.04 billion at ~$75,862 per Bitcoin.” The numbers speak fo
BlockChainReporter1h ago
ETH 15-minute increase of 1.96%: On-chain large fund inflows and technical breakthroughs jointly amplify the rally
2026-03-09 19:15 to 19:30 (UTC), ETH achieved a short-term return of 1.96%, with the price range between 2010.14 and 2050.5 USDT, and an amplitude of 2.01%. Trading volume during this period significantly increased, market attention rapidly grew, and price fluctuations drew high investor interest.
The main driver of this movement was multiple large transfers of over 10,000 ETH on the blockchain, primarily flowing to a major exchange, indicating institutional or large investor accumulation, with positive capital inflows. At 19:15, ETH suddenly
GateNews3h ago
BTC 15-minute increase of 1.42%: On-chain capital inflow and technical breakout points resonate to trigger buying interest
From 19:15 to 19:30 on March 9, 2026 (UTC), the BTC price experienced a 15-minute return of +1.42%, with trading ranges between 68,377.3 and 69,365.3 USDT, and a volatility of 1.44%. This fluctuation far exceeds the regular intraday volatility levels, with market attention significantly heightened, and short-term buying surges intensifying the volatility.
The main driver of this movement was net inflow of on-chain funds, triggered by large transfers from major holder accounts, along with buy orders breaking through key technical resistance levels.
GateNews3h ago
Dogecoin Tests $0.090 Support After 3.4% Drop as Traders Watch Key Price Range
Dogecoin is currently trading at $0.09061 which is a drop of 3.4 percent, and the price is close to the important level of $0.09011 support.
The chart indicates a series of tests of the support zone of $0.089-$0.090, and the closest resistance is represented by $0.09353.
A hold of
CryptoNewsLand3h ago
Cardano Sees 1.7B ADA Traded as Price Tests Key Support
Key Insights
Cardano recorded more than 1.7 billion ADA in trading volume within 24 hours as market sentiment weakened and traders reacted cautiously.
On-chain data shows roughly 230 million ADA sold during the past week, which intensified selling pressure and pushed prices lower.
Cardano
CryptoFrontNews3h ago