
Key Takeaways
-
Monad (MON) has dropped nearly 41% over the past two months but is showing early signs of stabilization.
-
Price action suggests a potential double bottom pattern forming near the $0.018 support zone.
-
Buyers have repeatedly defended the same support level, hinting at fading selling pressure.
-
A move above the 50-day moving average could strengthen the short-term bullish outlook.
-
A confirmed breakout above the $0.02970 neckline may open the door for a stronger recovery rally.
Monad (MON), the native token of the Monad Layer-1 blockchain, has been under pressure in recent weeks. The token is down roughly 41% over the past 60 days, driven by a slowdown in TVL growth and a decline in application-level revenue across the ecosystem.
However, sentiment may be starting to shift. MON posted a 12% bounce today, and more importantly, its price structure on the daily chart is beginning to show early signs of a bullish reversal — suggesting the downside momentum could be losing steam.
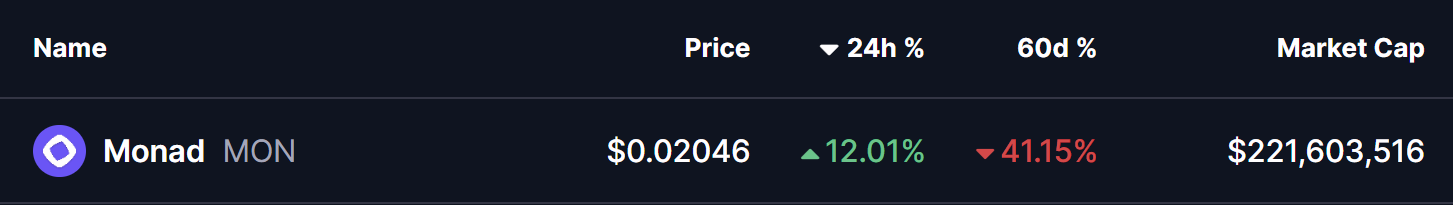
Source: Coinmarketcap
Double Bottom Pattern in Play
On the daily timeframe, MON appears to be forming a potential double bottom pattern, a classic bullish reversal structure that often develops near the end of extended downtrends.
The first bottom was formed when MON dropped toward the $0.018 support zone, followed by a rebound that carried price back toward the neckline resistance near $0.02970. That recovery attempt was rejected, sending MON back down to retest the same support level.
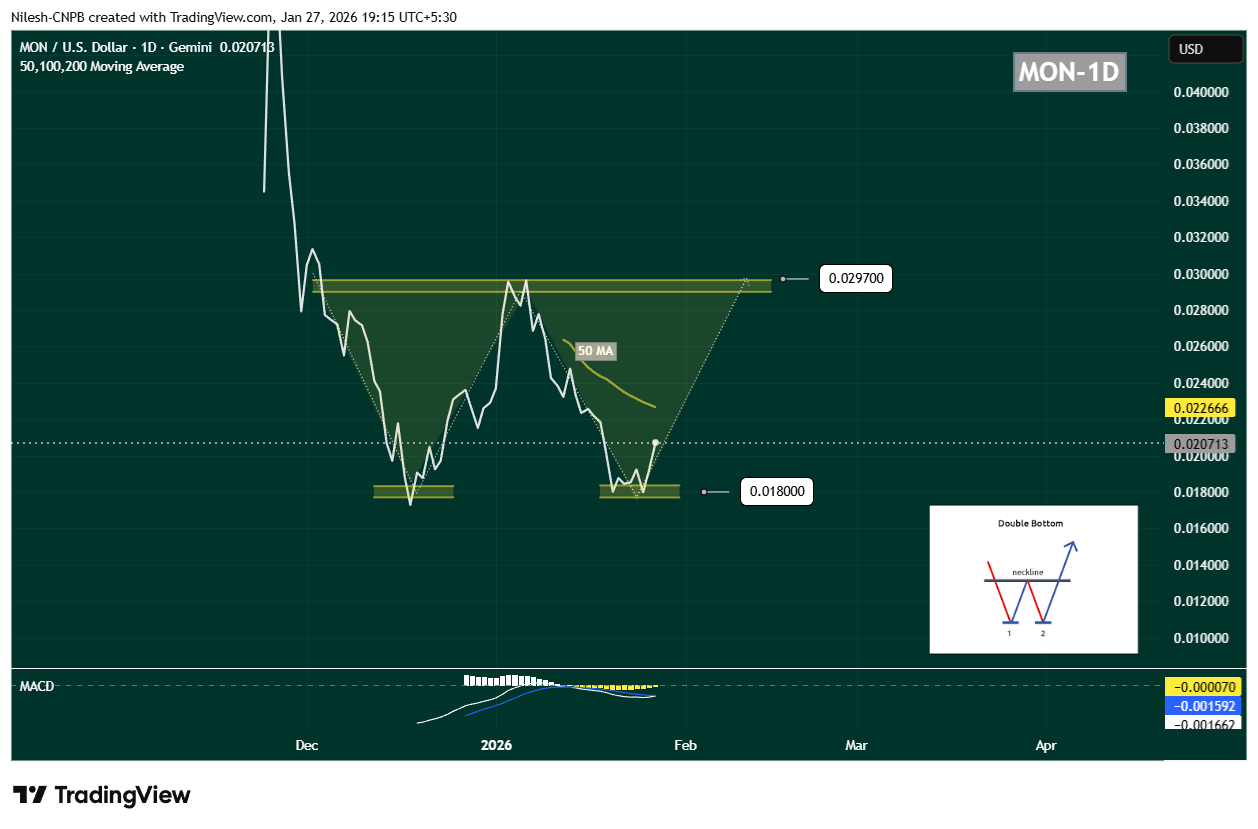
Monad (MON) Daily Chart/Coinsprobe (Source: Tradingview)
What’s notable this time is buyer behavior. Once again, demand emerged around $0.018, preventing a breakdown and forming the second bottom of the structure. MON is currently trading near $0.02071, indicating that selling pressure may be fading.
Momentum indicators are starting to support this view. The MACD is showing early signs of a potential bullish crossover, often seen as an initial signal that downside momentum is weakening and buyers may be preparing to step back in.
What’s Next for Monad (MON)?
For this bullish setup to gain credibility, MON needs to reclaim the 50-day moving average, which is currently positioned near $0.02266. A sustained move above this level would signal a shift in short-term momentum and improve the probability of a recovery rally.
If buyers manage to push price back toward the $0.02970 neckline, the market will be watching closely. A decisive breakout above this resistance, ideally followed by a successful retest, would confirm the double bottom pattern and open the door for a stronger upside move.
On the downside, the $0.018 support zone remains the most critical level to defend. A breakdown below this area would invalidate the bullish structure and likely expose MON to another leg of downside or extended consolidation.
Bottom Line
Despite recent weakness, MON’s technical structure is starting to look constructive. The repeated defense of identical lows, the emergence of a double bottom pattern, and improving momentum signals suggest that Monad could be approaching a potential turning point.
If key support continues to hold and the token reclaims its short-term moving averages, MON may be setting the stage for a recovery phase — especially if broader market conditions stabilize in the days ahead.
Disclaimer: The views and analysis presented in this article are for informational purposes only and reflect the author’s perspective, not financial advice. Technical patterns and indicators discussed are subject to market volatility and may or may not yield the anticipated results. Investors are advised to exercise caution, conduct independent research, and make decisions aligned with their individual risk tolerance.
About Author: Nilesh Hembade is the Founder and Lead Author of Coinsprobe, with over 5 years of experience in the cryptocurrency and blockchain industry. Since launching Coinsprobe in 2023, he has been providing daily, research-driven insights through in-depth market analysis, on-chain data, and technical research.
Disclaimer: The information on this page may come from third parties and does not represent the views or opinions of Gate. The content displayed on this page is for reference only and does not constitute any financial, investment, or legal advice. Gate does not guarantee the accuracy or completeness of the information and shall not be liable for any losses arising from the use of this information. Virtual asset investments carry high risks and are subject to significant price volatility. You may lose all of your invested principal. Please fully understand the relevant risks and make prudent decisions based on your own financial situation and risk tolerance. For details, please refer to
Disclaimer.
Related Articles
Ripple Price Prediction: XRP Could Explode to $2 but This Has to Happen First
XRP’s price has failed to capitalize on a major move higher this week and has retreated to about $1.44, roughly in line with how the rest of the market has behaved during the same period.
According to popular technical analyst _CRYPTOWZRD, _the altcoin might be poised for another leg up, but
CryptoPotato32m ago
The Definitive Stablecoin Landscape Series: North America
Stablecoins are undergoing an evolution into a foundational financial infrastructure. North America leads in development, focusing on regulated, compliant options. The market shows a shift with RLUSD gaining traction due to integration with Ripple, emphasizing real demand over exchange liquidity.
CoinDesk39m ago
Shiba Inu Tests Key Resistance as Reversal Signals Build
Key Insights
Shiba Inu shows early reversal signals as price forms higher lows and compresses under resistance, reflecting a shift toward controlled accumulation behavior.
The 50 EMA remains a decisive level, with a sustained move above it likely to confirm momentum change and attract
CryptoNewsLand1h ago
Exchange "Launch Curse" Investigation: Why do 89% of new coins ultimately become retail investor harvesting machines?
After being listed on Binance, most tokens faced severe losses, with an average retracement of 71% to 80%. Being listed is no longer seen as an investment opportunity but rather as an insider sell-off event. The main reasons include internal liquidity events, overvaluation, weak capital flows, and market saturation; only projects with real products and communities can survive in the future.
区块客2h ago
Li Hua Yi: The cryptocurrency market is in a bear market, and its performance over the past four years has been disappointing and lacking in disruptive innovation.
Gate News reported that on March 27, Yi Lihua published a post on platform X expressing his views on the current state of the cryptocurrency market. According to his perspective, the current cryptocurrency market is in a bear market and the war is not yet over, lacking significant rebounds. Yi Lihua stated that the performance of the cryptocurrency sector over the past four years has been disappointing, with the crypto middle class, retail investors, and VCs all being harvested, while exchanges, market makers, and project teams continue to extract funds. He pointed out that the current capital inflow in the market mainly comes from Wall Street ETFs, DAT, and a few believers, and that there has not yet been any disruptive innovation in the cryptocurrency sector.
GateNews3h ago
Oil & Metals Crush Hyperliquid Volume in 67% Domination!
The latest report highlights a major shift on Hyperliquid, where commodity-based perpetual contracts have emerged as a dominant trading segment. These instruments allow traders to gain exposure to assets like oil and metals without directly owning them. In Q1 2026, commodity perpetuals accounted
Coinfomania3h ago
