SUI trades near $0.97 ahead of Grayscale’s GSUI ETF launch on NYSE Arca, with weekly gains of 10% and rising open interest.
SUI price is trading near key resistance levels as Grayscale prepares to launch its Sui Staking ETF under the ticker GSUI.
The token has posted steady weekly gains, and traders are watching whether the ETF debut could drive further price movement.
SUI Records Weekly Gains Ahead of ETF Launch
SUI traded around $0.97 on Wednesday after a modest daily increase of less than 1%.
Over the past seven days, the token has gained about 10%, reflecting gradual upward momentum.
The broader crypto market has also shown signs of recovery. Bitcoin traded above $68,000, while Ethereum hovered near the $2,000 level.
Other major altcoins such as Solana, XRP, and Dogecoin recorded mild gains during the same period.
SUI has remained above the $0.90 support zone in recent sessions. Market participants are monitoring whether sustained trading above $0.98 could support additional upside pressure.
Grayscale’s GSUI ETF Set for NYSE Arca Trading
Grayscale Investment confirmed that its Sui Staking ETF will begin trading on NYSE Arca under the ticker GSUI.
The launch follows an 8-A filing with the US Securities and Exchange Commission, which became effective automatically.
Grayscale Sui Staking ETF (Ticker: $GSUI) offers investors direct exposure to $SUI. 💧 $GSUI starts trading tomorrow on @NYSE Arca. pic.twitter.com/HzhTyAd3pd
— Grayscale (@Grayscale) February 18, 2026
The ETF is designed to provide regulated exposure to the SUI token. Investors will gain access to SUI price performance and potential staking rewards through a traditional exchange-traded product structure.
The fund carries a management fee of 0.35%, though Grayscale stated that the fee will be waived for the first three months.
The waiver remains in place until assets under management reach $1 billion. The launch adds another crypto-linked ETF to US markets.
**Related Reading: **$143M in Short Liquidations Stack Above SUI – What Happens Next?
Technical Indicators and Price Levels in Focus
SUI recently tested resistance near the $1.20 level after stabilizing above $1.00. Analysts are observing whether the token can break above this resistance and approach the $1.50 range.
The Relative Strength Index stands near 52, which suggests moderate bullish momentum without entering overbought territory. Meanwhile, the Moving Average Convergence Divergence indicator shows the short-term line approaching the signal line.
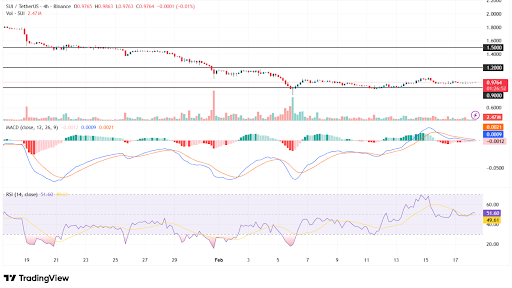
SUI consolidates near resistance as momentum cools. Source: TradingView
Open interest in SUI derivatives rose by 0.82% to about $512.65 million. The increase suggests growing trading activity as the ETF launch approaches.
Traders continue to monitor the $0.90 support level, as a break below that area could shift short-term price direction.
Disclaimer: The information on this page may come from third parties and does not represent the views or opinions of Gate. The content displayed on this page is for reference only and does not constitute any financial, investment, or legal advice. Gate does not guarantee the accuracy or completeness of the information and shall not be liable for any losses arising from the use of this information. Virtual asset investments carry high risks and are subject to significant price volatility. You may lose all of your invested principal. Please fully understand the relevant risks and make prudent decisions based on your own financial situation and risk tolerance. For details, please refer to
Disclaimer.
Related Articles
Solana Eyes $90.6 Trigger Point as $83 Support Holds and Liquidation Pressure Builds
A large cluster of short positions faces liquidation if SOL reaches $90.6, potentially increasing volatility.
SOL trades between $83.00 support and $89.58 resistance, keeping price action compressed in the short term.
SOL posts a 0.8% daily gain and rises 0.7% against BTC, holding
CryptoNewsLand1m ago
Crypto Market Plunges As Extreme Fear Controls Investor Sentiment
The global crypto market is notably bearish, with a 2.93% drop in market capitalization to $2.32T. Bitcoin and Ethereum saw decreases of 3.07% and 4.01%, respectively. Meanwhile, notable gainers include $XBTC, $TRUMP, and $PEPE. DeFi TVL and NFT sales also declined significantly, while key investments from YZi Labs and Kazakhstan's central bank emerged.
BlockChainReporter31m ago
HBAR at a Crossroads: Will $0.095 Support Trigger a Break Toward $0.106?
HBAR is trading at $0.09739 and above the S/R flip of $0.094-$0.096 in the 12H chart.
The nearest resistance will be at $0.10 with a falling trendline pressure at around $0.104-$0.106.
The support is at $0.095835 and a breakdown at the
CryptoNewsLand52m ago
DXY Retest at 99.183: Will 100–101 Break as US Degen Index Stabilizes?
DXY trades at 99.183 while retesting the 100–101 monthly resistance zone.
US Degen Index 6900 sits at $0.0001197 with support at $0.0001175 and resistance at $0.0001214.
A break above 101 on DXY would shift structure higher, while rejection keeps price below key resistance.
The U.
CryptoNewsLand55m ago
PEPE Hovers at Critical $0.053414 Support as $432M Volume Surge Tightens Breakout Watch
PEPE is trading at $0.053416, just above support at $0.053414, with significant trading volume up 22.14%. Resistance is at $0.053676. Despite a slight decrease in price, there’s increased market activity, suggesting potential volatility.
CryptoNewsLand58m ago
Expert Claims Altcoin Metrics Are Being 'Gamed' to Mislead Investors
Crypto researcher Orbion raises concerns over the possible manipulation of key market indicators, including the Altseason Index and Crypto Fear and Greed Index, suggesting that inflated metrics create false optimism and mislead investors about the onset of altcoin season.
Coinpedia1h ago